Persistency of Lactation, Lactation Yield, and Lactation Length in Thari Cattle at Thari Cattle Farm, Umerkot, Sindh
Zulekha Zameer, Kauser A. Malik, and Asma Maqbool*
Kauser Abdualla Malik (KAM) School of Life Sciences (SLS), Forman Christian College (A Chartered University), Lahore, Pakistan
ABSTRACT
Background. Over the last century, the increased crop production has largely been attributed to rampant input of nitrogen fertilizers causing environmental deterioration. There is a need to engineer crops that require minimal fertilizer input. A transcription factor ‘Triticum aestivum Dof1 (TaDof1)’ is known to improve the nitrogen use efficiency (NUE) of crop plants, by regulating the activity of multiple genes, involved in carbon and nitrogen metabolism, when plants are grown under nitrogen-limiting conditions. Previously, transgenic wheat plants, overexpressing TaDof1, were developed.
Method. The main objective of the current study was to compare the T2 generation of six different transgenic wheat lines transformed with TaDof1-namely, F1, G1, G2, G3, G4, and G5-with respect to their metabolic, biochemical, and morphological traits under normal and nitrogen-deficient conditions. BASTA assay and conventional PCR were used to screen out the positive plants. The expression of TaDof1 in aforementioned transgenic lines along with the four genes (Glutamine synthetase, nitrite reductase, phosphoenolpyruvate carboxylase and pyruvate kinase) associated with TaDof1 in carbon and nitrogen metabolism were quantified through RT-PCR and real-time PCR.
Results. The T2 generation of TaDof1 transgenic wheat lines overexpressed the transcription factor TaDof1 along with the other regulated genes. The expression of TaDof1 gene ranged from 0.68-7.61 folds, with the highest fold recorded in line G2. Protein, soluble sugars, phosphorous, chlorophyll, and relative water content were enhanced in almost all transgenic lines.
- Transcription factor TaDof1 can be employed in engineering plant metabolism to promote plant growth.
- An analysis of quantitative RT-PCR results shows evidence of intricate and cooperative modulation of genes leading to enhanced nitrogen assimilation and carbon metabolism in TaDof1 T2 transgenic lines
- Transgenic plants overexpressing transcription factor TaDof1 exhibit better agronomical and biochemical traits.
1. INTRODUCTION
Nitrogen is amongst the critical yield factors required for the optimal growth of crop plants. This macronutrient plays a pre-eminent role in the synthesis of a number of coenzymes, nucleic acids, chlorophyll, and various secondary metabolites in crop plants [1]. Generally, the objectives of sustainable agricultural production are achieved through employing an enormous amount of nitrogen in the form of organic as well as inorganic fertilizers [2]. Over the past five decades, the improved crop productivity has largely been attributed to a global 20-folds increase in the application of nitrogen fertilizers [3]. However, a predominant concern is that nitrogenous compounds are usually present in ammonium or nitrate ions in soil [4]. This implies that the crop plants can utilize only about 30-40% of the applied nitrogen fertilizer, while more than 60% of the soil nitrogen is lost through numerous mechanisms including leaching, denitrification, volatilization, surface run-off, and microbial consumption [5].
The challenge is to enhance the plants’ capability in order to absorb and assimilate nitrogen content from the surrounding soil, while ensuring minimum transfer of unused and reactive nitrogen to environment. In this regard, enhancing nitrogen use efficiency (NUE) of crops seems to be a promising initiative to ensure agricultural sustainability [6]. Crop plants generally own a complex and an intricate regulatory machinery that is imperative in the coordination of nitrogen assimilation, carbon metabolism, nutrient availability, and plant growth [7]. Various approaches have been used to enhance the NUE of crop plants. Some reported measures include molecular engineered root traits favorable for effective acquisition of nitrogen from the soil; desirable transporters required for mineral uptake; homeostasis and redistribution of various nutrients; and upregulation or down regulation of enzymes for nutrient assimilation. However, the overexpression of genes involved in nitrogen and carbon metabolism seems to be a promising strategy [8].
A number of transcription factors are reported that enhance the NUE of crop plants [9]. Dof1 is a protein that belongs to a particular family of transcription factors in which DNA binds to only one finger. Crops genetically engineered with transcription factor Dof1 exhibit enhanced nitrogen assimilation as compared to non-transformed varieties under nitrogen stress conditions [10]. Dof1 proteins are generally associated with a couple of genes typically involved in the regulation of: carbohydrate metabolism, vascular development, phloem sugar transport, light signaling, flowering time, storage protein synthesis, dormancy, photochromic signaling, and photosynthetic carbon assimilation [11].
The cereal crop wheat (Triticum aestivum L.) is the second most important crop cultivated across the globe. It plays a vital role to meet the daily nutritional requirements of human nourishment [12]. In fact, 65% of the wheat globally produced is utilized for the manufacturing of human food, while the remaining is used for livestock industry. Moreover, wheat also provides for more than 20% of the calories consumed globally [13]. It has been anticipated that by 2050, the requirement of wheat would soar till 840 million tons in comparison to the prevalent production rate of 642 million tons [14]. Owing to the rising demand of this crop plant, the need of the hour is to engineer wheat varieties with enhanced NUE in order to ensure agricultural sustainability.
Previously, the transcription factor TaDof1 was transformed in two elite wheat cultivators [15]. The current study aimed to compare the biochemical and morphological traits of T2 generation of six TaDof1 transgenic wheat lines. Expression profiling of TaDof1 gene in transgenic plants and four genes regulated by it was evaluated under normal and nitrogen limiting conditions.
2. METHODOLOGY
2.1. Growth of Control and T2 Transgenic Plants
Control (FSD-2008 and Galaxy) and transgenic (F1, G1, G2, G3, G4, and G5) plants were sown in pre-autoclaved sand, and placed in a climate room under controlled conditions, at ± 25℃. All the plants were subjected to normal Hoagland solution for four weeks [16].
2.2. Screening of the Transgenic Plants with PCR and BASTA Assay
The CTAB method, proposed by Murray and Thompson, was used to extract the total genomic DNA from fresh flag leaves of control as well as transgenic plants [17]. For the selection of transgenic plants, conventional PCR was carried out with gene junction primers [15] using PCR profile as mentioned: initial denaturation for 5 minutes at 95℃, followed with 40 cycles of denaturation for 45 seconds at 95℃, annealing for 45 seconds at 54℃, and extension for 45 seconds at 72℃, along with the final extension for 10 minutes at 72℃. The composition of PCR reagents is provided in the supplementary Table 1. The efficiency of PCR was ensured by negative and positive controls, which included genomic DNA from control plants and TaDof1 construct as templates, respectively.
For further validation of transgenic plants, the presence of bar gene in T2 transgenic plants was confirmed through painting 0.005% BASTA (phosphinothricin) solution on a three-week-old plant leaf [18]. Traces of necrosis and discoloration were observed within 7–14 days of herbicide leaf paint application. Plants which showed resistance to BASTA were considered as positive transgenic plants, and used for further analysis.
Table 1.Optimized Primers for RT-PCR and qRT-PCR| Primers | Sequence of Primer (5՜–3՜) | Annealing Temperature (℃) |
|---|---|---|
| TaDofF1 | 5՜-CAACTACAACCTGTCGCAGC-3՜ | 58℃ |
| TaDofR1 | 5՜-GGCTAGGGTAGGTAGACGGA-3՜ | |
| 18sF | 5՜-AAACGGCTACCACATCCAAG-3՜ | 58℃ |
| 18sR | 5՜-AGTAACGATGCCGGAACAC-3՜ | |
| GSF | 5՜-ATCTGTGACACCTACACGCC-3՜ | 60℃ |
| GSR | 5՜-ATCTGTGACACCTACACGCC-3՜ | |
| NIRF | 5՜-CACGACCTGTACGAGCACC-3՜ | 60℃ |
| NIRR | 5՜-TCGTCGATGAGCCACATCAT-3՜ | |
| PEPCF | 5՜-CTGCCCGGTGACAATTTTGG-3՜ | 58℃ |
| PEPCR | 5՜-TGCATCCTTGCCTGAGTCTG-3՜ | |
| PKF | 5՜-GGCTACTGACGTCGCAAATG-3՜ | 54℃ |
2.3. Nitrogen Stress to Transgenic and Control Plants
After four weeks of germination, both the transgenic and control plants were subjected to leaching where all the nutrients were drained out from the sand [19]. Two days after leaching, all the plants were divided into four groups. Half of the transgenic plants were subjected to normal Hoagland solution, while the other half were given stress Hoagland solution [15] for the next four weeks. The stress Hoagland solution differed by reducing the concentration of inorganic nitrogen from normal to half of the original concentration (2.5 mM Ca(NO3)2·4H2O and 2.5 mM KNO3) (Supplementary Table 2). Same treatment was given to Faisalabad and Galaxy control plants.
Table 2.Mean Response of Transgenic and Control Wheat Lines for Various Agronomic| Plant | Height of Plant (cm) | No. of Spikes | Length of Spike (cm) | Total Seeds per Plant | 100 Seeds Weight (g) |
|---|---|---|---|---|---|
| FSD | 83.7a | 8a | 7.86a | 140a | 3.56a |
| F1 | 95.2b | 14b | 11.61b | 780a | 4.5b |
| GAL | 89.3a | 10a | 10.1a | 244a | 4.41a |
| G1 | 93.7a | 16b | 10.45b | 680b | 4.45a |
| G2 | 90a | 16b | 10.95b | 909b | 4.44a |
| G3 | 90a | 16a | 10.8b | 535a | 4.37a |
| G4 | 94.7b | 16b | 10.4b | 785.7b | 4.82a |
| G5 | 94.7a | 16b | 10.2b | 608a | 5.14a |
The data is expressed as mean of three independent replicates. Different letters for superscripts depict that significant difference exist where p values < 0.05 as per Dunnett test
2.4 Expression Analysis by Real Time PCR
2.4.1 Extraction of RNA and Synthesis of cDNAAfter four weeks of application of nitrogen stress, total RNA extraction was conducted from the fresh leaves of 8-weeks-old transgenic and control plants by following the method proposed by Kistner and Matamoros [20]. The isolated RNA was reverse transcribed using oligo-dt primers as per the manufacturer’s protocol elucidated in RevertAidTM H minus first-strand cDNA synthesis kit (Thermo-scientific, USA). The composition of reaction mixture and reaction profile for cDNA synthesis is provided in Supplementary Table 2.
2.4.2 Real Time PCRExpression profiles of transcription factor TaDof1 gene and the genes synchronized by this transcription factor in wild-type and transgenic plants were evaluated. For that, the synthesized cDNA was used for RT-PCR, ultimately followed by qRT-PCR. Real time PCR was carried out by employing Maxima SYBR Green/ROX qPCR master mix (cat#K0221). For template equalization, 18s gene was used as an internal control. All the reactions were run in triplicates. A standard curve was constructed using 1:10 dilutions for TaDof1 plasmid (Supplementary Figure S1-b). For TaDof1 amplification, primer pair TaDofF1 and TaDofR1 was used, while for 18s gene amplification, primer pair 18sF and 18sR was used (Table 1). Likewise, the genes expected to be regulated by TaDof1—glutamine synthetase (GS), pyruvate kinase (PK), phosphoenolpyruvate carboxylase (PEPC), and nitrite reductase (NIR)—were quantified using PEPCF and PEPCR, PKF and PKR, GSF and GSR, and NIRF and NIRR primers, respectively (Table 1). Final results for relative fold increase in gene expression were analyzed by Livak method [18].
(a) (b)
(b)
2.5 Biochemical Analysis
2.5.1. Soluble Protein Concentration. The concentration of total soluble proteins in plants was estimated through modifying the methodology proposed by Bradford [21]. Around 200 mg of phylloplane (leaf) was crushed and macerated in 2 ml of sodium phosphate buffer to prepare an extract, which was then centrifuged for 10 minutes at 5000 rpm. Approximately, 0.5 ml of the filtrate was added to 2 ml of Coomassie blue reagent. The samples were then allowed to incubate for five minutes at room temperature. The respective absorbance of the samples was determined at 525 nm. The amount of soluble protein was determined using a protein standard curve which was plotted against known concentrations of bovine serum albumin (BSA) (Supplementary Figure 2-a).
(a)
2.5.2 Soluble Sugar Content.
The strategy proposed by Malik and Srivastava [22] was adopted to estimate the amounts of soluble sugars in transgenic plants. Approximately, 100 mg of dried leaf was crushed in 2 ml of 80% acetone. The homogenized sample was then incubated in a shaking incubator at 37℃ for 24 hours. The prepared extract was further centrifuged for 10 minutes at 2900g. Afterwards, 0.5 ml of the supernatant was added to 5ml of prepared anthrone reagent. The suspension was boiled at 95℃ for 12 minutes in a water bath. After rapid cooling of samples in ice, the absorbance was finally recorded at the wavelength of 625 nm in a spectrophotometer. The amount of soluble sugar present in the leaf samples of transgenic plants was evaluated using the formula mentioned by Hasnain et al. [15].
2.5.3 Chlorophyll Content
The Arnon method [23] was used for the quantification of total chlorophyll content from the leaf samples. Around 200 mg of phylloplane was grounded in 10 ml of 80% acetone. The prepared extract was then centrifuged for 10 minutes at 2500 rpm. The filtrate was collected in a falcon tube and the total volume was maintained up to 10 ml by adding extra 80% acetone. The final absorbance of the prepared extracts was recorded at 663 nm and 645 nm. Total chlorophyll content was determined with the formulae mentioned by Arnon [23].
2.5.4 Phosphorous Content
The strategy devised by Campbell et al. [24] was adopted to estimate the phosphorous content. Fresh leaf sample was dried at 65℃, weighed, and turned into ash at 550℃ in a muffle furnace. The weight of ash was determined, which was then dissolved in 0.9 M H2SO4 at the ratio of 10 mg DW ml−1 acid. Approximately, 100 µl of prepared sample was mixed with 900 µl color reagent molybdate blue. After five minutes of incubation at room temperature, absorbance of the sample was taken at 820 nm. The final concentration of phosphorous in samples was calculated by constructing a standard curve by plotting recorded absorbance against known concentrations of KH2PO4 solution (Supplementary Figure 2-c).
2.5.5 Relative Water Content (RWC)
The relative water content (RWC) of samples was determined using the methodology proposed by Barrs and Weatherly [25]. Fresh leaf samples were weighed (W) and soaked in distilled water for about 3–4 hours under normal light at room temperature. The turgid leaf samples were dried on a paper towel and weighed to determine their full turgid weight (TW). Afterwards, the leaf samples were placed in brown paper bags to oven dry at 80℃ for about 24 hours. Dried leaf samples were cooled down and their dry weight (DW) was determined. Finally, the RWC was calculated using the following formula:
RWC (%) = [(W − DW) / (TW − DW)] × 100
2.6 Morphological Analysis
The transgenic wheat lines were assessed for their morphological traits including plant height, number of spikes, number of seeds per spike, total grains per plant, and total weight per 100 seeds.
2.7 Statistical Analysis
The significance of difference was determined using one-way ANOVA in SPSS (version 17.0). The means of triplicates, for each analysis, were compared using Dunnett test, where the F ratios were considered significant for p values < 0.05.
3. RESULTS
3.1. Screening of Transgenic Plants with PCR and BASTA Assay
The total genomic DNA extracted from the transgenic as well as control wheat plants was run on 1% agarose gel at 85 V for 45 minutes (Figure 1-a). The confirmation of transgene TaDof1 in T2 generation of six transgenic wheat lines was done using gene-junction primers for PCR. The band size of 272 bp confirmed the presence of TaDof1 transgene in T2 transgenic wheat plants (Figure 1-b).
The expression of bar gene in transgenic plants was verified by BASTA leaf paint assay. Within five days of BASTA (0.005 %) application, traces of necrotic spots were observed on non-transgenic and control plants. The final results were collected after 2 weeks of BASTA application. The T2 transgenic wheat lines showed tolerance against the herbicide BASTA. In contrast, complete necrosis coupled with yellow coloration was observed in non-transgenic and wild-type plants. A score range was assigned to the samples from 1-4. A score of 1 indicated 0-25% green leaf color and, hence the plant was regarded as non-transgenic. On the contrary, a score range from 2-4 indicated different degrees of leaf green color. These plants were considered as transgenic (Figure 2).
3.2. Expression Analysis by Real Time PCR
3.2.1. Extraction of RNA and the Synthesis of cDNA. Total RNA was isolated from the leaves of 8-weeks-old transgenic (T2) and control wheat plants, half of which were grown under normal conditions and the other half were grown under stressful conditions (Figure 3-a). The isolated RNA was then used for cDNA synthesis. The quality of synthesized cDNA was assessed by amplifying an amplicon of 18s gene using 18sF and 18sR primers (Table 1). A sharp band having a product size of 380 bp confirmed the synthesis of cDNA from RNA (Figure 3-b). The synthesized cDNA was further used for the expression profiling of transgene TaDof1 in transgenics along with the genes regulated by it, by subjecting it to RT-PCR and qRT-PCR, respectively. Figure 3-c shows amplification of amplicon size 212 bp from transgenic plants using cDNA as template for TaDof1. RT-PCR for genes GS, NIR, PEPC, and PK was also performed (Supplementary Figure S3) using primers as mentioned in Table 1.
(a)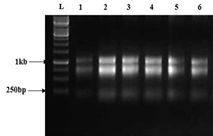
(b) 
(c)
3.2.2 Real Time PCR.
Gene expression of TaDof1, under nitrogen stress, increased to 1.16-folds in transgenic line F1 in comparison with Faisalabad control. For transgenic lines of Galaxy, around 0.68-7.61 folds increase in transgene expression was observed, with the maximum fold rise in line G2. In case of genes regulated by TaDof1, the expression was coordinatively activated in some lines. Overall, the expression profiles of genes modulated by transcription factor Dof1 were upregulated and ranged from 1.16-8.01 folds in F1 and 0.45-29.4 folds in Galaxy transgenics. G1 showed a consistent response in gene expression for GS, NIR and PK, while F1, G3, and G4 displayed significant upregulation of two genes (Figure 4).
(a)
(b)

(c)

(d)

(e)

Figure 4. Expression profiling of Transgene TaDof1 and Other Regulated Genes in T2 Transgenic Plants and Control Wheat Plants after Subjected to 4 Weeks of Nitrogen Limiting Conditions, where FSD=Faisalabad Control, F1=Faisalabad Transgenic Line, GAL=Galaxy Control, G1 to G5 = Galaxy Transgenic Lines. The Values of Relative Fold Increase are Shown as Mean ± SD of Three Independent Replicates, after Normalization with 18s Gene Expression. The Asterisks Represent Significant Differences between the Control and Transgenic Wheat Under Normal and Stress by Dunnett Test (p < 0.05)
3.3 Biochemical Analysis
3.3.1 Soluble Protein Content. An improvement was observed in the production of soluble proteins in all transgenic lines with respect to control wheat plants, when allowed to grow both under normal and nitrogen limiting conditions, except in the line G-5. The line G1 manifested the highest value (6.27 mg g-1 FW) under nitrogen stress. However, the enhancement of soluble protein was not significant for any line (Figure 5-a).
3.3.2 Soluble Sugar Content. An increase in the content of soluble sugars was observed in all transgenic lines in comparison with control plants grown under normal conditions. Under stressful conditions, the overall soluble sugar production ranged from 4.71–6.73 mg g-1 FW. The maximum increase in sugar production was observed in transgenic line G1 (6.73 mg g-1 FW) under limited nitrogen. Although the soluble sugars enhanced in Galaxy transgenic lines, yet the improvement was not significant with respect to wild-type plants under normal and nitrogen stressful conditions (Figure 5-b).
3.3.3 Chlorophyll Content. Under nitrogen stress, total chlorophyll content was significantly enhanced in F1 (15.09 mg g-1 FW) and Galaxy transgenics (17.66–22.02 mg g-1 FW) as compared to Faisalabad control (8.7 mg g-1 FW) and Galaxy control (6.69 mg g-1 FW), respectively. However, under normal conditions, only Galaxy transgenics portrayed significant difference (16.09–20.28 mg g-1 FW) with respect to Galaxy control (12.98 mg g-1 FW). The concentration of total chlorophyll improved significantly in T2 transgenic lines G1 and G2. For G5, the chlorophyll content reduced under stressful conditions with respect to its transgenic counterpart grown under normal conditions (Figure 5-c).
3.3.4 Phosphorous Content. The phosphorous content improved in all transgenic lines, except in G3. When subjected to normal Hoagland solution, F1 showed significant improvement in phosphorous content (36.6 µg/mg) as compared to Faisalabad control (31.79 µg/mg). In contrast, when F1 was grown under nitrogen stress, the improvement was not significant with respect to control plants. In case of Galaxy transgenic lines, the phosphorus content ranged from 7.2–49.94 µg/mg. There was a significant improvement in phosphorous content in all lines, except G2, in contrast with Galaxy control under normal and stressful conditions. The line G1 proved to exhibit maximum phosphorous content of 41.11 µg/mg and 49.94 µg/mg under normal and stressful conditions, respectively (Figure 5-d).
3.3.5 Relative Water Content. In both Faisalabad and Galaxy wild-type plants, the RWC decreased when they were subjected to stressful conditions. In contrast, an increasing trend was observed in all transgenic lines with respect to RWC under nitrogen stress, except for G3. For F1, there was a significant difference in RWC in contrast with Faisalabad control, under both normal and stress treatments. For instance, the RWC improved from 78.57% to 83.3% in F1 under normal conditions, respectively. While under stressful conditions, it improved from 75% to 92.08% in Faisalabad control and F1, respectively. This marked a significant improvement. For Galaxy transgenics, the overall RWC under stress ranged from 74.07% to 104.81%. G1 exhibited maximum rise of 104.81% RWC under stress as compared to 75.71% of Galaxy control (Figure 5-e).
(a)
(b)

(c)

(d)

(e)

Figure 5. Biochemical Analysis of Control and Transgenic Wheat Plants Grown under Normal Nitrogen and Nitrogen Deficient Conditions for 4 Weeks (a) Mean Soluble Proteins (mg g-1 FW); (b) Mean Soluble Sugar Concentration (mg g-1 FW); (c) Total Chlorophyll Content (mg g-1 FW); (d) Phosphorous Concentration (µg/mg FW); (e) Relative Water Content (%). FSD=Faisalabad Control, F1=Faisalabad Transgenic Line, GAL=Galaxy Control, G1 to G5=Galaxy Transgenic Lines. Values are Shown as Mean ± SD of Three Independent Replicates. Different Superscript Letters Denote that Significant Difference Exist when p < 0.05 (Dunnett Test).
3.4. Morphological Analysis
The transgenic plants grown in the field were evaluated on the basis of various agronomic traits. Overall, F1 showed better response for plant height (95.2 cm), number of spikes (14), spike length (11.61), and seed weight (4.5 g). All these aforementioned traits were significantly higher than Faisalabad control. In case of Galaxy transgenics, plant height improved significantly only in G4 (97.7 cm) with respect to Galaxy control (89.3 cm). However, a better response was observed for number of spikes and spike length in G1, G2, G4, and G5. G1 and G2 had 16 spikes. In case of spike length, both G1 and G2 exhibited a significant difference as compared to Galaxy control (10.1 cm) by having spike length of 10.45 cm and 10.95 cm, respectively. For total number of seeds per plant, G1, G2, and G4 had significantly higher number of seeds, while no significant difference was observed in case of seed weight in comparison with Galaxy control (Table 2).
4. DISCUSSION
There is an intimate link between nitrogen and carbon metabolism. The manipulation of carbon and nitrogen skeleton production proved to be an efficient strategy in order to improve nitrogen assimilation in plants [26]. Earlier studies show that the expression of Dof1 induced under nitrogen limiting conditions regulates enzymes involved in carbon and nitrogen metabolic pathways in various species, specifically rice, maize, and Arabidopsis [8], [27], [28]. When transgenic rice overexpressing ZmDof1 was subjected to low concentration of nitrogen, the carbon and nitrogen assimilation significantly improved [27]. The findings supported the conclusions drawn by Hasnain et al. [15]. The T2 generation of TaDof1 transgenic wheat lines overexpressed the transcription factor TaDof1 along with other regulated genes GS, NIR, PEPC, and PK when exposed to two different nitrogen treatments (Figure 4).
The enzyme pyruvate kinase (PK) plays an essential role to provide pyruvate to TCA cycle, cytosolic ATP biosynthesis, and carbohydrate breakdown [29]. The maximum fold rise of 29 folds was recorded in G1 for gene PK (Figure 4.12 e). This suggests its critical role in carbon and nitrogen metabolic pathway. In a similar investigation carried out by Yu et al. [28], relatively higher expression of PK was observed in transgenic Arabidopsis and wheat lines overexpressing Dof1 in contrast with wild-type plants under stress. The line G1 also exhibited the highest value for soluble sugars (Figure 5-b), signifying the correlation between PK and sugar content in plants as suggested by Wulfert et al. [29].
Dof1 transgenic rice was developed and grown under nitrogen-deficient conditions. qRT-PCR expression analysis of Dof1 gene and PEPC gene from ZmDof1 transgenic plants showed that the number of PEPC transcripts increased due to overexpression of Dof1 [27]. Some other transgenic plants have also been reported to be transformed with Dof1 and their association with PEPC gene upregulation has also been confirmed [8], [28]. Such findings depict that the PEPC gene can be further utilized as a potent molecular marker for better characterization of Dof1 in transgenic crop plants. In the current study, T2 plants did not exhibit significant increase in PEPC expression under stress (Figure 4-d). PEPC gene is associated with the anaplerotic pathway of tricarboxylic acid (TCA) cycle, which results in an enhanced flow of carbon for improved nitrogen assimilation, hence promotes amino acid biosynthesis in transgenic tomatoes [30]. Since there was no significant increase in PEPC expression in the current study, the increased protein synthesis was not significant with respect to wild-type plants under stress (Figure 5-a).
Glutamine synthetase (GS) is a key assimilatory enzyme for ammonia, which catalyzes the synthesis of glutamine from ammonia and glutamate [31]. One predominant role of GS is to convert the inorganic nitrogen (NO3‒ and NH4+) into glutamine, which is further converted to glutamate with the help of enzyme glutamine-oxoglutarate aminotransferase (GOGAT). The amino acids produced at the end of reaction are used as precursors for the synthesis of certain organic compounds derived from nitrogen. The main compounds include chlorophyll nucleotides and various other amino acids [32]. In this research, F1 and G1 transgenic lines overexpressed GS under stress (Figure 4-b) as compared to wild-type plants. Moreover, the protein content was also enhanced in F1 and G1 (Figure 5-a), while total chlorophyll content improved significantly in G1 only (Figure 5-c). This showed a correlation between enhanced GS expression and better biochemical traits, specifically protein and chlorophyll content.
The enzyme nitrite reductase (NIR) converts nitrite (NO2-) ions to ammonium (NH4+) ions in the chloroplast of roots cells. Rice overexpressed with OsMYB305 enhances the uptake of nitrogen under nitrogen-limiting conditions. The expression of NIR increased in the roots of transgenic lines and resulted in the accumulation of higher amino acids, as well as the enhancement of shoot dry mass and seed yield [32]. In the current study, overexpression of TaDof1 in T2 generation upregulated NIR expression in F1, G1, G4, and G5 (Figure 4-c). Although, there was an improvement in protein content (Figure 5-a) and yield in terms of total number of seeds and seed weight (Table 2), yet the enhancement was not that significant with respect to wild-type plants.
The transcription factor Dof1 is also reported to work in conjunction with other transcription factors, such as NIGT1, to regulate nitrate transporter genes. These transporters, such as NRT2.1, NRT2.4, and NRT2.5, are essential for efficient nitrate uptake in nitrogen-deficient conditions. DOF1 enhances the expression of these transporters by modulating repressor proteins, such as NIGT1 [10]. Future studies can focus on transcriptome analysis of such genes regulated by Dof1 for the better evaluation of TaDof1 transformed transgenic lines.
Deploying Dof1 transgenic wheat holds great promise to enhance NUE and reduce fertilizer reliance which benefits both the environment and soil health. While regulatory and biodiversity concerns exist, addressing these through effective management and field trials would pave the way for successful commercialization. The growing demand for sustainable agriculture offers strong economic potential for this innovative solution [10].
4.1 Conclusion
The results concluded better metabolic and morphological traits in all T2 transgenic lines. G1 line appeared to be the best line in terms of its expression profile and biochemical traits. Hence, the transformation of wheat with transcription factor TaDof1 seems to be a promising strategy in order to enhance NUE of crop plants, as the results support stable inheritance of transgene expression across generations.
CONFLICT OF INTEREST
The author of the manuscript has no financial or non-financial conflict of interest in the subject matter or materials discussed in this manuscript.
DATA AVAILABILITY STATEMENT
The data associated with this study will be provided by the corresponding author upon request.
FUNDING DETAILS
The current study was supported by Forman Christian College University (FCCU). Earlier, the project was funded by Agricultural Linkages Program (ALP) under Pakistan Agricultural Research Council (PARC), Pakistan
REFERENCES
- Borgström P, Bommarco R, Viketoft M, Strengbom J. Below-ground herbivory mitigates biomass loss from above-ground herbivory of nitrogen fertilized plants. Sci Rep. 2020;10:e12752. https://doi.org/10.1038/s41598-020-69696-3
- Ladha JK, Peoples MB, Reddy PM, et al. Biological nitrogen fixation and prospects for ecological intensification in cereal-based cropping systems. Field Crops Res. 2022;283:e108541. https://doi.org/10.1016/j.fcr.2022.108541
- Randive K, Raut T, Jawadand S. An overview of the global fertilizer trends and India’s position in 2020. Miner Econ. 2021;34:371–384. https://doi.org/10.1007/s13563-020-00246-z
- Sapkota TB, Bijay-Singh, Takele R. Chapter Five - Improving nitrogen use efficiency and reducing nitrogen surplus through best fertilizer nitrogen management in cereal production: The case of India and China. Adv Agron. 2023;178:233–294. https://doi.org/10.1016/bs.agron.2022.11.006
- Sardar MF, Younas F, Farooqi ZU, Li Y. Soil nitrogen dynamics in natural forest ecosystem: a review. Front Fores Global Change. 2023;6:e1144930. https://doi.org/10.1038/s41467-024-50803-1
- Anas M, Liao F, Verma KK, et al. Fate of nitrogen in agriculture and environment: agronomic, eco-physiological and molecular approaches to improve nitrogen use efficiency. Biol Res. 2020;53:e47. https://doi.org/10.1186/s40659-020-00312-4
- Zhang X, Zou T, Lassaletta L, et al. Quantification of global and national nitrogen budgets for crop production. Nat Food. 2021;2:529–540. https://doi.org/10.1038/s43016-021-00318-5
- Javed T, Indu I, Singhal RK, et al. Recent advances in agronomic and physio-molecular approaches for improving nitrogen use efficiency in crop plants. Front Plant Sci. 2022;13:e877544. https://doi.org/10.3389/fpls.2022.877544
- Charteris AF, Knowles TD, Mead A, Reay MK, Michaelides K, Evershed RP. The differential assimilation of nitrogen fertilizer compounds by soil microorganisms. FEMS Microbiol Lett. 2024;371:efnae041. https://doi.org/10.1093/femsle/fnae041
- Zhuo M, Sakuraba Y, Yanagisawa S. Dof1.7 and NIGT1 transcription factors mediate multilayered transcriptional regulation for different expression patterns of nitrate transporter2 genes under nitrogen deficiency stress. New Phytol. 2024;242(5):2132–2147. https://doi.org/10.1111/nph.19695
- Ruta V, Longo C, Lepri A, et al. The DOF transcription factors in seed and seedling development. Plants. 2020;9(2):e218. https://doi.org/10.3390/plants9020218
- Khalid A, Hameed A, Tahir MF. Wheat quality: a review on chemical composition, nutritional attributes, grain anatomy, types, classification, and function of seed storage proteins in bread making quality. Front Nut. 2023;10:e1053196. https://doi.org/10.3389/fnut.2023.1053196
- Davies RW, Jakeman PM. Separating the wheat from the chaff: Nutritional value of plant proteins and their potential contribution to human health. Nutrients. 2020;12(8):e2410. https://doi.org/10.3390/nu12082410
- Ghafoor I, Habib-Ur-Rahman M, Ali M, et al. Slow-release nitrogen fertilizers enhance growth, yield, NUE in wheat crop and reduce nitrogen losses under an arid environment. Environm Sci Pollut Res. 2021;28(32):43528–43543. https://doi.org/10.1007/s11356-021-13700
- Hasnain A, Irfan M, Bashir A, Maqbool A, Malik KA. Transcription factor TaDof1 improves nitrogen and carbon assimilation under low-nitrogen conditions in wheat. Plant Molecul Biol Rep. 2020;38(3):441–451. https://doi.org/10.1007/s11105-020-01208-z
- Hoagland DT. Water culture method for growing plants without soil. Circular. 1938;347:1–39.
- Murray MG, Thompson WF. Rapid isolation of high molecular weight plant DNA. Nucl Acids Res. 1980;8(19):4321–4326. https://doi.org/10.1093/nar/8.19.4321
- Mohsin S, Maqbool A, Ashraf M, Malik KA. Extracellular secretion of phytase from transgenic wheat roots allows utilization of phytate for enhanced phosphorus uptake. Molecul Biotechnol. 2017;59(8):334–342. https://doi.org/10.1007/s12033-017-0020-0
- Qiu R, Liu C, Wang Z, Yang Z, Jing Y. Effects of irrigation water salinity on evapotranspiration modified by leaching fractions in hot pepper plants. Sci Rep. 2017;7(1):e7231. https://doi.org/10.1038/s41598-017-07743-2
- Kistner C, Matamoros M. RNA isolation using phase extraction and LiCl precipitation. In: Márquez AJ, eds. Lotus Japonicus Handbook. Springer; 2005:123–124. https://doi.org/10.1007/1-4020-3735-x_9
- Bradford MM. A rapid and sensitive method for the quantitation of microgram quantities of protein utilizing the principle of protein-dye binding. Anal Biochem. 1976;72(1-2):248–254. https://doi.org/10.1016/0003-2697(76)90527-3
- Malik CP, Srivastava AK. Text Book of Plant Physiology. Kalyani; 1982.
- Arnon DI. Copper enzymes in isolated chloroplasts. Polyphenoloxidase in Beta Vulgaris. Plant Physiol. 1949;24(1):1–15. https://doi.org/10.1104/pp.24.1.1
- Campbell ER, Warsko K, Davidson AM, Campbell WH. Determination of phosphate in soil extracts in the field: a green chemistry enzymatic method. MethodsX. 2015;2:211–218. https://doi.org/10.1016/j.mex.2015.04.003
- Barrs H, Weatherley P. A re-examination of the relative turgidity technique for estimating water deficits in leaves. Aust J Biol Sci. 1962;15(3):e413. https://doi.org/10.1071/bi9620413
- Sun L, Di D, Li G, Li Y, Kronzucker HJ. Transcriptome analysis of rice (Oryza sativa L.) in response to ammonium resupply reveals the involvement of phytohormone signaling and the transcription factor OsJAZ9 in reprogramming of nitrogen uptake and metabolism. J Plant Physiol. 2020;246-247:e153137. https://doi.org/10.1016/j.jplph.2020.153137
- Neeraja CN, Barbadikar KM, Mangrauthia SK, Rao PR, Subrahmanayam D, Sundaram RM. Genes for NUE in rice: a way forward for molecular breeding and genome editing. Plant Physiol Rep. 2021;26(4):587–599. https://doi.org/10.1007/s40502-021-00632-x
- Yu Y, Song T, Wang Y, et al. The wheat WRKY transcription factor TaWRKY1-2D confers drought resistance in transgenic Arabidopsis and wheat (Triticum aestivum L.). Int J Biol Macromol. 2023;226:1203–1217. https://doi.org/10.1016/j.ijbiomac.2022.11.234
- Wulfert S, Schilasky S, Krueger S. Transcriptional and biochemical characterization of cytosolic pyruvate kinases in Arabidopsis thaliana. Plants. 2020;9(3):e353. https://doi.org/10.3390/plants9030353
- Domínguez-Figueroa J, Carrillo L, Renau-Morata B, et al. The Arabidopsis transcription factor CDF3 is involved in nitrogen responses and improves nitrogen use efficiency in Tomato. Front Plant Sci. 2020;11:e601558. https://doi.org/10.3389/fpls.2020.601558
- Wu D, Li Y, Cao Y, et al. Increased glutamine synthetase by overexpression of TaGS1 improves grain yield and nitrogen use efficiency in rice. Plant Physiol Biochem. 2021;169:259–268. https://doi.org/10.1016/j.plaphy.2021.11.021
- Wang D, Xu T, Yin Z, et al. Overexpression of OsMYB305 in rice enhances the nitrogen uptake under low-nitrogen condition. Front Plant Sci. 2020;11:e369. https://doi.org/10.3389/fpls.2020.00369