
| Review | Open Access |
|---|
Risk Factors and Prevalence of Contrast Sensitivity Impairment among Commercial Motor Vehicle Drivers in Benin City, Nigeria |

|
|---|
![]() John Esimaje Moyegbone1,2* ,
John Esimaje Moyegbone1,2* ,
![]() Eghonghon Ehianata Oronsaye3 ,
Eghonghon Ehianata Oronsaye3 ,
![]() Aghafekokhian Bose Osaiyuwu2 ,
Aghafekokhian Bose Osaiyuwu2 ,
![]() Patricia Tonbra Osunu4 ,
Patricia Tonbra Osunu4 ,
![]() Jennifer Aleye Ebeigbe2 ,
Jennifer Aleye Ebeigbe2 ,
![]() and Ezekiel Uba Nwose5
and Ezekiel Uba Nwose5
1Department of Public Health, Wellspring University, Edo State, Nigeria
2Department of Optometry, University of Benin, Edo State, Nigeria
3Department of Optometry, Bingham University, Nasarawa State, Nigeria
4Department of Public Health, Bayelsa Medical University, Yenagoa, Bayelsa State, Nigeria
5School of Health and Medical Sciences, University of Southern Queensland, Toowoomba, Australia
Background. Contrast sensitivity (CS) is the innate ability of the eyes to discern any variation in luminance or brightness between an object and its background within a given space. CS is important for recognizing lane markers, road signs, and oncoming traffic while driving, especially in low contrast environments, such as at night or during foggy weather. This survey aimed to evaluate the risk factors and prevalence of CS impairment among drivers of commercial motor vehicles in Benin City, Edo State, Nigeria.
Methods. This study employed an observational cross-sectional survey of 341 drivers of commercial motor vehicles aged 20-70 years (with the mean age of 48.09 years ± 11.21 years) in Benin City. The sample comprised 326 (96.6%) male drivers and 15 (4.4%) female drivers. The sample was selected using the purposive random sampling technique. The data was collected through the adjusted National Eye Institute Visual Functioning Questionnaire-25. Pelli-Robson test was performed to assess contrast sensitivity. Data was analysed using IBM-SPSS (version 29.0). Chi-square test was used to observe significant differences between CS and the associated risk factors.
Results. The prevalence of impaired CS in this study was 21.7%. It increased with the increase in age from 7.9% among the age group 20-30 years to 48.0% among the age group > 60 years. Higher educational level was found to correlate with decreased CS impairment.
Conclusion. The high prevalence of CS in this study could be a threat to safe driving, especially in low contrast environments, if appropriate measures are not put in place to identify drivers with CS impairment. Routine CS assessment of drivers is recommended preceding the issuance of driver’s license and relicensing.
Highlights
- CS impairment was found to be a major eye health burden among drivers of commercial vehicles in Benin City.
- The impairment was highest in age group > 60 years.
- Drivers with higher educational attainment had better contrast sensitivity than those with no formal education.
- There was found a significant link between CS and road traffic collisions in the past one year.
1. INTRODUCTION
Globally, over 1.2 million individuals pass away in traffic-related incidents each year [1]. Millions of other individuals suffer injuries of varying degrees, some of which result in lifelong disability [1-3]. There are serious social and economic repercussions when a large amount of human potential is wasted in road traffic accidents [4, 5].
Poor vision among drivers is a significant risk factor influencing motor vehicle crashes. Hence, road safety is a significant global public health concern [1, 6]. Having good eyesight is imperative for safe driving. It accomplishes approximately 95% of all sensory needs for vision processes[7, 8]. Safe and high-quality driving requires commercial drivers to have the best vision [9, 10], particularly in crowded cities [11].
Contrast sensitivity (CS) is known as the innate ability of human eyes to discern any variation in luminance, or brightness, between neighbouring items in a certain area or locations within a given space [12]. CS also measures the capacity to identify variations in object features at a distance and in low contrast environments, such as at night or in foggy weather [13]. The ability to see contrast is important in a variety of situations, including recognizing lane markers, road signs, and oncoming traffic.
Driving at night in conditions of mesopic or low photopic illumination, or when there is glare from oncoming headlights, can cause visual difficulties for drivers [14], increase the frequency of night-time motor vehicle crashes [15], increase the number of drivers who report experiencing glare from oncoming headlights [16], cause reduced adaptation times after glare experience [15], and impair drivers’ ability to recognize lane markers and road signs [17]. When it comes to predicting real-world visual danger, CS may be more sensitive and accurate than visual acuity [18]. The different traditional vision tests, including visual acuity, visual fields, or patient self-reports, are often not very good indicators of one’s ability to undertake night-time driving [19]. This is why CS, which quantifies low contrast visual acuity (VA), remains a reliable indicator of one’s capacity for night-time driving [15].
An Iranian study revealed that while the mean CS for commercial drivers was 2.00 log units, 4.5% of drivers over the age of 58 reported CS values equal to or less than 1.25 log units [20]. Moreover, according to research by van Rijn et al. [21], 6.5% of European drivers over 75 years had less than 1.25 log units Pelli-Robson CS.
A number of ocular conditions including glaucoma, cataract, optic neuritis, and amblyopia decrease CS [12, 22, 23]. Existing research demonstrates that CS naturally declines at a proportion of approximately 0.45 log CS/decade in healthy eyes between the ages of 50 and 80. These natural changes in CS have been linked to a reduced ability to identify hazards when driving at night [15]. Research conducted in Iran on commercial and military drivers revealed that drivers over the age of 58 experienced a significant decrease in CS than drivers of younger age groups [20]. Moreover, various researches further revealed that older driver populations have higher rates of VA and CS impairments [24-26].
While, VA is a simple and valuable tool to assess an individual’s visual state, it is not a sufficient measure of good eyesight on its own [26]. Many researchers have highlighted the significance of CS assessment to gauge the competency to drive, since a subject with impaired CS may, for instance, find it difficult to identify a dark-coated pedestrian at night, even if his or her visual acuity is excellent during the day [18, 25, 27, 28].
Based on the information about the condition of the eyes and the prevalence of ocular diseases among drivers worldwide, scholarly investigations have emphasized the necessity of regular and comprehensive visual screenings and examinations prior to the issuing and renewal of driving licenses [20, 24, 29].
Despite the unequivocal significance of CS in driving safely, there is paucity of evidence-based literature in Nigeria, particularly regarding the link between CS impairment and road traffic collisions among drivers. Hence, this study was undertaken to point out the risk factors and prevalence of CS impairment among drivers of commercial motor vehicles in Benin City, Edo State, Nigeria.
2. MATERIALS AND METHODS
2.1. Study Design and PopulationThis study was an observational cross-sectional survey of contrast sensitivity or CS among commercial motor vehicle drivers aged 20-70 years (with the mean age of 48.09 years ± 11.21 years) in Benin City, Nigeria. Data was collected through the use of a modified self-administered National Eye Institute Visual Functioning Questionnaire-25, as well as comprehensive eye examination and CS assessment of 341 drivers of commercial vehicles in Benin City environs.
2.2. Study AreaThis survey was executed in the central area of Benin City, Edo State, Nigeria. Edo state is an agricultural and oil producing state of Nigeria. It is situated in the geopolitical zone called south-south and is home to 3,602,124 people [30]. The state is separated into three senatorial districts namely Northern Edo, Southern Edo, and Central Edo, with a total of eighteen administrative Local Government Areas. Benin City is the government hub of Edo territory as well as the economic nerve of the state [31].
2.3. Sample Size DeterminationThe smallest sample required for this study was estimated using the formula for single proportion [32]
n = ,
where
n is the desired sample size (when population is >10,000),
Z is the normal curve’s abscissa, which divides a region α at the tails (1 - α equals the desired confidence level, e.g., 95%) which is 1.96,
e is the degree of accuracy which is 5% (0.05),
p is the estimation of the proportion of an attribute that is extant in the population, taken as 15% prevalence of commercial drivers with impaired CS in Rivers State, Nigeria [33],
q is 1-p, i.e (1-0.15)
n =
n =
n = 196
10% attrition factor = 20
Minimum sample size = 216 Participants
2.4. Sampling Technique and Data CollectionThe purposive random sampling technique was used to select a total of total of 341 commercial drivers. The survey was performed in Central Motor Park, Benin City, where majority of drivers enrooting the Benin City Metropolis load and disembark passengers. Data on demographics were gathered. Each participant completed an adjusted National Eye Institute Visual Functioning Questionnaire-25 [34], which asked about their age, sex, educational background, number of years of driving, amount of hours driven daily, visual complaints, and self-assessed road traffic collisions.
Presenting visual acuity or VA was evaluated using the Snellen’s chart, placed six meters (20 feet) away in a daylight open area by a licensed optometrist [35]. Presenting VA ≥ 6/12 in the best seeing eye was considered normal [36-38].
CS was assessed using Pelli-Robson CS test. Pelli-Robson CS is a white chart measuring 59 x 84 cm and uses black Sloan letters arranged in 16 groups of three letters [39]. It was used binocularly one meter away from the respondents. The resultant value obtained was expressed in logarithmic CS [40]. The Pelli-Robson chart ranges in contrast, from 0.00 log units (100%) to 2.25 log units (0.56%), and every triplet reduced by 0.15 log units [41]. Each letter was scored as 0.05 log units [25]. The Pelli-Robson CS scores ≥ 1.95 log units were considered normal for individuals with ages between 20 and 50 years. While, scores ≥ 1.80 log units were considered normal for individuals more than 50 years of age [42].
2.5. Method of Data AnalysisData were analysed using IBM SPSS (version 29.0). Chi square test was used to observe significant differences linking CS and associated risk factors together.
3. RESULTS
CS test was conducted on a total of 341 drivers of commercial motor vehicles routing within the Benin City metropolis. The results revealed that more than half of the respondents were of Edo ethnicity, followed by Deltans (13.8%). The vast majority (95.6%) of the study population were males. The age groups 41-50 years and 51-60 years, with a prevalence of 45.5% and 24.0% respectively, comprised the largest segments of the study population. Moreover, most of the respondents were educated with 39.9% and 37.5% having secondary and tertiary education, respectively. Over two-thirds of the respondents were self-employed and over half of them had a driving experience of more than 10 years. Furthermore, over two-thirds of the respondents reported driving above 5 hours per day and experienced no road traffic collisions during the last one year. Meanwhile, 21.7% reported 1-2 road traffic collisions during the last one year (Table 1).
Figure 1 shows that the single largest group (41.1%) of respondents had a CS score of 1.95 log units and 27% of the respondents had a CS score of 2.25 log units. The mean (50th percentile) CS score was 1.9135 log units ± 0.40168 SD and the 75th percentile was 2.25 log units.
The results of this survey showed that over two-thirds of the respondents had a normal CS score, while the CS score of 21.7% of respondents showed that they were impaired (Figure 2).
Table 1. Sociodemographic Characteristics of the Respondents
|
Variables |
Options |
Frequency (N= 341) |
Percentage |
|---|---|---|---|
|
Ethnic groups |
Edos |
202 |
59.2 |
|
Igbos |
33 |
9.7 |
|
|
Deltans |
47 |
13.8 |
|
|
Yorubas |
8 |
2.3 |
|
|
Others |
51 |
15.0 |
|
|
Sex |
Male |
326 |
95.6 |
|
Female |
15 |
4.4 |
|
|
Age Groups |
20-30 years |
13 |
3.8 |
|
31-40 years |
41 |
12.0 |
|
|
41-50 years |
155 |
45.5 |
|
|
51-60 years |
82 |
24.0 |
|
|
> 60 years |
50 |
14.7 |
|
|
Educational Status |
None |
24 |
7.0 |
|
Primary |
53 |
15.5 |
|
|
Secondary |
136 |
39.9 |
|
|
Tertiary |
128 |
37.5 |
|
|
Employment Status |
Self-employed |
260 |
76.2 |
|
Company employed |
81 |
23.8 |
|
|
Years of driving Experience |
< 3 years |
20 |
5.9 |
|
3-5 years |
33 |
9.7 |
|
|
6-10 years |
91 |
26.7 |
|
|
> 10 years |
197 |
57.8 |
|
|
Validity of driver’s license |
Currently valid |
246 |
72.1 |
|
Invalid |
95 |
27.9 |
|
|
Hours driven per day |
< 3 hrs |
29 |
8.5 |
|
3-5 hrs |
60 |
17.6 |
|
|
> 5 hrs |
252 |
73.9 |
|
|
Number of road traffic accidents during the last one year |
None |
252 |
73.9 |
|
1-2x |
74 |
21.7 |
|
|
3-4x |
11 |
3.2 |
|
|
> 4x |
4 |
1.2 |
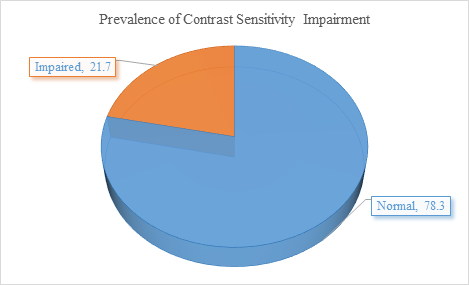
Figure 1. CS Scores of Commercial Drivers in Benin City
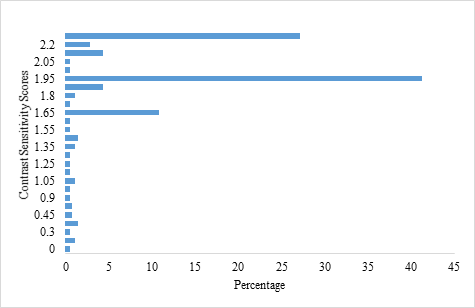
Figure 2. Categories of CS Scores among Commercial Drivers in Benin City.
Table 2 shows the results of eye health risk factors linked with CS. The findings show that Deltan (46.8%) and Igbo (27.3%) ethnicities had the highest prevalence of CS impairment. The link between CS and ethnicity was statistically significant (p < 0.01). Although, the connection between CS and gender was not statistically significant (p > 0.05), CS impairment was higher in males (22.1%) than in females (13.3%). CS impairment increased with the increase in age from 7.9% among age group 20-30 years to 48.0% among age group > 60 years. The connection between CS and age groups was found to be statistically significant (p < 0.01).
Similarly, CS impairment decreased with higher levels of education, from 41.7% among respondents with no formal education to 18.8% among respondents with tertiary education. CS and educational status were significantly connected (p < 0.01). Furthermore, this survey demonstrated that there was no signification relationship of CS with employment status, years of driving experience, and hours driven per day (p > 0.05). The respondents’s self-reports of 1-2 (41.9%) and 3-4 (37.5%) traffic accidents during the past one year showed that the link between CS and the number of road traffic collisions in the past one year was statistically significant (p < 0.01).
Table 2. Demographic and Driving-related Factors Associated with Contrast Sensitivity among Respondents
|
Variables |
Options |
Normal(%) |
Impaired(%) |
p |
c2 |
|---|---|---|---|---|---|
|
Ethnic groups |
Edos |
166 (82.2) |
36 (17.8) |
<.001 |
23.191 |
|
Igbos |
24 (72.7) |
9 (27.3) |
|||
|
Deltans |
25 (53.2) |
22 (46.8) |
|||
|
Yorubas |
7 (87.5) |
1(12.5) |
|||
|
Others |
45 (88.2) |
6 (11.8) |
|||
|
Gender |
Male |
254 (77.9) |
72 (22.1) |
.538 |
.647 |
|
Female |
13 (86.7) |
2 (13.3) |
|||
|
Age Groups |
20-30 years |
12 (92.3) |
1(7.9) |
<.001 |
24.826 |
|
31-40 years |
35 (85.4) |
6 (14.6) |
|||
|
41-50 years |
127 (81.9) |
28 (18.1) |
|||
|
51-60 years |
67 (81.7) |
15 (18.3) |
|||
|
> 60 years |
26 (52.0) |
24 (48.0) |
|||
|
Educational Status |
None |
14 (58.3) |
10 (41.7) |
.001 |
15.666 |
|
Primary |
34 (64.2) |
19 (35.8) |
|||
|
Secondary |
115 (84.6) |
21 (15.4) |
|||
|
Tertiary |
104 (81.3) |
24 (18.7) |
|||
|
Employment Status |
Self-employed |
203 (78.1) |
57 (21.9) |
.879 |
.032 |
|
Company employed |
64 (79.0) |
17 (21.0) |
|||
|
Years of driving Experience |
< 3 years |
16 (80.0) |
4 (20.0) |
.279 |
3.895 |
|
3-5 years |
28 (84.8) |
5 (15.2) |
|||
|
6-10 years |
76 (83.5) |
15 (16.5) |
|||
|
> 10 years |
147 (74.6) |
50 (25.4) |
|||
|
Hours driven per day |
< 3 hrs |
23 (79.3) |
6 (20.7) |
.425 |
1.888 |
|
3-5 hrs |
43 (71.7) |
17 (28.3) |
|||
|
> 5 hrs |
201 (79.8) |
51 (20.2) |
|||
|
Number of road traffic accidents in the last one year |
None |
212 (84.1) |
40 (15.9) |
<.001 |
24.101 |
|
1-2x |
43 (58.1) |
31 (41.9) |
|||
|
3-4x |
8 (72.7) |
3 (27.3) |
|||
|
> 4x |
4 (100.0) |
0 (0) |
4. DISCUSSION
Contrast sensitivity or CS is the adeptness of the eyes to accurately differentiate a figure in space from its background in dim illumination, such as foggy weather or nightfall. It plays a significant role in swift discernment and execution of decisions during driving. Poor vision among drivers, being a significant risk factor influencing motor vehicle crashes, remains a global public health concern [1, 6].
The study found that a total of 78.3% of respondents had a normal CS score, while the CS score of 21.7% of the respondents was impaired. This percentage is higher than the 15% prevalence of CS among drivers surveyed from the Rivers State of Nigeria [33], 4.5% prevalence among drivers above 58 years of age in Iran [20], and 6.3% prevalence among European drivers who were 75 years of age and older [43].
This survey demonstrated a statistically significant link between CS and ethnicity, age groups, educational status, and the number of road traffic collisions in the past one year (p < 0.01). CS impairment increases with the increase in age, from 7.9% among age group 20-30 years to 48.0% among age group > 60 years. These results are in conformity with several previous studies which reported that older drivers had Pelli-Robson CS below 1.80 log units, and a reasonably higher risk of susceptibility to road crashes [44, 45]. CS, in the normal eye, gets worse after 50 years of age. Moreover, natural variations in CS are associated with poorer hazard detection while driving, especially at night [15].
Similarly, CS impairment decreased with a higher level of education, from 41.7% among respondents with no formal education to 18.8% among respondents with tertiary education. This is in agreement with the findings of other studies indicating that higher educational attainment is associated with better overall visual health outcomes. While, specific studies on the direct relationship between CS and educational status are limited, education is often considered a proxy for socioeconomic status (SES), which can influence access to healthcare and health-related behaviours [46, 47].
This study showed that the link between CS and the number of road traffic collisions in the past one year was statistically significant (p < 0.01). While, 41.9% of the respondents reported 1-2 road traffic accidents, 37.5% of them reported 3-4 road traffic collisions during the past one year. This was in consonance with the study conducted by Owsley et al. [44], which demonstrated that drivers with impaired CS were three times more likely to get into an accident. Similarly, other studies reported the proportion of road traffic collisions to range from 8.3% to 45.5% [3, 29, 48-50]. However, these studies did not find a connection between CS and road safety [51, 52].
In this study, despite no significant relationship found between CS and years of driving experience, as well as hours driven per day (p>0.05), the findings revealed that reduced CS is associated with increased crash risk and poorer driving performance, particularly in older drivers [53, 54]. CS is essential for detecting objects against their background, which is critical for safe driving, especially in low-light conditions, fog, or glare [55].
4.1. ConclusionThis survey demonstrated that CS impairment was a major eye health burden among commercial drivers in Benin City Metropolis. Moreover, it was distinctly linked with ethnicity, age groups, educational status, and the number of road traffic collisions in the past one year. CS impairment increased with the increase in age among the drivers. Meanwhile, the CS score of drivers was better among drivers with higher educational attainment. Regular comprehensive eye examinations and appropriate eye care services are recommended to assess the CS status of the drivers of commercial or public vehicles in order to reduce the burden of visual impairment.
Author Contribution
John Esimaje Moyegbone: conceptualization, formal analysis, investigation, project administration & writing- original draft. Eghonghon Ehianata Oronsaye: investigation, methodology, writing-review and editing. Aghafekokhian Bose Osaiyuwu: conceptualization, supervision, validation, writing-review and editing. Patricia Tonbra Osunu: investigation, methodology, writing-review and editing. Jennifer Aleye Ebeigbe: conceptualization, supervision, validation, writing-review and editing. Ezekiel Uba Nwose: methodology, resources, writing-review and editing.
Conflict of Interest
The author of the manuscript has no financial or non-financial conflict of interest regarding the subject matter or materials discussed in this manuscript.
Data Availability Statement
The data linked to this study will be provided by the corresponding author upon request.
Funding
The authors received no funding for this study.
Generative AI Disclosure Statement
The authors did not used any type of generative artificial intelligence software for this research.
Ethical Approval and Consents to Participate
Ethical approval for this study was obtained from Ethical Committee of the Faculty of Life Sciences, University of Benin, Benin City, Edo State, Nigeria with protocol Number FLS/REC/018. Informed consent was obtained from each participating driver. Participation in this study was entirely voluntary.
REFERENCES
- Peden M, Scurfield R, Sleet D, et al. World report on road traffic injury prevention. World Health Organization; 2004.
- Fanai S, Mohammadnezhad M. The perception of public transport drivers (PTDs) on preventing road traffic injury (RTIs) in Vanuatu: a qualitative study. Int J Qual Studies Health Well-being. 2022;17(1):e2047253. https://doi.org/10.1080/17482631.2022.2047253
- Ahmed M, Patnaik JL, Whitestone N, et al. Visual impairment and risk of self-reported road traffic crashes among bus drivers in Bangladesh. Asia-Pacific J Ophthalmol. 2022;11(1):72–78. https://doi.org/10. 1097/APO.0000000000000471
Findings revealed that a self-reported history of a motor vehicle crash was connected with near or distance visual impairment.
- Kumari N, Anand A. Retinitis pigmentosa-recent advances in treatment. EyeQuest. 2020;45(1):73–78.
- Mashige KP, van Staden DB. Prevalence of congenital colour vision deficiency among Black school children in Durban, South Africa. BMC Res Notes. 2019;12(1):e324. https://doi.org/10.1186/s13104-019-4374-1
- Dairo MD, Okechukwu-Nwankpa UP, Nwankpa R. Survey on visual acuity among intra-city commercial vehicle drivers in Ibadan, southwestern Nigeria. J Public Health Afr. 2019;10(1):e789. https://doi.org/10. 4081/jphia.2019.789
- Bener A, Ahmad M, El-Tawil M, Al Bakr S. Visual impairment and motor vehicle accidents. Middle East J Emerg Med. 2004;4(1):39–43.
- Adewole AO, Olufemi A, Saheed G. Health care seeking behaviour for visual dysfunction among motor vehicle drivers in Osun State, Southwest Nigeria. Pan Afr Med J. 2019;32(1):1–9.
- Kumar M, Mahaseth A, Parveen S, Rafeeq U, Chauhan L. Refractive errors among commercial drivers. Indian J Ophthalmol. 2022;70(6):2112-2116. https://doi.org/ 10.4103/2222-8888.358922
- Ovenseri-Ogomo G, Adofo M. Poor vision, refractive errors and barriers to treatment among commercial vehicle drivers in the Cape Coast municipality. Afr Health Sci. 2011;11(1):97–102. https://doi.org/10.4314/ahs.v11i1.65003
- Alvarez-Peregrina C, Martinez-Perez C, Villa-Collar C, Sánchez-Tena MÁ. Influence of vision on drivers: a pilot study. Int J Environ Res Public Health. 2021;18(22):e12116. https://www. mdpi.com/1660-4601/18/22/12116
- Kwon JM, Lee SJ. Factors affecting contrast sensitivity in intermittent exotropia. Korean J Ophthalmol. 2020;34(5):392–397. https://doi.org/ 10.3341/kjo.2020.0058
- Wang S, Sharma A, Dawson J, Rizzo M, Merickel J. Visual and cognitive impairments differentially affect speed limit compliance in older drivers. J Am Geriatr Soc. 2021;69(5):1300–1308. https://doi.org/10.1111/jgs.17008
- Wood JM. Nighttime driving: visual, lighting and visibility challenges. Ophthalmic Physiol Opt. 2020;40(2):187–201. https://doi.org/ 10.1111/opo.12659
- Jones PR, Ungewiss J, Eichinger P, Wörner M, Crabb DP, Schiefer U. Contrast sensitivity and night driving in older people: quantifying the relationship between visual acuity, contrast sensitivity, and hazard detection distance in a night-time driving simulator. Front Hum Neurosci. 2022;16:e914459. https:// doi.org/10.3389/fnhum.2022.914459
CS in this research was evaluated in a driving simulator with the use of Landolt CS, featured under a static or a dynamic driving situation, in the presence or absence of glare. Resulted revealed that the connection between CS and performance during driving was distinct. Furthermore, CS was seen to be reduced in the presence of glare.
- Kimlin JA, Black AA, Djaja N, Wood JM. Development and validation of a vision and night driving questionnaire. Ophthalmic Physiol Opt. 2016;36(4):465–476. https://doi.org/10.1111/opo.12307
- Owens DA, Wood JM, Owens JM. Effects of age and illumination on night driving: a road test. Hum Factors. 2007;49(6):1115–1131. https://doi.org/10.1518/001872007X249974
- Owsley C, McGwin G. Vision and driving. Vision Res. 2010;50(23):2348–2341. https://doi. org/10.1016/j.visres.2010.05.021
- Gruber N, Mosimann U, Müri R, Nef T. Vision and night driving abilities of elderly drivers. Traffic Injury Prev. 2013;14:477–485. https://doi.org/ 10.1080/15389588.2012.727510
- Ghasemi M, Hosein S, Yazdi H. Comparison of visual status of iranian military and commercial drivers. Iran Red Crescent Med J. 2015;17(4):e19751. https://doi.org/10. 5812/ircmj.17(4)2015.19751
- van Rijn L, Nischler C, Michael R, Heine C, Coeckelbergh T, Wilhelm H. Prevalence of impairment of visual function in European drivers. Acta Ophthalmol. 2011;89(2):124–131. https://doi.org/10.1111/j.1755-3768.2009.01640.x
- Chung S, Legge G. Comparing the shape of contrast sensitivity functions for normal and low vision. Invest Ophthalmol Visual Sci. 2016;57:198–207. https://doi.org/10.1167/iovs.15-18084
- Pang Y, Allen M, Robinson J, Frantz K. Contrast sensitivity of amblyopic eyes in children with myopic anisometropia. Clin Exp Optom. 2019;102:57–62. https://doi.org/10. 1111/cxo.12817
- Haliza A, Muziman Syah M, Norliza M. Visual problems of new Malaysian drivers. Malays Family Phys. 2010;5(2):95–98.
- Wood J, Owens D. Standard measures of visual acuity do not predict drivers’ recognition performance under day or night conditions. Optom Vis Sci. 2005;82:698–705. https://doi.org/10. 1097/01.opx.0000175562.27101.51
- Hashemi H, Khabazkhoob M, Jafarzadehpur E, Emamian M, Shariati M, Fotouhi A. Contrast sensitivity evaluation in a population-based study in Shahroud, Iran. Ophthalmology. 2012;119(3):541–546. https://doi.org /10.1016/j.ophtha.2011.08.030
- Wood J. Age and visual impairment decrease driving performance as measured on a closed-road circuit. Hum Fact. 2002;44(3):482–494. https://doi.org/10.1518/0018720024497664
- Johnson C, Wilkinson M. Vision and driving: the United States. J Neuroophthalmol. 2010;30(2):170–176. https://doi.org/10.1097/WNO. 0b013e3181df30d4
- Oladehinde M, Adeoye A, Adegbehingbe B, Al E. Visual functions of commercial drivers in relation to road accidents in Nigeria. Indian J Occup Environ Med. 2007;11:71–75. https://doi.org/10. 4103/0019-5278.34532
- National Population Commission. Population Distribution by Sex, State, LGA & Senatorial district. 2006. http://www.population.gov.ng/index.php/publication/140-popn-distri-by-sex-state-jgas-and-senatorial-distr-2006
- Onaiwu DN. Rural-Urban integration and spatial planning in Edo State, Nigeria. Ghana J Geograph. 2021;13(1):50-62. https://doi.org/10. 4314/gjg.v13i1.3
- Cochran WG. Sampling Techniques. John Wiley and Sons; 1963.
- Azuamah Y, Obeme-Ndukwe O, Esenwah E, et al. An assessment of the visual acuity and contrast sensitivity of commercial vehicle drivers in Rivers State, Nigeria. Int J Res. 2014;1(9):1269–1275.
- National Eye Institute. Visual functioning questionnaire - 25 (VFQ-25). 2000. https://www.nei.nih.gov/ learn-about-eye-health/outreach-resources/outreach-materials/visual-function-questionnaire-25
- Moyegbone JE, Nwose E, Kio F, et al. Prevalence and pattern of visual impairment among adult population in mangu local government area of Plateau State, Nigeria. Ophthalmol Res: Int J. 2023;18(2):18–29. https://doi.org/10.9734/or/2023/v18i2381
- World Health Organization. World report on vision: vision, eye conditions and vision impairment. World Health Organization; 2019.
- Flaxman SR, Bourne R, Resnikoff S, et al. Global causes of blindness and distance vision impairment 1990–2020: a systematic review and meta-analysis. Lancet Global Health. 2017;5(12):e1221–e1234. https://doi. org/10.1016/S2214-109X(17)30393-5
- Moyegbone J, Nwose E, Anowa E, Clarke A, Odoko J, Agege A. Prevalence of visual impairment among primary and secondary school children in Delta State, Nigeria. J Nigerian Optom Assoc. 2023;25(1):42–53. https://dx.doi.org /10.4314/jnoa.v25i1.7
- Almaliotis D, Almpanidou S, Chatzimbalis T. Correlation between color vision, visual acuity, contrast sensitivity and photostress recovery in the visually impaired: a cross-sectional study. Ann Med Surg. 2024;86:742–747. https://doi.org/10.1097/MS9. 0000000000001522
- Pelli DG, Robson JG, Wilkins AJ. The design of a new letter chart for measuring contrast sensitivity. Clinic Vision Sci. 1988;2(3):187–199.
- Kingsnorth A, Drew T, Grewal B, et al. Mobile app Aston contrast sensitivity test. Clinic Experiment Optom. 2016;99:350. https://doi.org/10.1111/ cxo.12362
- Elliott D. Clinical Procedures in Primary Eye Care. Elsevier; 2007.
- Kobal N, Hawlina M. Comparison of visual requirements and regulations for obtaining a driving license in different European countries and some open questions on their adequacy. Front Hum Neurosci. 2022;16:e927712. https://doi.org/10.3389/fnhum.2022.927712
- Owsley C, Stalvey B, Wells J, Sloane M, McGwin G. Visual risk factors for crash involvement in older drivers with cataract. Arch Ophthalmol. 2001;119:881–887. https://doi.org/10. 1001/archopht.119.6.881
- Marottoli RA, Richardson ED, Stowe JR, Miller E, Brass LM, Cooney LM. Development of a test battery to identify older drivers at risk for self-reported adverse driving events. J Am Geriatr Soc. 1998;46(5):562–568. https://doi.org/10.1111/j.1532-5415.1998.tb01071.x
- Adler N, Stewart J. Health disparities across the lifespan: meaning, methods, and mechanisms. Ann New York Acad Sci. 2010;1186(1):5–23. https://doi.org/10.1111/j.1749-6632.2009.05337.x
- Zhang X, Bullard KM, Cotch MF, et al. Association between depression and functional vision loss in persons 20 years of age or older in the United States, NHANES 2005–2008. JAMA Ophthalmol. 2014;132(10):1193–1200. https://doi.org/10.1001/ jamaophthalmol.2014.1337
- Ekpenyong B, Echendu D, Ekanem E. Visual health status and its relationship with road traffic accidents amongst Nigerian vehicle drivers. African Vision Eye Health. 2020;79(1):1–8.
- Odugbo OP, Wade PD, Velle LD, Kyari F. Prevalence of presbyopia, refractive errors and use of spectacles among commercial intercity vehicle drivers in Jos, Nigeria. J Med. 2012;6(1):37–41. https://doi.org/10. 4314/jjm.v6i1
- Pepple G, Adio A. Visual function of drivers and its relationship to road traffic accidents in Urban Africa. SpringerPlus. 2014;3:e47. https:// doi.org/10.1186/2193-1801-3-47
- Rubin GS, Ng ES, Bandeen-Roche K, Keyl P, Freeman E, West SK. A prospective, population-based study of the role of visual impairment in motor vehicle crashes among older drivers: the SEE Study. Invest Ophthalmol Visual Sci. 2007;48:1483–1491. https://doi.org/10.1167/iovs.06-0474
- Cross J, McGwin G, Rubin G, et al. Visual and medical risk factors for motor vehicle collision involvement among older drivers. Br J Ophthalmol. 2009;93(3):400–404. https://doi.org/ 10.1136/bjo.2008.144584
- Wood J, Anstey KJ, Kerr G, Lacherez P, Lord S. A multidomain approach for predicting older driver safety under in-traffic road conditions. J Am Geriatr Soc. 2009;57(5):936–944. https://doi.org/10.1111/j.1532-5415.2009.02241.x
- Ortiz-Peregrina S, Ortiz C, Casares-López M, Castro-Torres JJ, Del Barco LJ, Anera RG. impact of age-related vision changes on driving. Int J Environ Res Public Health. 2020;17(20):e7416. https://doi.org/10. 3390/ijerph17207416
- Owsley C. Aging and vision. Vision Res. 2011;51(13):1610–1622. https:// doi.org/10.1016/j.visres.2010.10.020
Here, visual function was compared between 200 drivers each of Iranian military and commercial trucks. It was shown that age was a significant risk factor to CS impairment.
Researchers investigated the status of functional vision among Nigerian drivers and their relationship with road traffic clashes using 3521 drivers recruited from 27 States and the Federal Capital Territory. They discovered that the proportion of drivers who underwent vision tests prior to issuance of a driver's license was very low, and drivers with impaired vision were two times more likely to be involved in a road traffic collision compared with those with healthy eyes.
Twenty-one younger drivers (aged 25–40) were assessed for visual acuity, contrast sensitivity, halos, and intraocular straylight and compared to 21 older drivers (aged 56–71). Their results demostrate that older participants had reduced CS, and were most affected by straylights.