
Phil Moorey1, Fariha Imtiaz2, Asra Shanzeh Shabbir2, Nayab Pervez3, and Dhiya Al-Jumeily4*
1Bournemouth University, United Kingdom
2School of Pharmacy, University of Management and Technology, Lahore, Pakistan
3Faculty of Pharmaceutical Sciences, University of Central of Punjab, Lahore, Pakistan
4School of Computer Science and Mathematics, Liverpool John Moores University, Liverpool, United Kingdom
*Corresponding Author: [email protected]
Counterfeit and illicit tobacco may contain potentially toxic organic impurities that result in adverse health effects for the consumer. Carcinogenic substances have been found in elevated concentrations in counterfeit tobacco. The current study explored swift and cost-effective methods, such as Fourier-transform infrared, Raman, and near-infrared spectroscopy to identify counterfeit tobacco products. Moreover, it also assessed the spectral quality based on range, number of peaks, maximum peak intensity, and signal-to-noise ratio. In spectral analysis, infrared exhibited superior quality over Raman and near-infrared with a higher signal-to-noise ratio. Near-infrared, although with a limited wavelength range, showed good quality. Raman, however, displayed poor spectral quality due to noise interference. Identification success varied with chemo-metric methods, with infrared correctly identifying four out of five counterfeit tobacco products and near-infrared identifying three out of five. Raman failed in identification, while infrared showed success with some mismatches using principal component analysis. Near-infrared and Raman successfully identified counterfeit tobacco, with near-infrared providing the most distinct separation. Quantification results varied across spectroscopy techniques and chemo-metric methods.
Keywords: carcinogenic, chemo-metric, counterfeit
The counterfeit tobacco products endanger both the general population and individual health. Tobacco products are used extensively with estimated one billion users worldwide and approximately ten million in the United Kingdom alone [1, 2]. According to Tobacco Manufacturers’ Association (2013), consumers spent an amount equated to £15.1 billion for tobacco products in 2012 from which tax revenue was approximately £12.3 billion. Consequently, the sale of illegal and counterfeit tobacco products might have a significant impact on the economy [3]. According to ICC Commercial Crime Services [4], this is a worldwide issue due to the devastating effects it has on economies worldwide. Nicotine, formaldehyde, and other carcinogenic chemicals, such as polycyclic aromatic hydrocarbons, and nitrosamines are responsible for tobacco's detrimental effects on health [5]. Cheah et al. discovered that some chemicals in cigarette smoke may change the expression of genes related to cell death and DNA damage, thereby causing Geno toxicity in lung alveolar epithelial cells [6]. Tobacco smoke contains poisonous chemical carbon monoxide which causes smokers to experience temporary low oxygen levels [7]. Nevertheless, exposure to these effects during pregnancy might cause birth defects or even death of mother [8]. Both short-term and long-term exposure to side-stream smoke may be harmful to passive smokers [9]. Resultantly, the range of health consequences linked to tobacco extends beyond current users [10].
The majority of illicit cigarette products originate from countries outside the European Union (EU). These products may be authentic, however, they are brought into the country illegally which has a significant impact on legal tobacco trade and income. Alternatively, the source is often not stated and uncontrolled counterfeit tobacco products may include a wide variety of harmful compounds [10]. Tobacco that is not authentic may include organic and elemental impurities which are harmful known as ‘carcinogens’ in the form of elemental pollutants, such as cadmium, lead, and thallium [11]. Contrarily, ammonium salts, caffeine, chlorogenic acid, formic acid, glucose, isopropanol, methanol, propylene glycol, quinic acid, and sucrose were principal organic pollutants discovered in counterfeit tobacco. Additionally, the nicotine content of counterfeit tobacco was higher than that of real tobacco products [12] and it is critical to identify the organic and elemental harmful components of fake tobacco. There has been little investigation into the organic components of counterfeit tobacco with most studies focusing on the detection of elemental components. Inductively coupled plasma-optical emission spectrometry and energy dispersive polarized X-ray fluorescence spectroscopy (ED-PXRF) are two most popular technologies used to identify counterfeit tobacco [13].
A significant portion of techniques used to identify counterfeit tobacco were intrusive and included measures, such as gas chromatography-flame ionization detection to measure nicotine [5], LED-induced fluorescence spectroscopy [14], liquid chromatography, and nuclear magnetic resonance (NMR) [12]. However, these methods need spending time and money and preparing samples with great care. On the other hand, attenuated total reflectance-Fourier transform infrared spectroscopy (ATR-FTIR) has the advantage to measure very small amounts of material (for instance, a few mg) in a relatively shorter amount of time. The determination of how well Fourier-transform infrared, Raman, and near-infrared spectroscopy work to detect fraudulent tobacco products was the driving force for the current research.
2.1. Materials
Reference standards in the current study were selected based on the constituents/impurities commonly present in authentic and counterfeit tobacco products. These substances including 4-(2-thiazolylazo) resorcinol, ammonium hydroxide, formic acid, glucose, isopropanol, nicotine, rutin, and sucrose were purchased from Sigma-Aldrich. Moreover, 15 authentic, five illicit, and five counterfeit tobacco products were obtained from local retailers and the Food Standard Agency (FSA), respectively (Table 1).
Table 1. Authentic, Illicit, and Counterfeit Cigarette Brands and Information
|
Product number |
Brand |
Source |
Label Claim (mg/cigarette) |
Cigarette Mass (mg) |
Concentration (% m/m) |
||||
|
Tar |
NIC |
CO |
Tar |
NIC |
CO |
||||
|
A1 |
Benson & Hedges Gold |
UK |
10 |
0.9 |
10 |
879 |
1.138 |
0.102 |
1.14 |
|
A2 |
Benson & Hedges Silver |
UK |
8 |
0.7 |
9 |
857.8 |
0.933 |
0.082 |
1.05 |
|
A3 |
JSP Silver |
UK |
7 |
0.6 |
8 |
810.1 |
0.864 |
0.074 |
0.99 |
|
A4 |
Marlboro |
UK |
10 |
0.8 |
10 |
905 |
1.105 |
0.088 |
1.10 |
|
A5 |
Marlboro Gold Original |
UK |
6 |
0.5 |
7 |
837.2 |
0.717 |
0.06 |
0.84 |
|
A6 |
Marlboro White Menthol |
UK |
6 |
0.5 |
7 |
842.5 |
0.712 |
0.059 |
0.83 |
|
A7 |
Mayfair King Size |
UK |
10 |
0.9 |
10 |
881 |
1.135 |
0.102 |
1.13 |
|
A8 |
Richmond King Size |
UK |
10 |
0.9 |
10 |
841.7 |
1.188 |
0.107 |
1.19 |
|
A9 |
Rothmans King Size |
UK |
10 |
0.9 |
10 |
884.4 |
1.131 |
0.102 |
1.13 |
|
A10 |
Silk Cut Purple |
UK |
5 |
0.5 |
5 |
925.5 |
0.54 |
0.054 |
0.54 |
|
A11 |
Golden Virginia Rolling Tobacco |
UK |
15 |
1.3 |
NA |
750 |
2 |
0.173 |
NA |
|
A12 |
Winston Red |
UK |
10 |
0.8 |
10 |
827.9 |
1.208 |
0.097 |
1.21 |
|
A13 |
Lambert & Butler Original |
UK |
10 |
0.9 |
10 |
836 |
1.196 |
0.108 |
1.19 |
|
A14 |
Superkings Black |
UK |
10 |
0.9 |
10 |
913.1 |
1.095 |
0.099 |
1.09 |
|
A15 |
Superkings Blue |
UK |
8 |
0.8 |
8 |
961.2 |
0.832 |
0.083 |
0.83 |
|
I1 |
Karelia Slims |
Greece |
NA |
- |
- |
849.8 |
NA |
NA |
NA |
|
I2 |
Marlboro |
GCC |
8 |
0.6 |
8 |
912 |
0.877 |
0.066 |
0.87 |
|
I3 |
Marlboro |
Ukraine |
NA |
0.7 |
9 |
966.3 |
NA |
0.072 |
0.93 |
|
I4 |
Marlboro Gold Original |
Poland |
7 |
0.5 |
9 |
802.9 |
0.872 |
0.062 |
1.12 |
|
C1 |
Golden Virginia Rolling Tobacco |
UK |
15 |
1.3 |
NA |
750 |
2 |
0.173 |
NA |
|
C2 |
Golden Virginia Rolling Tobacco |
Greece |
15 |
1.3 |
NA |
750 |
2 |
0.173 |
NA |
|
C3 |
Lambert & Butler |
UK |
10 |
0.9 |
10 |
||||
|
C4 |
Superkings |
UK |
10 |
0.9 |
10 |
891.6 |
1.122 |
0.101 |
1.12 |
|
C5 |
Superkings |
Greece |
10 |
0.9 |
10 |
774.9 |
1.29 |
0.116 |
1.29 |
NA = Not available, NIC = Nicotine, CO = Carbon monoxide
2.2. Method
Pure substances were used without treatment. Tobacco products underwent homogenization and their content was transferred into 4-mL glass vials, weighed with a Mettler Toledo balance. These products were then mixed with a Grant-bio PV-1 vortex mixer for spectral measurement using a few milligrams of the powdered sample.
2.3. Characterization of Samples
Samples were analyzed using the Bruker Mobile-IR Spectrometer, featuring an easy-to-clean single reflection pure diamond ATR crystal highly resistant to scratches. The spectral range was 500-6000 cm-1 with an optical resolution of 1 cm-1.
Samples were analyzed using a Rigaku FirstGuardTM Handheld Raman Analyzer with a 1064 nm excitation wavelength, 500mW laser power, and a TE-cooled InGaAs detector. Authentic and illicit tobacco samples were measured at 300mW laser power with a peak search threshold of 1000 for diverse matches and an average count of 8 for higher intensity results. Counterfeit samples were measured at 200mW laser power to prevent saturation with Benzonitrile as the background for Raman analysis [15].
Samples were analyzed using the JDSU MicroNIRTM 1700 Spectrometer equipped with a Linear Variable Filter (LVF) dispersing element and a 128-pixel uncooled InGaAs photodiode array. The wavelength range was 950-1650 nm, with a spectral bandwidth of approximately 1.25% of the center wavelength. The instrument's operational range of -20 to 40°C allowed measurements at extreme temperatures and Spectralon was used as a standard for 100% reflectance in NIR measurements.
Spectral pre-treatment involved noise reduction and signal enhancement using multiplicative scatter correction and Savitsky-Golay first derivatives (MSC-D1) on raw spectra for each method (FTIR, Raman, NIR). The processed MSCD1 spectra underwent analysis for classification/identification through correlation in wavenumber/wavelength space (CWS) and Principal Component Analysis (PCA) with a threshold r value of 0.95 for similarity assessment.
PLSR aimed to identify latent X-variables for optimal prediction of Y-variables, where X-variables represented spectral data points of tobacco samples and Y-variables were nicotine or carbon monoxide concentrations (% m/m). MLR sought a mathematical link between X and Y using multiple predictor values based on MSCD1 spectral peaks. Five main peaks across the spectral range were chosen as X-variables. Models, created using authentic tobacco samples for calibration and validation, were developed for nicotine or carbon monoxide concentration (% m/m).
3.1. Spectral Quality
The current study aimed to explore the viability of identifying counterfeit tobacco products through NIR, Raman, and FTIR spectroscopy. While, spectroscopic methods present a quick, portable, and non-destructive alternative [16-19].
3.1.1. Moile-IR Substances were evaluated based on range, number of peaks, maximum peak intensity, and signal-to-noise ratio (S/N). The absorption range for all substances remained within 500-4000 cm-1. Resorcinol displayed the highest intensity peak at 0.716, while lactose exhibited the lowest at 0.229 au. Formic acid had the highest S/N at 1086 and sucrose had the lowest at 4.47. Isopropanol showed a relatively higher S/N ratio of 412. Rutin, with 20 peaks, had a significantly higher S/N ratio (31) as compared to glucose (4.6) which had 19 peaks. Despite a substantial number of peaks, sucrose displayed the lowest S/N ratio and the second-lowest maximum peak intensity (Figure 1-3).
On the other hand, the spectral quality of tobacco was poor showing fewer peaks, low peak intensity, and low S/N ratios. The highest ratios recorded were 7.94, 6.13, and 5.23 for authentic, illicit, and counterfeit tobacco samples, respectively.
MSC-D1 Spectra showed an increased number of peaks as compared to the raw spectra, however, also had more noise (Figure 3).
Counterfeit samples exhibited lower-intensity peaks, higher offset, noise, and less defined peaks as compared to genuine tobacco, likely due to fewer IR-active ingredients or more IR-inert chemicals. Both genuine and fake tobacco products displayed peaks at approximately 3300 cm-1 and 2900 cm-1, indicative of O-H and CH2 functional groups (Li et al. 2014). In MSC-D1 spectra, peaks in the functional group area (1500 – 4000 cm-1) showed reduced intensity and clarity, likely due to an enhanced definition in the fingerprint area.
Figure 1. Raw FTIR Spectra of Pure Substances (a) Ammonium Hydroxide, (b) Caffeine, (c) Formic Acid, (d) Glucose, (e) Isopropanol, (f) Lactose, (g) Nicotine, (h) Resorcinol, (i) Rutin, (j) Sucrose. Measurements were Performed using the Mobile-IR FTIR Spectrometer.

Figure 2. Raw FTIR Spectra of Authentic and Counterfeit Tobacco Samples (a) Authentic Benson & Hedges Gold (b) Golden Virginia Rolling Tobacco (British)
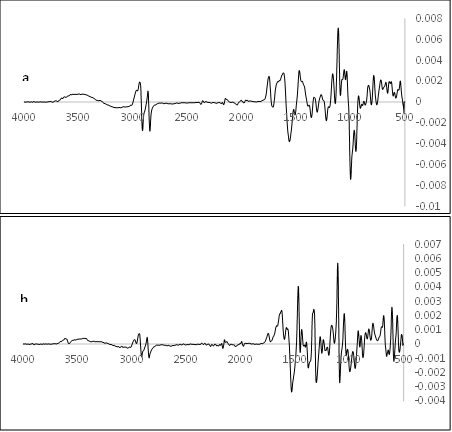
Figure 3. MSC-D1 FTIR Spectra of (a) Authentic Benson and Hedges Gold (A1), (b) Counterfeit Golden Virginia Rolling Tobacco (British) (C1)
3.1.2. Raman. In analysis, all the six substances exhibited scattering in the 650–2000 cm-1 range, with varying peak intensities (314 to 13143 arbitrary units). Rutin had the highest S/N ratio (523), whereas ammonium hydroxide had the lowest (2.47) due to prominent noise. Nicotine and caffeine displayed strong Raman scattering with 10 and 17 peaks and high S/N ratios (160 and 92). Formic acid and resorcinol, both with five peaks, showed contrasting S/N ratios (137 for formic acid, 6.04 for resorcinol). Tobacco spectral evaluation revealed poor results, with 3–5 Raman peaks, diminished intensities, and increased noise levels, hindering the signal (Figure 4-6).
Spectral quality varied based on Raman activity, with active substances, such as caffeine, formic acid, and rutin showing better quality. While, Raman-inactive substances exhibited poorer quality with fewer peaks and increased noise. Despite MSC-D1 pre-treatment improving peak definition, it also increased noise, not significantly enhancing the spectral quality of tobacco samples due to inherent high noise in their raw spectra [20].
3.1.3 Near-Infrared. The raw NIR spectra of 8 pure substances was displayed between 1 and 4 peaks along with absorbance range confined within 900–1700 nm. The maximum intensity values ranged from 0.327 au (resorcinol) to 22169 au (lactose). Lactose, glucose and sucrose had higher maximum intensities (22169, 16598, and 14158 au, respectively) as compared to other substances. Despite its high maximum peak intensity, glucose had the lowest S/N ratio at 2.14, whereas the S/N ratio spanned from 2.14 (glucose) to 2842 (rutin). The absorbance range of these raw NIR spectra was narrower matched to conventional NIR instruments (laboratory and handheld) (Figure 7-11).

Figure 4. Raw Spectra of Pure Substances (a) Ammonium Hydroxide, (b) Caffeine, (c) Formic Acid, (d) Nicotine, (e) Resorcinol, (f) Rutin. Measured using the Rigaku FirstGuardTM Handheld Raman Analyzer

Figure 5. Raw Raman Spectrum of Authentic Benson and Hedges Gold Tobacco (A1)
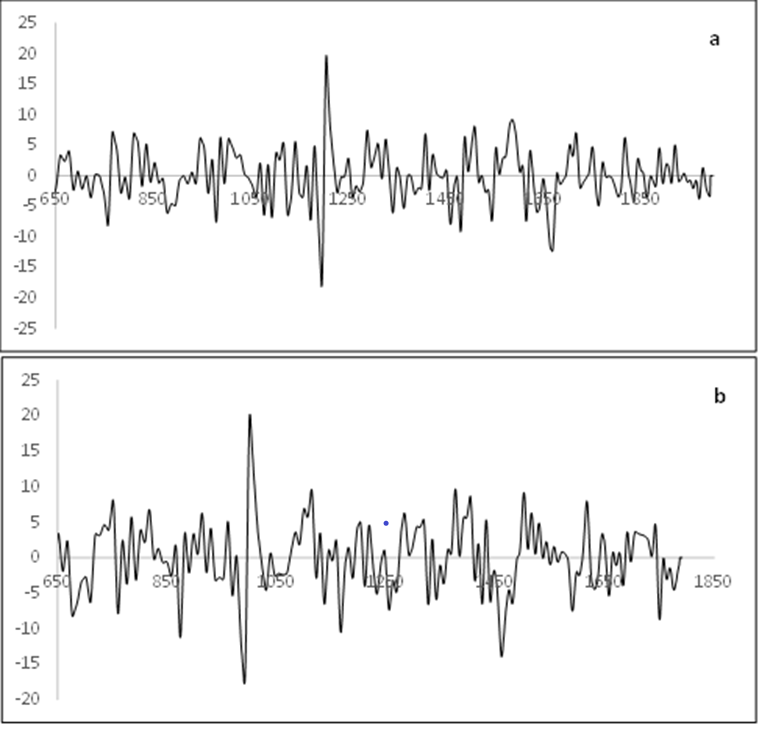
Figure 6. MSC-D1 Raman Spectra of (a) Authentic Benson and Hedges Gold (A1), (b) Counterfeit Golden Virginia Rolling Tobacco (C1)

Figure 7. Raw Spectra of Pure Substances (a) Ammonium Hydroxide, (b) Formic Acid, (c) Glucose, (d) Lactose, (e) Nicotine, (f) Resorcinol, (g) Rutin, (h) Sucrose. Measurements were Performed using the JDSU MicroNIRTM 1700 Spectrometer.

Figure 8. MSC-D1 NIR Spectra of Glucose
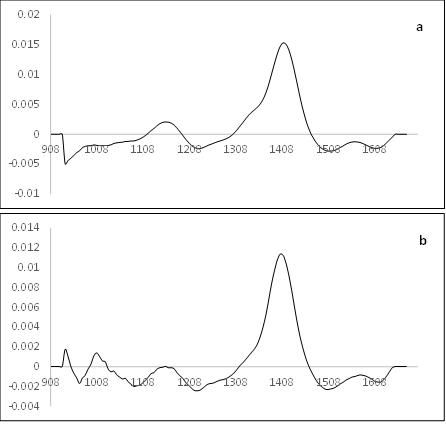
Figure 9. MSC-D1 NIR Spectra of (a) Authentic Benson and Hedges Gold (A1), (b) Counterfeit Golden Virginia Rolling Tobacco (British) (C1) Conventional NIR Instruments (laboratory and handheld).

Figure 10. MSC-D1 NIR Spectra of Glucose

Figure 11. MSC-D1 NIR Spectra of (a) Authentic Benson and Hedges Gold (A1), (b) Counterfeit Golden Virginia Rolling Tobacco (British) (C1)
Comparing spectral quality with NIR is quite challenging due to the instrument's limited wavelength range and complex nature of raw NIR spectra, composed of molecular vibrations. Counterfeit tobacco showed more significant effects on baseline shifts and spectral slopes, attributed to factors, such as instrument stability, temperature, humidity, and particle size differences. Applying MSC-D1 reduced or eliminated these unwanted features, although an increase in peak number and noise persisted in the spectra of counterfeit tobacco [21]. Secondly, it is difficult to interpret raw NIR spectra as they are composed of combinations of molecular vibrations, resulting in a complex spectrum [22].
3.2 In-built Identification
3.2.1 Pure Substances. Table 2 and 3 show the in-built matches for pure substances measured using the Mobile-IR FTIR Spectrometer and Rigaku FirstGuardTM Handheld Raman Analyser. No matches were found when the spectra of tobacco samples were compared with the in-built libraries of Mobile-IR and Handheld Raman instruments. Because of this, no results were obtained and identification could not be achieved using this method.
Table 2. List of in-built Matches for the Raw Spectra of Pure Substances Measured using the Mobile-IR FTIR Spectrometer
|
Sample |
Match |
HQI |
|
Nicotine R1 |
3-(methylpyrollidine) Pyridine |
991 |
|
Nicotine R2 |
3-(methylpyrollidine) Pyridine |
990 |
|
Nicotine R3 |
3-(methylpyrollidine) Pyridine |
990 |
|
Nicotine R4 |
3-(methylpyrollidine) Pyridine |
990 |
|
Resorcinol R1 |
4-(2thiazolylazo) resorcinol |
952 |
|
Resorcinol R2 |
4-(2thiazolylazo) resorcinol |
950 |
|
Resorcinol R3 |
4-(2thiazolylazo) resorcinol |
951 |
|
Resorcinol R4 |
4-(2thiazolylazo) resorcinol |
950 |
|
Glucose R1 |
Glucose |
990 |
|
Glucose R2 |
Glucose |
986 |
|
Glucose R3 |
Glucose |
986 |
|
Glucose R4 |
Glucose |
975 |
|
Caffeine R1 |
Caffeine |
915 |
|
Caffeine R2 |
Caffeine |
988 |
|
Caffeine R3 |
Caffeine |
945 |
|
Caffeine R4 |
Caffeine |
995 |
|
Sucrose R1 |
Lipo - drop yellow |
985 |
|
Lipo - drop red |
980 |
|
|
Powdered sugar |
948 |
|
|
Sucrose R2 |
Store brand powdered sugar |
992 |
|
Tic-tac |
987 |
|
|
Vanilla sugar |
986 |
|
|
Sucrose R3 |
Lipo - drop yellow |
985 |
|
Lipo - drop red |
980 |
|
|
Powdered sugar |
948 |
|
|
Sucrose R4 |
Lipo - drop yellow |
986 |
|
Lipo - drop red |
981 |
|
|
|
L-tartaric acid |
956 |
|
Formic acid R1 |
Formic acid |
932 |
|
Methyl vinyl ether |
599 |
|
|
Methyl vinyl ether |
501 |
|
|
Formic acid R2 |
Formic acid |
673 |
|
Formic acid R3 |
Formic acid |
672 |
|
Formic acid R4 |
Formic acid |
902 |
|
Rutin R1 |
Rutin |
989 |
|
Rutin R2 |
Rutin |
986 |
|
Rutin R3 |
Rutin |
985 |
|
Rutin R4 |
Rutin |
985 |
|
Isopropanol R1 |
2-propanol |
979 |
|
DBV Leich + lauf |
978 |
|
|
Zonil FSA |
976 |
|
|
Isopropanol R2 |
Isopropanol |
997 |
|
Isopropanol R3 |
2-propanol |
997 |
|
DBV Leich + lauf |
874 |
|
|
Zonil FSA |
682 |
|
|
Isopropanol R4 |
2-propanol |
990 |
|
DBV Leich + lauf |
872 |
|
|
|
Zonil FSA |
681 |
HQI = Hit quality index, R = Sample replicate
Table 3. List of in-built Matches for the Raw Spectra of Pure Substances Measured using the Rigaku FirstGuardTM Handheld Raman Analyser
|
Sample |
Match |
HQI |
|
Nicotine R1 |
No match |
- |
|
Nicotine R2 |
No match |
- |
|
Nicotine R3 |
No match |
- |
|
Resorcinol R1 |
Resorcinol |
864 |
|
Resorcinol R2 |
Resorcinol |
881 |
|
Resorcinol R3 |
Resorcinol |
877 |
|
Glucose R1 |
Glucose |
912 |
|
Glucose R2 |
Glucose |
927 |
|
Glucose R3 |
Glucose |
896 |
|
Caffeine R1 |
Caffeine |
935 |
|
Caffeine R2 |
Caffeine |
929 |
|
Caffeine R3 |
Caffeine |
925 |
|
Sucrose R1 |
Sucrose |
908 |
|
Sucrose R2 |
Sucrose |
911 |
|
Sucrose R3 |
Sucrose |
896 |
|
Formic acid R1 |
Formic acid |
936 |
|
Formic acid R2 |
Formic acid |
933 |
|
Formic acid R3 |
Formic acid |
928 |
|
Rutin R1 |
Rutin |
818 |
|
Rutin R2 |
Rutin |
814 |
|
Rutin R3 |
Rutin |
805 |
HQI = Hit quality index, R = Sample replicate
3.3 Offline Identification
3.3.1. Correlation in Wavelength Space.

Figure 12. Correlation Maps of the MSC-D1 FTIR Spectra of (a) Pure Substances (1) Ammonium Hydroxide, (2) Caffeine, (3) Formic Acid, (4) Glucose, (5) Isopropanol, (6) Lactose, (7) Nicotine, (8) Resorcinol, (9) Rutin, (b) Pure Substances (1) Ammonium Hydroxide, (2) Caffeine, (3) Formic Acid, (4) Glucose, (5) Isopropanol, (6) Lactose, (7) Nicotine, (8) Resorcinol, (9) Rutin And, (10-24) Authentic Tobacco, (25 -28) Illicit and (29 – 33) Counterfeit Tobacco, (c) Pure Substances (1) Ammonium Hydroxide, (2) Caffeine, (3) Formic Acid, (4) Glucose, (5) Isopropanol, (6) Lactose, (7) Nicotine, (8) Resorcinol, (9) Rutin, (10-24) Authentic Tobacco, (25 -28) Illicit and (29 – 33) Counterfeit Tobacco. Green Colour is an r value > 0.95. Measured using the Bruker Mobile-IR Equipped with ATR Diamond. Correlation Coefficient Values are Displayed by a Graduated Colour Scale.

Figure 13. Correlation Maps of the MSC-D1 Raman Spectra of (a) Pure Substances. Substances (1) Ammonium Hydroxide, (2) Caffeine, (3) Formic Acid, (4) Nicotine, (5) Resorcinol, (6) Rutin, (b) Pure Substances (1) Ammonium Hydroxide, (2) Caffeine, (3) Formic Acid, (4) Nicotine, (5) Resorcinol, (6) Rutin, (7-21) Authentic, (22-27) Illicit and (28-32) Counterfeit Tobacco, (c) Pure Substances (1) Ammonium Hydroxide, (2) Caffeine, (3) Formic Acid, (4) Nicotine, (5) Resorcinol, (6) Rutin, (7-21) Authentic, (22-27) Illicit and (28-32) Counterfeit Tobacco - Green Colour is an r value of > 0.95. Measured using the RigakuTM Raman Analyser. Correlation coefficient Values are Displayed by a Graduated Colour Scale

Figure 14. Correlation Map of the MSC-D1 NIR Spectra of (a) Pure Substances (1) Ammonium Hydroxide, (2) Caffeine, (3) Formic Acid, (4) Glucose, (5) Lactose, (6) Nicotine, (7) Resorcinol, (8) Rutin, (9) Sucrose, (b) Pure Substances (1) Ammonium Hydroxide, (2) Caffeine, (3) Formic Acid, (4) Glucose, (5) Lactose, (6) Nicotine, (7) Resorcinol, (8) Rutin, (9) Sucrose, (10-24) Authentic, (25-29) Illicit and (30-34) Counterfeit Tobacco, (c) Pure Substances (1) Ammonium Hydroxide, (2) Caffeine, (3) Formic Acid, (4) Glucose, (5) Lactose, (6) Nicotine, (7) Resorcinol, (8) Rutin, (9) Sucrose, (10-24) Authentic, (25-29) Illicit and (30-34) Counterfeit Tobacco - Green Colour is an r value > 0.95. Measured using the Handheld MicroNIRTM 1700 Spectrometer. Correlation Coefficient Values are Displayed by a Graduated Colour Scale.
CWS assessed the spectral similarity by comparing the absorbance or scattering at each wavenumber using r values. A threshold of 0.95 indicated sufficient similarity, differentiating between counterfeit and authentic samples with coloured correlation maps used for evaluation [23].
Pure compounds including rutin, ammonium hydroxide, caffeine, formic acid, nicotine, and resorcinol were correlated using CWS, yielding a maximum r value of 0.3, indicating significant dissimilarity. CWS successfully recognized raw materials from Raman spectra and no mismatches occurred between tobacco samples and pure chemicals, revealing a lack of sensitivity at low concentrations similar to FTIR studies [24].
While comparing tobacco samples, CWS failed to categorize them due to r values consistently below the 0.95 cut-off for valid identification. Genuine tobacco comparisons yielded r values around 0.3, indicating notable variations in each tobacco's spectrum and maximum r values of 0.7 suggested discrimination between brands. However, the inability to distinguish between legitimate, illegal, and counterfeit tobacco was a significant drawback, possibly influenced by sample non-uniformity-induced noise in the spectra [23].
NIR spectra of pure compounds (ammonium hydroxide, caffeine, lactose, glucose, nicotine, resorcinol, rutin, and sucrose) were correlated, yielding r values from -0.4 to 0.9, highlighting notable differences (e.g., glucose and caffeine) and similarity (e.g., sucrose and rutin). While, glucose, lactose, and sucrose showed a minimum r value of 0.7, indicating similarity. Mismatches occurred while connecting pure chemicals and tobacco. Rutin demonstrated high NIR activity, possibly explaining its resemblance. Despite an error in nicotine detection, CWS achieved an 89% accuracy rate in separating tobacco from pure chemicals [25, 26].
Genuine tobacco brands showed matches (r values > 0.95) and were recognized as legitimate by CWS due to consistent physicochemical characteristics. Matches between legal and illegal tobacco brands indicated identical physicochemical characteristics. Comparing real and fake tobacco products yielded at least a 0.87 r-value, with 60% identified as counterfeit. However, CWS recognized some as identical substances, revealing partial effectiveness in counterfeit tobacco identification [27].
3.4. Principal Component Analysis
|
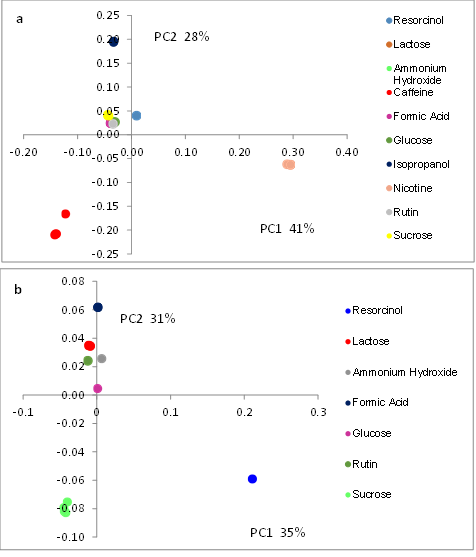
Figure 15. PCA Scores Plots of (a) All Pure Substances, (b) Pure Substances Minus Nicotine, Caffeine and Isopropanol. Measured using the Bruker Mobile-IR FTIR Spectrometer.

Figure 16. PCA Scores Plots for (a) Authentic/Illicit/Counterfeit Tobacco, (b) Authentic/Counterfeit Tobacco, (c) Authentic & Illicit Tobacco. Measured Using the Bruker Mobile-IR FTIR Spectrometer

Figure 17. PCA Scores Plot of Pure Substances Measured using the RigakuTM Handheld Raman Analyzer.

Figure 18. PCA Scores Plots of (a) Authentic, Illicit and Counterfeit Tobacco, (b) Authentic and Counterfeit Tobacco, (c) Authentic and Illicit Tobacco. Measured Using the Rigaku Handheld Raman Analyzer.

Figure 19. PCA Scores Plots of (a) All Pure Substances, (b) Pure Substances Minus Nicotine and Caffeine. Measured Using the Handheld MicroNIRTM 1700 Spectrometer.
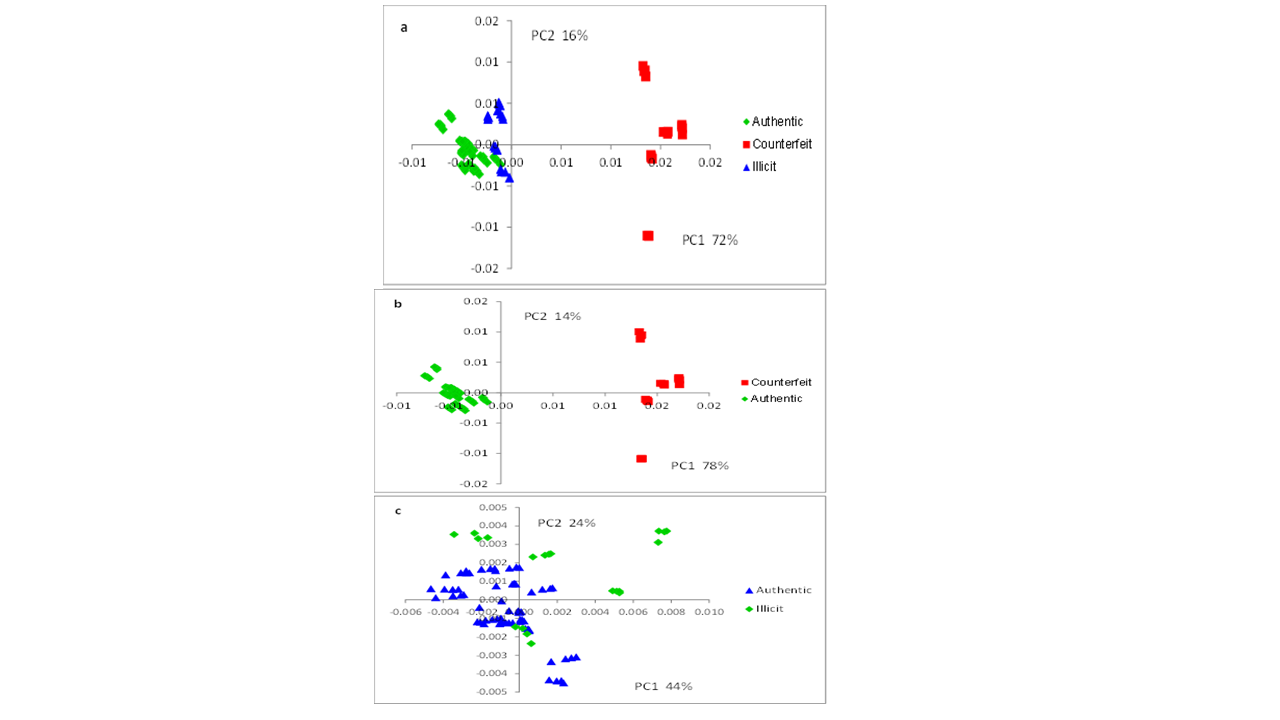
Figure 20. PCA Scores Plots of (a) Authentic, Illicit and Counterfeit Tobacco, (b) Authentic and Counterfeit Tobacco, (c) Authentic and Illicit Tobacco. Measured Using the Handheld MicroNIRTM 1700 Spectrometer.
PCA was employed for spectral similarity evaluation using principal components (PCs) instead of whole spectra, assessing the capacity to detect counterfeit tobacco by ideally grouping the genuine samples for authentication and distinctly separating fake brands.
Pure compounds (ammonium hydroxide, formic acid, glucose, isopropanol, lactose, nicotine, resorcinol, rutin, and sucrose) were initially plotted by PCA, explaining 69% of total variation through PCs 1 and 2. While, differentiation was observed for isopropanol, caffeine, and nicotine, overlapping occurred for other chemicals, rendering PCA unable to identify them accurately. After removing isopropanol, caffeine, and nicotine, PC1 and PC2 explained 66% of variation with improved differentiation, yet poor accuracy was noted in identifying raw components [28]. Plotting scores for real, illegal, and counterfeit tobacco revealed significant overlapping between real and illegal samples, with 56% of total variance explained by PC1 and PC2, indicating dispersed variation in their spectra. While, PCA identified fake tobacco to some extent, mistakes were noted, especially the difficulty of distinguishing fake from real samples.
PCA scores for pure compounds (ammonium hydroxide, caffeine, formic acid, nicotine, resorcinol, and rutin) showed clusters for replicas of specific compounds, accounting for 82% of total variation with PC1 and PC2. While some compounds overlapped, only 50% of raw materials could be identified. While comparing real, illegal, and counterfeit tobacco, PC1 and PC2 explained 22% of the total variation, showing overlapping between duplicates and suggesting that illegal tobacco was made with real substances. Excluding illegal tobacco revealed no overlapping between real and fake samples, allowing PCA to identify counterfeit tobacco despite outliers in real tobacco spectra [29].
PCA applied to pure chemicals (ammonium hydroxide, caffeine, formic acid, glucose, lactose, nicotine, resorcinol, rutin, and sucrose) identified caffeine and nicotine easily due to substantial variation on PC1 and PC2. PCA improved without nicotine or caffeine, providing clearer sample separation. Genuine, illegal, and counterfeit tobacco products were clearly classified based on PCA scores plot of their MSC-D1 NIR spectra, achieving 100% accuracy in identifying counterfeit tobacco [30, 31].
3.4.1 Quantification
3.4.1.1. Partial Least Squares Regression. PLSR models for CO and NIC in tobacco, with concentrations ranging from 0.06 to 0.11% m/m for NIC and 0.5 to 1.2% m/m for CO, showed comparable accuracy. NIC model (Model 3) exhibited low accuracy (r2 values of 0.42 and 0.77), good repeatability (RMSEC and RMSEP values of 0.013 and 0.021% m/m), however, a substantial error rate (RSEP = 23%). CO model (Model 4) had higher calibration accuracy (r2 = 0.99) but lacked repeatability (RMSEC and RMSEP values of 0.019 and 0.15% m/m) with a noteworthy exterior prediction error (RSEP = 14%) (Figure 21-26).

Figure 21. PLSR Scatter Plots of Nominal Versus Predicted Nicotine Concentrations for (a) Calibration, and (b) Validation Sets of Authentic Tobacco Samples Measured Using the Mobile-IR FTIR Spectrometer.
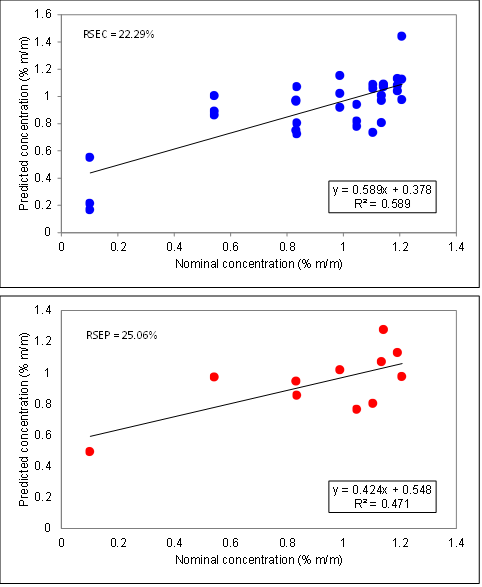
Figure 22. PLSR Scatter Plots of Nominal Versus Predicted Carbon Monoxide Concentrations for (a) Calibration, and (b) Validation Sets of Authentic Tobacco Samples Measured Using the Mobile-IR FTIR Spectrometer.

Figure 23. PLSR Scatter Plots of Nominal Versus Predicted Nicotine Concentrations for (a) Calibration, and (b) Validation Sets of Authentic Tobacco Samples Measured using the Handheld Raman Analyzer.
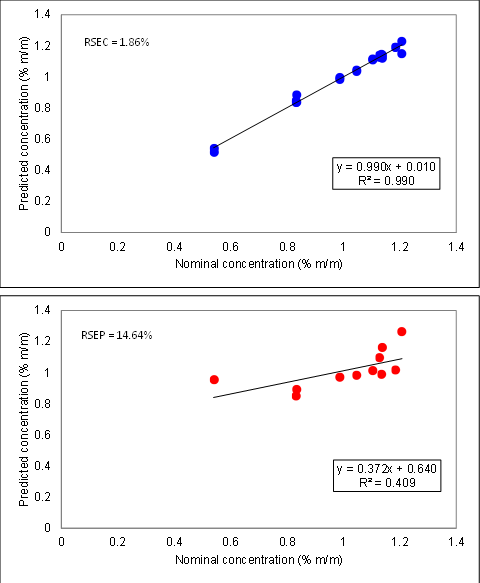
Figure 24. PLSR Scatter Plots of Nominal Versus Predicted Carbon Monoxide Concentrations for (a) Calibration, and (b) Validation Sets of Authentic Tobacco Samples Measured Using the Handheld Raman Analyzer.
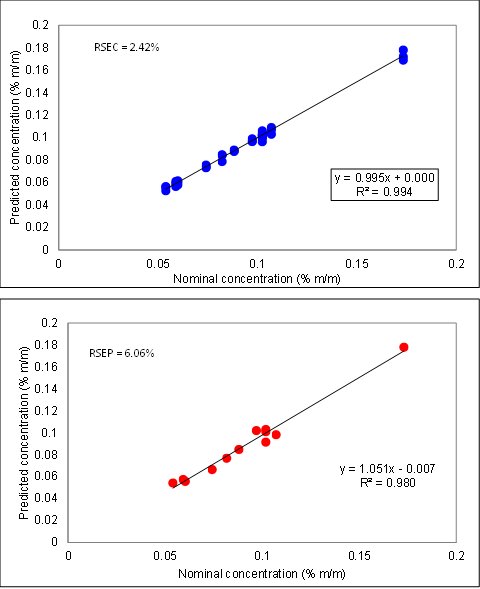
Figure 25. PLSR Scatter Plots of Nominal Versus Predicted Nicotine Concentrations for (a) Calibration, and (b) Validation Sets of Authentic Tobacco Samples Measured Using the MicroNIRTM.

Figure 26. PLSR Scatter Plots of Nominal Versus Predicted Carbon Monoxide Concentrations for (a) Calibration, and (b) Validation Sets of Authentic Tobacco Samples Measured Using the MicroNIRTM
PLSR models showed varying accuracy in predicting NIC and CO concentrations in tobacco products with ranges of 0.06–0.11% m/m for NIC and 0.5–1.2% m/m for CO. Despite higher CO concentrations, the CO model (Model 2) had a lower accuracy (r2 values of 0.59 and 0.47 for calibration and prediction sets), while the NIC model (Model 1) demonstrated somewhat greater accuracy (r2 values of 0.74 and 0.86). Both models displayed significant inaccuracy when forecasting concentrations using FTIR due to its limitation in identifying concentrations below 15% m/m [32].
The combination of PLSR with NIR (Models 5 and 6) produced highly accurate models for CO and NIC measurement, demonstrating precision and accuracy. Model 5 showed excellent NIC concentration prediction accuracy (r2 values of 0.99 for both calibration and validation sets) with extremely low errors (RMSEC, RMSEP, and RSEP values of 0.0022% m/m, 0.0054% m/m, and 6%). Model 6 demonstrated excellent CO prediction accuracy (r2 values of 0.99 and 0.988 for calibration and validation sets) with improved repeatability (RSEP of 2.71% m/m). Combining PLSR and NIR proved more accuracy than FTIR or Raman, as NIR spectra captured physicochemical properties, offering greater responsiveness to material variations [22].
Handheld FTIR, Raman, and NIR spectroscopy are quick, mobile, and non-destructive techniques with minimal sample preparation. FTIR takes around three minutes per sample, while Raman and NIR can measure a replicate in less than a minute, making them faster. FTIR requires less sample and both FTIR and Raman have built-in identification algorithms, while NIR does not. FTIR and NIR were partially successful in identifying counterfeit tobacco samples, however, Raman was ineffective.
3.4.1.2. Multiple Linear Regression (MLR). The figures show the values obtained for MLR models created using FTIR, Raman, and NIR MSC-D1 spectra. The highest and lowest r2 calibration values were seen for model 3 (0.558) and model 2 (0.093), respectively.
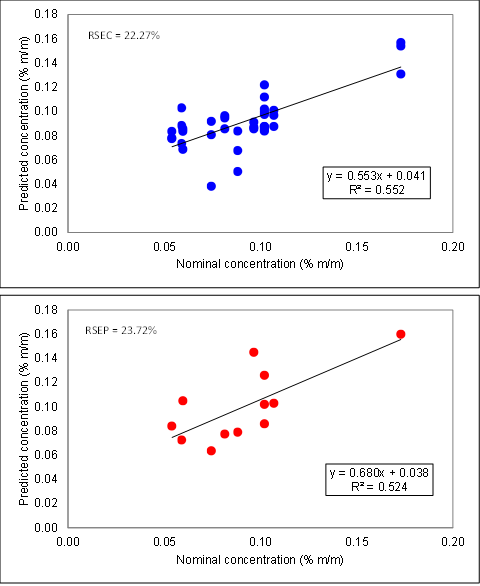
Figure 27. MLR Scatter Plots of Nominal Versus Predicted Nicotine Concentrations for (a) Calibration, and (b) Validation Sets of Authentic Tobacco Measured Using the Mobile-IR FTIR spectrometer.

Figure 28. MLR Scatter Plots of Nominal Versus Predicted Carbon Monoxide Concentrations for (a) Calibration, and (b) Validation Sets of Authentic Tobacco Measured Using the Mobile-IR FTIR Spectrometer
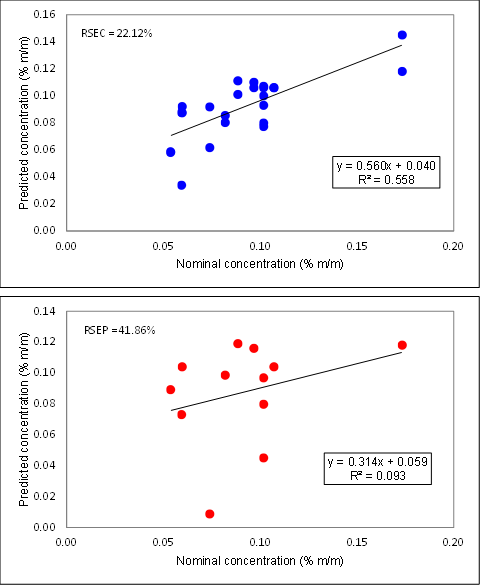
Figure 29. MLR Scatter Plots of Nominal Versus Predicted Nicotine Concentrations for (a) Calibration, and (b) Validation Sets of Authentic Tobacco Measured Using the Handheld Raman Analyzer.

Figure 30. MLR Scatter Plots of Nominal Versus Predicted Carbon Monoxide Concentrations for (a) Calibration, and (b) Validation Sets of Authentic Tobacco Measured Using the Handheld Raman Analyzer
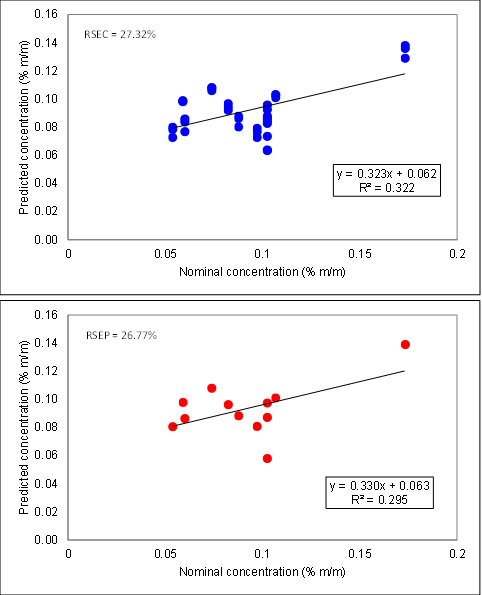
Figure 31. MLR Scatter Plots of Nominal Versus Predicted Nicotine Concentrations for (a) Calibration, and (b) Validation Sets of Authentic Tobacco Measured Using the MicroNIRTM

Figure 32. MLR Scatter Plots of Nominal Versus Predicted Carbon Monoxide Concentrations for (a) Calibration, and (b) Validation Sets of Authentic Tobacco Measured Using the MicroNIRTM
MLR models, using MSC-D1 Raman spectra, showed low prediction accuracy for CO and NIC concentrations with NIC model (Model 3) having subpar accuracy (r2 values of 0.558 and 0.093) and CO model (Model 4) exhibiting even lower accuracy (r2 values of 0.484 and 0.001). Despite a larger concentration range for CO, there was no correlation between CO and NIC concentrations and Model 3 demonstrated better repeatability with near RMSEC and RMSEP values.
MLR models, based on NIR MSC-D1 spectra, demonstrated poor accuracy for NIC (Model 5) and CO (Model 6) concentrations, with low r2 values (0.322, 0.295 for NIC; 0.217, 0.234 for CO) for calibration and validation sets. Despite low precision, the models showed repeatability indicated by consistent RMSEC and RMSEP values (0.025, 0.025 for Model 5; 0.17, 0.17 for Model 6). While, RSEP scores (27% for Model 5, 17% for Model 6) indicated moderate accuracy in predicting concentrations outside the system.
Handheld FTIR, Raman, and NIR spectroscopy offer quick, portable, and non-destructive methods with minimal sample preparation. FTIR takes about three minutes per sample, while Raman and NIR instruments measure a replicate in less than a minute, making them faster. FTIR requires less sample, however, Raman yields the lowest spectral quality. FTIR and NIR were somewhat useful to identify counterfeit tobacco with FTIR spectra combined with PCA having some success. For quantifying NIC and CO concentrations, FTIR produced acceptable accuracy for NIC, Raman PLSR models were less accurate, and NIR showed accurate PLSR models with high precision. However, all three methods produced poor MLR models for NIC and CO. Overall, FTIR MLR models were the most accurate, while Raman MLR models performed the poorest.
The current study explored the efficacy of handheld FTIR, Raman, and NIR spectroscopy combined with chemo-metrics to detect counterfeit tobacco and quantify the nicotine and carbon monoxide levels. While, FTIR with CWS showed an 80% success rate to identify counterfeit products and FTIR-PLSR accurately predicted nicotine concentration. Raman techniques faced challenges due to sample colour. The study suggested potential improvements with surface-enhanced Raman spectroscopy for better Raman signal and emphasized the need for larger sample sizes in future studies for statistical significance. Further research could explore varying nicotine concentrations' impact on spectroscopy and assess binary mixtures for incremental concentrations.
1. Ashworth WJ. Customs and Excise: Trade, Production, and Consumption In England, 1640-1845. Oxford University Press; 2003.
2. UK Border Agency . Tackling tobacco smuggling—building on our success. a renewed strategy for HM revenue & customs and the UK Border Agency. https://assets.publishing.service.gov.uk/media/ 5a7ee0f5ed915d74e33f2fc5/Tackling_tobacco_smuggling-building on our_success.pdf . Updated April, 2011. Accessed December 12, 2023.
3. Ekpu VU, Brown AKJ. The economic impact of smoking and of reducing smoking prevalence: review of evidence. Tobacco Use Ins. 2015;8:1–35. https://doi.org/10.4137/TUI.S15628
4. Spink J, Moyer DC, Park H, Heinonen JA. Defining the types of counterfeiters, counterfeiting, and offender organizations. Crime Sci. 2013;2:1-10. https://doi.org/10.1186/2193-7680-2-8
5. Hecht SS. Tobacco smoke carcinogens and lung cancer. J Nation Can Insti. 1999;91(14):1194–1210. https://doi.org/10.1093/jnci/91.14.1194
6. Cheah NP, Pennings JL, Vermeulen JP, van Schooten FJ, Opperhuizen A. In vitro effects of aldehydes present in tobacco smoke on gene expression in human lung alveolar epithelial cells. Toxicol Vitro. 2013;27(3):1072–1081. https://doi.org/10.1016/j.tiv.2013.02.003
7. World Health Organization. WHO report on the global tobacco epidemic, 2008: the MPOWER package. https://www.who.int/ publications/i/item/9789241596282 . Updated January 6, 2008.
8. Pappas RS, Polzin GM, Watson CH, Ashley DL. Cadmium, lead, and thallium in smoke particulate from counterfeit cigarettes compared to authentic US brands. Food Chem Toxicol. 2007;45(2):202–209. https://doi.org/10.1016/j.fct.2006.08.001
9. Raub JA. Health effects of exposure to ambient carbon monoxide. Chemosph-Glob Change Sci. 1999;1(1-3):331–351. https://doi.org/10. 1016/S1465-9972(99)00005-7
10. Rogers JM. Tobacco and pregnancy. Reprod Toxicol. 2009;28(2):152–160. https://doi.org/10.1016/j.reprotox.2009.03.012
11. Behera SN, Xian H, Balasubramanian R. Human health risk associated with exposure to toxic elements in mainstream and sidestream cigarette smoke. Sci Total Environ. 2014;472:947–956. https://doi.org/10.1016 /j.scitotenv.2013.11.063
12. Chen MJ, Lin CH, Lai CH, Cheng LH, Yang YH, Huang LJ, Yeh SH, Hsu HT. Excess lifetime cancer risk assessment of volatile organic compounds emitted from a petrochemical industrial complex. Aero Air Qual Res. 2016;16(8):1954–1966.
13. van Amsterdam J, Sleijffers A, van Spiegel P, et al. Effect of ammonia in cigarette tobacco on nicotine absorption in human smokers. Food Chem Toxicol. 2011;49(12):3025–3030. https://doi.org/10.1016/ j.fct.2011.09.037
14. Brima EI. Determination of metal levels in shamma (smokeless tobacco) with inductively coupled plasma mass spectrometry (ICP-MS) in Najran, Saudi Arabia. Asian Pac J Cancer Prev. 2016;17(10):4761–4767. https://doi.org/10.22034/APJCP.2016.17.10.4761
15. Assi S. Raw material identification using dual laser handheld Raman spectroscopy. Eur Pharm Rev. 2013;18(5):25–31.
16. Huang S, Zhang J, Wang L, Huang L. Effect of abiotic stress on the abundance of different vitamin B6 vitamers in tobacco plants. Plant Physiol Biochem. 2013;66:63–67. https://doi.org/10.1016/ j.plaphy.2013.02.010
17. Lin X, Sun L, Li Y, et al. A random forest of combined features in the classification of cut tobacco based on gas chromatography fingerprinting. Talanta. 2010;82(4):1571–1575. https://doi.org/10. 1016/j.talanta.2010.07.053
18. Salahuddin, Mazumder A, Yar MS, et al. Updates on synthesis and biological activities of 1, 3, 4-oxadiazole: a review. Synth Commun. 2017;47(20):1805–1847. https://doi.org/10.1080/00397911.2017.1360911
19. Wang H, Zhao M, Yang B, Jiang Y, Rao G. Identification of polyphenols in tobacco leaf and their antioxidant and antimicrobial activities. Food Chem. 2008;107(4):1399–1406. https://doi.org/ 10.1016/j.foodchem.2007.09.068
20. Wang H, Boraey MA, Williams L, Lechuga-Ballesteros D, Vehring R. Low-frequency shift dispersive Raman spectroscopy for the analysis of respirable dosage forms. Int J Pharm. 2014;469(1):197–205. https://doi.org/10.1016/j.ijpharm.2014.04.058
21. Wahl PR, Fruhmann G, Sacher S, Straka G, Sowinski S, Khinast JG. PAT for tableting: inline monitoring of API and excipients via NIR spectroscopy. Eur J Pharm Biopharm. 2014;87(2):271–278. https://doi.org/10.1016/j.ejpb.2014.03.021
22. Duan J, Huang Y, Li Z, et al. Determination of 27 chemical constituents in Chinese southwest tobacco by FT-NIR spectroscopy. Ind Crops Prod. 2012;40:21–26. https://doi.org/10.1016/j.indcrop.2012.02.040
23. Moffat AC, Osselton MD, Widdop B, Watts J. Clarke's Analysis of Drugs and Poisons. London: Pharmaceutical Press; 2011.
24. McCreery RL. Raman Spectroscopy for Chemical Analysis. John Wiley & Sons; 2005.
25. Dagnon S, Ivanov I, Bojilov D, Docheva M, Statkova S. Evaluation of the main polyphenolic compounds in aromatic plants of Asteraceae and Solanaceae families of Bulgarian origin. J Pharm Phytochem. 2013;1(6):76–84.
26. Sun Y, Li W, Wang J, Bi J, Su S. Determination of rutin in cigarette tobacco, filters, mainstream smoke and burned ash of different branded cigarettes by high performance liquid chromatography. Molecules. 2012;17(4):3751–3760. https://doi.org/10.3390/molecules17043751
27. Tan C, Qin X, Li M. Comparison of chemometric methods for brand classification of cigarettes by near-infrared spectroscopy. Vibration Spect. 2009;51(2):276–282. https://doi.org/10.1016/j.vibspec.2009.07.004
28. Ortiz RS, de Cássia Mariotti K, Fank B, Limberger RP, Anzanello MJ, Mayorga P. Counterfeit Cialis and Viagra fingerprinting by ATR-FTIR spectroscopy with chemometry: can the same pharmaceutical powder mixture be used to falsify two medicines? Forens Sci Inte. 2013;226(1-3):282–289. https://doi.org/10.1016/j.forsciint.2013.01.043
29. Bennett R. Applications of a modulated laser for FT Raman spectroscopy. Part 2. Signal-to-noise enhancement and removal of thermal backgrounds. Molecul Biomol Spectro. 1995;51(12):2001–2009. https://doi.org/10.1016/0584-8539(95)01491-7
30. Lee MS, Hwang YS, Lee J, Choung MG. The characterization of caffeine and nine individual catechins in the leaves of green tea (Camellia sinensis L.) by near-infrared reflectance spectroscopy. Food Chem. 2014;158:351–357. https://doi.org/10.1016/j.foodchem.2014.02.127
31. Shao Y, He Y, Wang Y. A new approach to discriminate varieties of tobacco using vis/near infrared spectra. Eur Food Res Technol. 2007;224:591–596. https://doi.org/10.1007/s00217-006-0342-9
32. Togkalidou T, Fujiwara M, Patel S, Braatz RD. Solute concentration prediction using chemometrics and ATR-FTIR spectroscopy. J Cryst Growth. 2001;231(4):534–543. https://doi.org/10.1016/S0022-0248(01)01518-4