Enhancing Ticagrelor Solubility Through the Solid Dispersion Method
Saba Akram1, Muhammad Zaman1, Mahpara Almas2, Syeda Aamna Hassan3, Waqar Siddique4*
1Faculty of Pharmaceutical Sciences, University of Central Punjab, Lahore, Pakistan
2Department of Pharmacy, University of Lahore, Pakistan
3School of Pharmacy, University of Management and Technology, Lahore, Pakistan
4Riphah Institute of Pharmaceutical Sciences, Riphah International University, Lahore Campus, Pakistan
Abstract
Ticagrelor (TCG) is a pharmaceutical drug used for the treatment of acute coronary syndrome, angina, and stroke. It has low solubility and less permeability and is classified as a BCS (Biopharmaceutical Classification System) Class IV drug. It has low water solubility. So, there is a need to increase the solubility of this drug. Hence, this study was aimed to augment the solubility of TCG using various approaches. Furthermore, solid dispersion of the drug and carriers was prepared and various preparations were estimated for several parameters, including phase solubility, drug release, and chemical compatibility. For this purpose, different chemicals were used including polyethylene glycol-6000 (PEG-6000), poloxamer 407 (PLX), β-cyclodextrin (β-CD), Transcutol-P (TP), Tween-80, and ethanol. Particle size reduction, complexation, change in pH, co-solvency, and solid dispersion via solvent evaporation and kneading were used to improve the solubility of TCG. According to the findings, there was no significant change in the absorbance value of the drug at different pH. The FTIR spectra did not show the emergence of new peaks indicating the drug's and carriers’ chemical compatibility. Moreover, PLX plays a major role in enhancing the solubility of TCG. Furthermore, the phase solubility of all formulations augmented with the increase of ethanol because TCG is soluble in ethanol. These outcomes imply that all these techniques may serve as effective means for enhancing TCG’s solubility.
Introduction
The solubility of orally administered drugs is one of the rate-limiting factors for proper absorption in systemic circulation and pharmacological reaction. According to BCS (Biopharmaceutical Classification System), the solubility of the drug and its intestinal permeability are the two main factors which determine drug absorption after oral administration. BCS is divided into four classes [1]. TCG belongs to BCS Class 4.
TCG is a crystalline white powder. It is sparingly soluble in aqueous solution at room temperature approximately 10 µg/ml [2]. It causes rapid inhibition of ADP-induced platelet aggregation. It is used in atherothrombotic conditions, patients with heart attacks, and acute coronary syndrome [3]. Its bioavailability is 30-42% [4].
Solubility is considered as the main factor for good absorption and bioavailability of drugs. The dissolution rate of a drug is augmented by its solubility which increases its bioavailability. So, the most important aspect of the production of new drugs is to enhance their solubility which, in turn, increases their oral bioavailability [5]. Due to advancements in technology, it is now feasible for scientists to use various approaches during drug designing. These methods include micronization, co-solvency, pH adjustment, solid dispersion, and the use of Self-Micro Emulsifying Drug Delivery Systems (SMEDDS) [6].
Drug particle size mainly affects the solubility of the drug. This is because a smaller particle size results in an increased surface area which leads to the availability of more sites and better interaction with water which enhances solubility [7]. To enhance the solubility of drugs in aqueous environments, complexation formation is regarded as the best technique. For the complexation formation of drugs, a variety of polymers can be used. β-cyclodextrin (β-CD) is commonly used in pharmaceuticals because of its ability to improve solubility and drug stabilization by complexation formation [8, 9].
PLXs are non-ionic triblock copolymers and consist of a central hydrophobic region surrounded by two hydrophilic groups [10]. It functions as a polymer surfactant [11]. Polyethylene glycol (PEG-6000) behaves as a binder and as a dry lubricant. Studies related to solubility showed that higher phase solubility of the drug is related to an increase in the PEG molecular weight [12]. Co-solvency is one of the efficient solubility enhancement techniques [13]. Co-solvents, such as ethanol, propylene glycol, glycerin, and polyethylene glycol are used [14]. They convert an immiscible substance into its miscible form [15]. Certain drugs show prominent variation in solubility when their pH is changed [16]. Different types of buffers can be used to adjust the pH up to the required value [17]. The current study aimed to enhance the solubility of TCG. For this purpose, different techniques along with different carriers were evaluated for their potential to improve drug solubility.
2. MATERIALS AND METHODS
2.1. Chemicals
Chemicals included TCG, PEG-6000, PLX-407, β-CD, ethanol, Tween-80, Transcutol-P (TP), and distilled water. All chemicals were purchased from Sigma Aldrich, USA except TCG which was procured from CCL Laboratories Pvt. Ltd., Lahore, Pakistan. Distilled water was taken from Post Graduate Research Lab, Department of Pharmacy, University of Central Punjab, Lahore, Pakistan. All chemicals purchased and used in the current research work were of analytical grade.
2.2. Solubility Enhancement Techniques
To enhance the solubility of TCG, various techniques including particle size reduction, complexation formation via kneading, co-solvency, and pH change were used.
2.2.1. Particle Size Reduction. The reduction of particle size was performed by triturating 0.2 g TCG in a mortar and pestle for 30 minutes.
2.2.2. Complexation Formation via Kneading. PLX, β-CD, and PEG-6000 act as solubility enhancers which were used to form different complexes using variable drug-to-carrier ratios. All chemicals were weighed and transferred to the mortar and pestle. Ethanol was taken as the kneading agent. Firstly, the drug and carrier were triturated, followed by the addition of ethanol in a suitable quantity. This process took 30 minutes until a homogeneous and damp mass was obtained. Subsequently, the mass was passed through sieve 40 and air-dried. The air-dried mass was stored in a closed container for further use.
2.2.3. Co-solvency. In this method, a co-solvent (ethanol) in different ratios was used to check the degree of solubility of the drug in the mixture. It was found that TCG is very slightly soluble in water and it has better solubility in ethanol.
2.2.4. pH Change. TCG /exists with pH 7.4 in a neutral, un-dissociated form. Several buffers of different pH values (7.4, 7.2, 6.8, 4, and 1.2) were used to check the effect of change in pH on the solubility of the drug. A total of 20 mg of the drug was taken in 20 ml of buffer and stirred for 24hr. The samples were diluted and filtered and their absorbance was measured using a UV-visible spectrophotometer (HALO DB-20, Australia) at 276 nm.
2.3. Formulation Development and Numerical Optimization
2.3.1. Formulation Development. Two solubility enhancers namely PLX and β-CD were selected to formulate their complexes with TCG. Transcutol-P (co-surfactant) was used to develop the solid dispersion of TCG. Design Expert (ver. 11) was used, followed by the application of Central Composite Rotatable Design (CCRD), to develop the formulation using solubility enhancer (X1) and co-surfactants (X2) as variables. A total of ten (10) formulations were made and evaluated. The concentration of the drug remained constant in each formulation. Different responses including phase solubility and in vitro drug release studies were analyzed.
2.3.2. Complexation Formation using Design Expert. Different complexes were formed by using PLX and β-CD as solubility enhancers, using variable drug-to-carrier ratios. The required amount of drug and carriers were weighed and transferred to the mortar and pestle. Ethanol was taken as the kneading agent. Initially, the drug and carrier were triturated, followed by addition of Transcutol-P and Tween-80 in suitable amounts. The kneading process was continued for 30 minutes and 2 ml of ethanol was added in the mass. Afterwards, the formulation with β-CD was dried in hot air oven at 30°C, whereas the formulation with PLX was dried at room temperature. The mass was then passed through sieve 40 and air-dried. The air-dried mass was kept at room temperature in a closed container for further use.
2.3.3. Numerical Optimization. The studied responses were used to optimize the formulation, where constraint parameters such as the concentration of carrier and surfactant were within range. The maximum level of phase solubility and in vitro dissolution was selected.
2.4. Pre-formulation Studies
2.4.1. Determining the Calibration Curve of TCG. The calibration curve of TCG was determined by forming serial dilutions of the drug from a stock solution. The stock solution was prepared by dissolving 5 mg of the drug in a suitable volume of ethanol (up to 5 ml) to obtain a final concentration of 1 mg/ml. It was used to prepare serial dilution ranging from 10-60 µg/ml. Consequently, the concentration of the drug in each respective dilution was determined by using a UV-visible spectrophotometer at 276 nm.
2.5. Post-formulation Studies
2.5.1. Fourier Transformed Infrared Spectroscopy (FTIR). To determine the functional groups present in surfactants and solubility enhancers (PLX, PEG-6000, Transcutol-P, and β-CD) and to ascertain the compatibility of the selected ingredients, their samples were analyzed by FTIR (Alpha Burker FTIR, Germany). The FTIR spectrum of pure PEG-6000, β-CD, PLX, Transcutol-P, Tween-80, and complex formulations with the drug were observed. The spectrums were recorded within the wavelength range of 400-4000 cm-1 [18].
2.5.2. Phase Solubility Studies. Phase solubility studies were conducted using a magnetic stirrer. For this purpose, 20 mg powdered formulation and 25 ml distilled water were added to the volumetric flask. After mixing of contents for three (03) consecutive days, the samples were filtered through filter paper. Then, absorbance was measured via a UV-visible spectrophotometer. The quantity of the drug was calculated by using equation (1). Phase solubility was calculated by using the following formula:
Y=mx+c e.q. 1
2.5.3. Ternary Phase Diagram. A ternary phase diagram was drawn according to the quantity of solubility enhancer, surfactant, and water.
2.5.4. Gibbs Free Energy. The transfer of the drug from the tea bag to the aqueous solution was calculated using the following equation 2:
ΔG0 = -2.303RT log [S0/SS]
where SS represents the solubility of the drug in the absence of a solubility enhancer, S0 is the solubility of the drug in the presence of a solubility enhancer, and ΔG0 is the change in Gibbs free energy.
2.5.5. In Vitro Drug Release Studies. USP paddle apparatus II was selected for in vitro drug release analysis. Tea bags were loaded with formulations, each containing 200 mg of the drug. These tea bags were immersed in dissolution media (250 ml) and the paddle apparatus was run at 50 rpm at 37°C. After regular intervals of 15, 30, 45, 60, 75, 90, 105, and 120 minutes, 5 ml of the sample was withdrawn from the dissolution apparatus and the same quantity was filled back with fresh buffer maintained at 37°C to maintain sink conditions. The samples were then filtered and the concentration of drug release was quantified by using the UV-visible spectrophotometer. The percentage of drug release was then calculated by using the following equation 3:
% Drug Release = (Absorbance of sample ÷ Absorbance of standard) × 100% (3)
2.5.5.1. Dissimilarity and Similarity Factor. Dissimilarity and similarity factors of formulations were calculated. In this regard, f1 represents the percentage difference (dissimilarity) between two dissolution profiles, whereas f2 indicates the average percentage of similarity between two dissolution profiles.
2.5.6. Kinetic Modeling. DD Solver software was used to analyze the kinetic models (zero order, first order, Higuchi’s Hixon Crowell and Korsmeyer-Peppas model) for all of the prepared formulations [19].
3. RESULTS AND DISCUSSION
3.1. Phase Solubility Studies
3.1.1. Particle Size Reduction. A phase solubility study was conducted on TCG after particle size reduction. The concentration (mg/ml) was calculated using an equation of calibration curve. The concentration of the drug after particle size reduction was 0.367 mg/ml.
3.1.2. Complexation Formation via Kneading. Phase solubility studies were performed on all the formulations, that is, 1:2, 1:4, and 1:6 of TCG and β-CD. The concentration (mg/ml) was estimated by using the equation of calibration curve. The concentration of f1 β-CD, f2 β-CD, and f3 β-CD was 0.39 mg/ml, 1.04 mg/ml, and 1.65 mg/ml, respectively. The increase in solubility was found to be significant in comparison with f1 β-CD and f2 β-CD.
The values for the phase solubility studies of PLX and drug complex were 0.49 mg/ml, 1.2 mg/ml, and 2.14 mg/ml for 1:2, 1:4, and 1:6, respectively. A previous study also reported the same results [19]. Hence, the current results revealed that the extent of solubility improved markedly via PLX as solubility enhancer. Phase solubility studies were performed on all formulations, that is, 1:2, 1:4, and 1:6 of TCG and PEG. The concentration of f1 PEG, f2 PEG, and f3 PEG was 0.48 mg/ml, 0.86 mg/ml and 1.99 mg/ml, respectively. Solubility increased significantly as compared to f1 PEG and f2 PEG.
3.1.3. Co-Solvency. Phase solubility studies were performed using all formulations with co-solvent. In this regard, 10 different ratios were formed labelled as f1, f2, f3, f4, f5, f6, f7, f8, f9, and f10, respectively. Phase solubility of formulations was 1.086, 2.33, 2.97, 3.78, 4.25, 4.59, 6.75, 6.97, and 7.07 mg/ml, respectively (Figure 1). An increase in phase solubility of formulations was observed with the increase in ethanol [20].
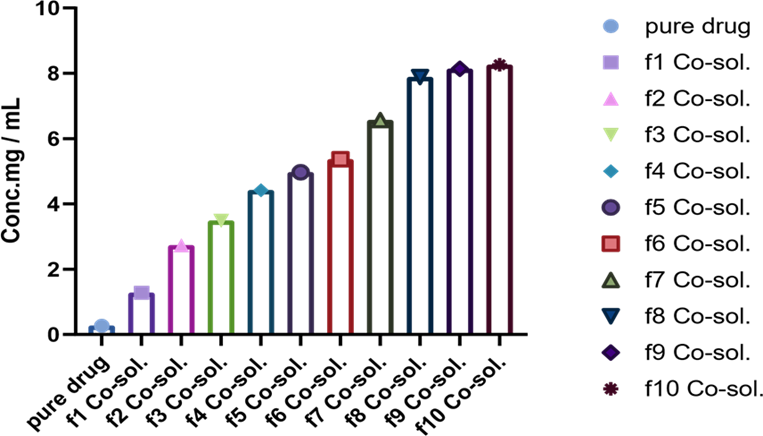
Figure 1. Phase Solubility Studies using Ethanol as Co-Solvent in Different Ratios by using Co-Solvency Approach
3.1.4. pH change. At different pH values, phase solubility was performed. Phase solubility of the pure drug was 0.27 mg/ml. Thus, the results regarding change in pH showed no considerable variation in phase solubility, which is in good agreement with the reported literature [21].
3.2. Complexation Formation using Design Expert
3.2.1 Complex of TCG with β-CD. Phase solubility studies were made on all the formulations composed through design expert with solubility enhancer β-CD and co-surfactant Transcutol-P in different ratios and their results are depicted in Figure 2. The increase in solubility depends on the concentration of surfactant and co-surfactant and it ranged from 1 mg/ml to 2.5 mg/ml.
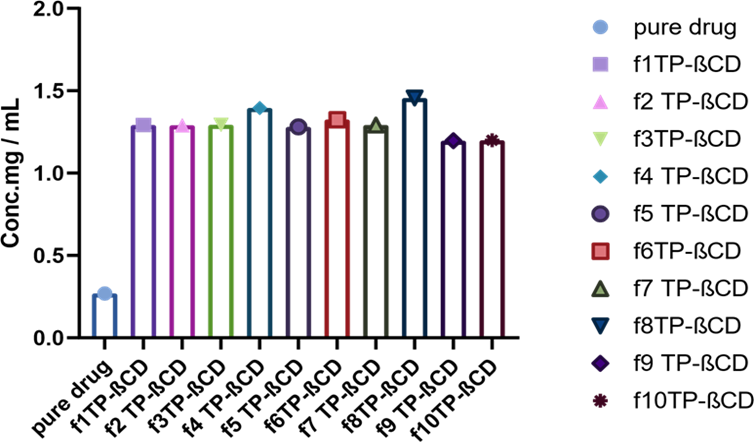
Figure 2. Phase Solubility of Formulations Designed using Design Expert with Transcutol-P and β-CD
3.2.2 Complex of TCG with PLX. Design expert with solubility enhancer PLX and co-surfactant Transcutol-P in different ratios was used for phase solubility studies and performed on all formulations. Their effects are indicated in Figure 8. It was observed that the increase in solubility is dependent upon the concentration of solubility enhancer and co-surfactant which ranged from 1.4 mg/ml to 2.9 mg/ml.
3.3.Numerical Optimization
Design expert was used to form optimize formulations. Phase solubility of f1 OPT PLX was 1.2 mg/ml and phase solubility of f1 OPT β-CD was 0.8 mg/ml (Figure 3). Therefore, it was concluded that the extent of solubility was enhanced significantly.
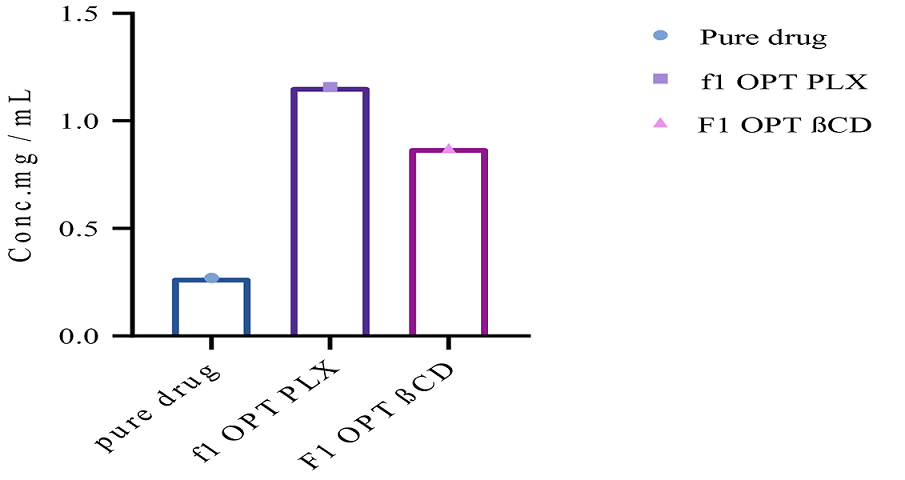
Figure 3. Phase Solubility Studies of Optimized Formulations and their Comparison with Pure Drug
3.4. Pre-formulation Studies
3.4.1. Calibration Curve of TCG. A good linearity was revealed where the value of R2 was 0.9946, while the values of slope and intercept were 0.0007 and 0.1708, respectively, as illustrated in Figure 10.
3.5. Post-Formulation Studies
3.5.1. FTIR Analysis. FTIR spectra of TCG, PEG-6000, β-CD, PLX, Tween-80, Transcutol-P, and complex formulations formed by kneading, solid dispersion, and solvent evaporations were scanned to study the functional groups (Figure 4).
The FTIR band of Tween-80 displayed the bands of CH2 at 2855 and 2907 cm-1 respectively. A stretching band due to the ester group was observed at 1735 cm-1. The FTIR band of PEG-6000 revealed a sharp peak for C-H at 2887 cm-1. Another peak of C-H was observed at 1464 cm-1 [22].
The FTIR analysis of Transcutol-P displayed a peak at 3300 cm-1 with O-H stretching. O-H stretching was observed at 2700 cm-1 and C-H stretching at 1465 cm-1. While, C-H bending was observed at 1385 cm-1. CO stretching was detected at 1200 cm-1 whereas C-H bending was observed at 880 cm-1 [23]. The FTIR results of PLX showed a peak at 2883 cm-1 of C-H stretching. O-H bending was observed at 1341 cm-1 and C-O stretching was observed at 1099 cm-1 which remained the same in all binary systems with the drug [24].
The FTIR of pure drug displayed a peak of N-H with broadening peak at 3400 cm-1. At 3300 cm1a sharp peak was observed confirming the OH stretching. The peak at 2924 cm-1 illustrated -CH stretching. C=C stretching was observed at the peak of 1600 cm-1. S=O stretching was observed at 1380-1410 cm-1. OH bending was /observed at 1395 cm-1. The FTIR analysis of β-CD showed a peak of -OH stretching vibrations at 3285 cm-1 whereas the peak at 2924 cm-1 was due to -CH. C-O and C-O-C stretching were illustrated by the peaks at 1415 cm-1 and 1077 cm-1 respectively [25].
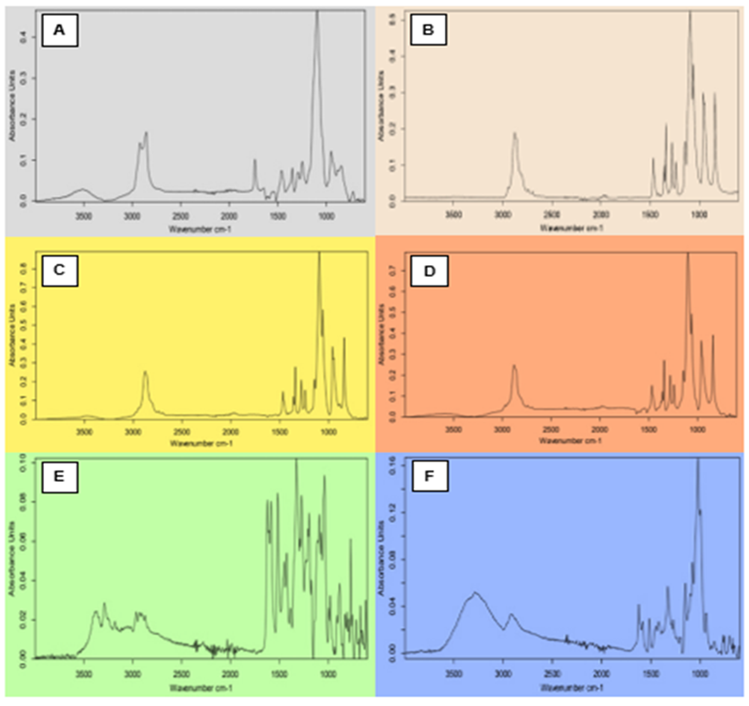
Figure 4. (A) FTIR Spectrum of Tween-80, (B) PEG-6000, (C) Transcutol-P, (D) PLX, (E) TCG, and (F) β-CD
The FTIR spectra of PLX displayed a peak at 2883 cm-1 of C-H stretching. O-H bending was observed at 1341 cm-1, 1099 cm-1, and 1395 cm-1. S=O stretching was observed at 1380 to 1410 cm-1. TCG is compatible with PLX because peaks did not coincide in the FTIR spectra of their complexes [26] (Figure 5).
The FTIR spectrum of β-CD and the drug showed a peak at 3285 cm-1 confirming the presence of the OH group. The peak at 2924 cm-1 indicated -CH stretching vibrations. S=O stretching was observed at 1380 to 1410 cm-1. OH bending was /observed at 1395 cm-1. C-F stretching was observed at the peak of 1000-1400 cm-1. C-O group was confirmed by the peak at 1415 cm-1. C-H bending was /observed at 750 cm-1. The IR scan did not show the emergence of new peaks confirming the chemical compatibility of the drug and carrier [27].
The FTIR results of PEG-6000 and the drug displayed the presence of C-H group by confirming a strong peak at 2887 cm-1. The group –CH was confirmed at 2924 cm-1 peak. C-H bending was observed at 1464 cm-1. The C-O-H stretching was depicted by the peaks at 1094 cm-1. The FTIR spectra of pure drug indicated a peak of N-H stretching at 3400 cm-1. The peak at 3300 cm-1 confirmed -OH group. C=C stretching was /observed at the peak of 1600 cm-1. The FTIR spectra of PEG-6000 showed no overlapping peaks, thus indicating that the drug is harmonious with the carrier [28].
The FTIR study of β-CD, Transcutol-P, and TCG showed a peak of N-H at 3300 cm-1. The -OH stretching vibrations were displayed at 3285 cm-1. The peak at 2924 cm-1 depicted the -CH group. The peak at 1650 cm-1 indicated C=O. The peaks at 1610 cm-1-1620 cm-1 confirmed C=C stretching. N-O stretching was /observedobserved at 1500-1550 cm-1 whereas S=O stretching was /observed at 1380 to 1410 cm-1. C-F stretching was observed at the peak of 1000-1400 cm-1. CH bending was observed at 750 cmr-1. No peaks were observed as overlapping which suggested that the drug is compatible with Transcutol-P and β-CD [17].
The FTIR band of TCG, β-CD, and Transcutol-P showed a peak of N-H at 3200 cm-1. The peak at 1650 cm-1 indicated C=O. The peaks at 1610 cm-1-1620 cm-1 depicted C=C stretching. S=O stretching was /observed at 1380 to 1410 cm-1. OH bending was shown at 1395 cm-1. C-F stretching was shown at the peak of 1000-1400 cm-1 [29].
The FTIR spectra of PLX, Transcutol-P, and TCG showed peak at 2883 cm-1 due to C-H stretching. O-H bending was observed at 1341 cm-1 and 1099 cm-1. OH bending was observed at 1395 cm-1. S=O stretching was observed at 1380 to 1410 cm-1. S=O stretching was observed at 1380 to 1410 cm-1. C-F stretching was observed at the peaks of 1000-1400 cm -1 [30].
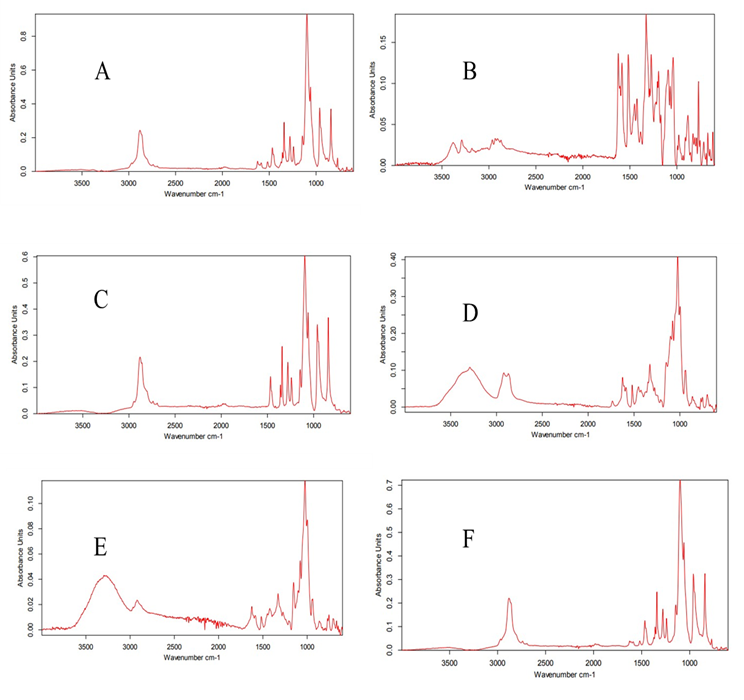
Figure 5. (A) FTIR Spectrum of PLX and Pure Drug TCG by Kneading, (B) FTIR Spectrum of β-CD and Pure Drug TCG by Kneading, (C) FTIR Spectrum of PEG-6000 and Pure Drug TCG by Kneading, (D) FTIR Spectrum of β-CD, Transcutol-P, and TCG by Kneading, (E) FTIR Spectrum of β-CD, Transcutol-P, and TCG Solid Dispersions, (F) FTIR Spectrum of PLX, Transcutol-P, and TCG by Kneading
The FTIR spectra of PLX and pure drug TCG showed a peak at 2883 cm-1 due to C-H stretching. O-H bending was observed at 1341 cm-1, while C-O stretching was observed at 1099 cm-1 which was consistent in all binary systems with the drug. OH bending was observed at 1395 cm-1. C-F stretching was observed at the peak of 1000-1400 cm-1 [31].
3.5.2. Ternary Phase Diagram. Ternary phase diagram (Figure 6) was formed using XLSTAT to demonstrate the compatibility of all the ingredients including the drug TCG, solubility enhancers, and the surfactant. The diagram shows possible phases and their equilibrium according to the composition of solubility enhancers, co-surfactant, and the solvent at constant temperature and pressure [32].
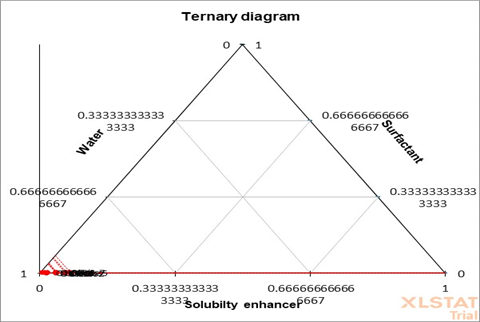
Figure 6. Ternary Phase Diagram
3.5.3. Gibbs Free Energy.
3.5.3.1. Particle Size Reduction.
Table 1. Gibbs Free Energy of Pure Drug after Particle Size Reduction
|
Ss |
So |
S₀/SS |
Log (S₀/SS) |
-2.303*RT |
ΔG (mg) |
ΔG (KJ) |
|
0.36 |
0.38 |
0.9043 |
-0.0436 |
-5706 |
249 |
0.249 |
3.5.3.2. Complexation Formation via Kneading.
Table 2. Gibbs Free Energy of Formulation of Kneading of β-CD, PLX, and PEG-6000
|
Ss |
So |
S₀/SS |
Log (S₀/SS) |
-2.303*RT |
ΔG (mg) |
ΔG (KJ) |
|
0.36 |
0.4 |
0.9744 |
-0.0113 |
-5706 |
64 |
0.064 |
|
0.36 |
0.79 |
0.3756 |
-0.4253 |
-5706 |
2427 |
2.427 |
|
0.36 |
1.31 |
0.5457 |
-0.2631 |
-5706 |
1501 |
1.501 |
|
0.36 |
0.434 |
4.2614 |
0.6295 |
-5706 |
-3592 |
-3.592 |
|
0.36 |
0.868 |
0.3823 |
-0.4176 |
-5706 |
2383 |
2.383 |
|
0.36 |
1.45 |
0.5469 |
-0.2621 |
-5706 |
1495 |
1.495 |
|
0.36 |
0.32 |
8.3092 |
0.9196 |
-5706 |
-5247 |
-5.247 |
|
0.36 |
0.656 |
0.3151 |
-0.5015 |
-5706 |
2862 |
2.862 |
|
0.36 |
1.4 |
0.3974 |
-0.4008 |
-5706 |
2287 |
2.287 |
3.5.3.3. Co-Solvency.
Table 3. Gibbs Free Energy of the Formulation of Co-solvency
|
Ss |
So |
S₀/SS |
Log (S₀/SS) |
-2.303*RT |
ΔG (mg) |
ΔG (KJ) |
|
0.36 |
0.188 |
23.212 |
1.3657 |
-5706 |
-7793 |
-7.793 |
|
0.36 |
0.931 |
0.030 |
-1.5298 |
-5706 |
8729 |
8.729 |
|
0.36 |
1.805 |
0.467 |
-0.3307 |
-5706 |
1887 |
1.887 |
|
0.36 |
2.256 |
0.784 |
-0.1055 |
-5706 |
602 |
0.602 |
|
0.36 |
2.818 |
0.788 |
-0.1034 |
-5706 |
590 |
0.590 |
|
0.36 |
3.146 |
0.890 |
-0.0506 |
-5706 |
289 |
0.289 |
|
0.36 |
3.384 |
0.926 |
-0.0333 |
-5706 |
190 |
0.190 |
|
0.36 |
4.107 |
0.817 |
-0.0880 |
-5706 |
502 |
0.502 |
|
0.36 |
4.896 |
0.833 |
-0.0792 |
-5706 |
452 |
0.452 |
|
0.36 |
5.05 |
0.968 |
-0.0139 |
-5706 |
79 |
0.079 |
|
0.36 |
5.121 |
0.986 |
-0.0062 |
-5706 |
36 |
0.036 |
3.5.3.4. Numerical Optimization.
Table 4. Gibbs Free Energy of the Formulation of β-CD, Transcutol-P, and TCG according to Design Expert
|
Ss |
So |
S₀/SS |
Log (S₀/SS) |
-2.303*RT |
ΔG (mg) |
ΔG (KJ) |
|
0.36 |
1.075 |
0.2092 |
-0.6793 |
-5706 |
3876 |
3.876 |
|
0.36 |
1.074 |
0.2095 |
-0.6789 |
-5706 |
3873 |
3.873 |
|
0.36 |
1.076 |
0.2090 |
-0.6798 |
-5706 |
3879 |
3.879 |
|
0.36 |
1.148 |
0.1936 |
-0.7131 |
-5706 |
4069 |
4.069 |
|
0.36 |
1.067 |
0.2111 |
-0.6755 |
-5706 |
3854 |
3.854 |
|
0.36 |
1.099 |
0.2038 |
-0.6907 |
-5706 |
3941 |
3.941 |
|
0.36 |
1.19 |
0.1856 |
-0.7313 |
-5706 |
4173 |
4.173 |
|
0.36 |
1.075 |
0.2092 |
-0.6793 |
-5706 |
3876 |
3.876 |
|
0.36 |
1.009 |
0.2257 |
-0.6464 |
-5706 |
3688 |
3.688 |
|
0.36 |
1.011 |
0.2252 |
-0.6475 |
-5706 |
3694 |
3.694 |
Table 5. Gibbs Free Energy of the Formulation of PLX, Transcutol-P, and TCG according to Design Expert
|
Ss |
So |
S₀/SS |
Log (S₀/SS) |
-2.303*RT |
ΔG (mg) |
ΔG (KJ) |
|
0.36 |
1.095 |
0.9773 |
-0.0100 |
-5706 |
57 |
0.057 |
|
0.36 |
1.094 |
0.9805 |
-0.0086 |
-5706 |
49 |
0.049 |
|
0.36 |
1.096 |
1.0562 |
0.0237 |
-5706 |
-136 |
-0.136 |
|
0.36 |
1.168 |
0.8987 |
-0.0464 |
-5706 |
265 |
0.265 |
|
0.36 |
1.089 |
1.0109 |
0.0047 |
-5706 |
-27 |
-0.027 |
|
0.36 |
1.299 |
0.9034 |
-0.0441 |
-5706 |
252 |
0.252 |
|
0.36 |
1.29 |
0.8079 |
-0.0926 |
-5706 |
529 |
0.529 |
|
0.36 |
1.95 |
0.4711 |
-0.3269 |
-5706 |
1865 |
1.865 |
|
0.36 |
1.01 |
1.0012 |
0.0005 |
-5706 |
-3 |
-0.003 |
|
0.36 |
1.011 |
0.9773 |
-0.0100 |
-5706 |
57 |
0.057 |
Table 6. Gibbs Free Energy of Optimized Formulation
|
Ss |
So |
S₀/SS |
Log (S₀/SS) |
-2.303*RT |
ΔG (mg) |
ΔG (KJ) |
|
0.36 |
0.86 |
1.3395 |
0.1270 |
-64 |
-0.0641 |
-0.0001 |
|
0.36 |
0.69 |
1.7820 |
0.2509 |
143 |
0.1425 |
0.0001 |
It is evident that the ΔG0 values obtained were negative. These values increased by increasing the solubility enhancer concentration in all the different formulations evaluated in this research. If ΔG0 is negative, then the process is impulsive. As ΔG0 becomes more negative, the reaction becomes more favorable. This suggests that PLX offers a more favorable environment as compared to PEG and β-CD [33].
3.5.4. In Vitro Drug release.
3.5.4.1. Complexation Formation by Kneading with β-CD. Drug release studies were performed on all the β-CD formulations (1:2, 1:4 and 1:6) and comparison was made with the drug release of the pure drug. The drug release of f1 β-CD was 47% (Figure 7). However, the drug release of f2 β-CD and f3 β-CD was 53% and 60%, respectively (in 60 minutes). There was a significant increase in drug release as compared to the pure drug.
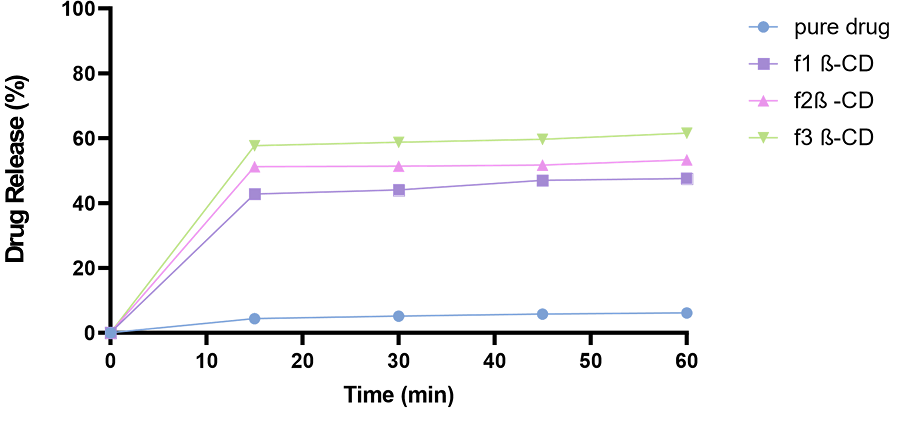
Figure 7. In vitro Drug Release Studies of TCG Complexed with β-CD having Different Ratios (1:2, 1:4, 1:6)
3.5.4.2. Complexation Formation by Kneading Technique with PLX. The drug release studies were performed for PLX based formulations in the same manner. The complex showed 80%, 90%, and 100% drug release in 60 minutes for f1 PLX, f2 PLX, and f3 PLX, respectively (Figure 8).
Time (min)
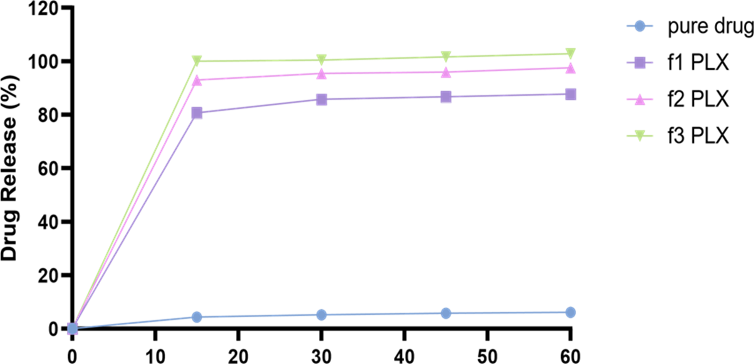
Figure 8. In Vitro Drug Release Studies of TCG Complexed with PLX having Different Ratios (1:2, 1:4, 1:6)
3.5.4.3. Complexation Formation by Kneading Technique with PEG-6000. Drug release studies were conducted using all the formulations, that is, 1:2, 1:4, and 1:6 of TCG and PEG and comparison was made with the drug release of the pure drug (Figure 9). The drug release of f1 PEG improved with an increase of 39%. The drug release of f2 PEG improved by 49%. Whereas, the drug release of f3 PEG improved by 80%. The increase in the drug release was significant in comparison with f2 PEG and f3 PEG [34].
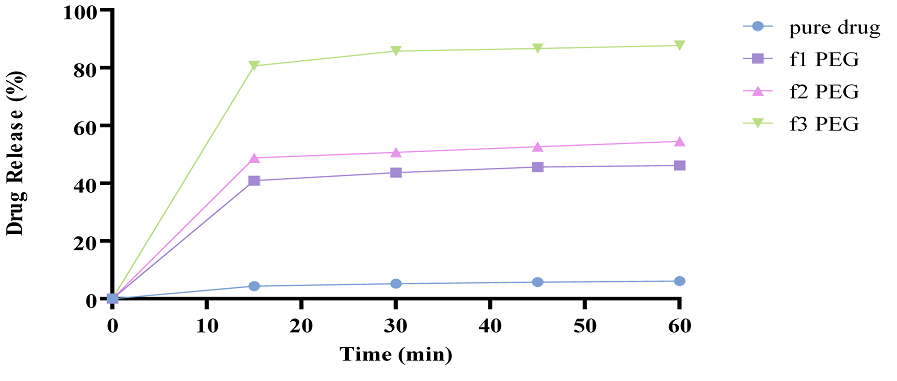
Figure 9. In Vitro Drug Release Studies of TCG Complexed with PEG-6000 Having Different Ratios (1:2, 1:4, 1:6)
3.5.4.4. Complexation Formation of TP-β-CD
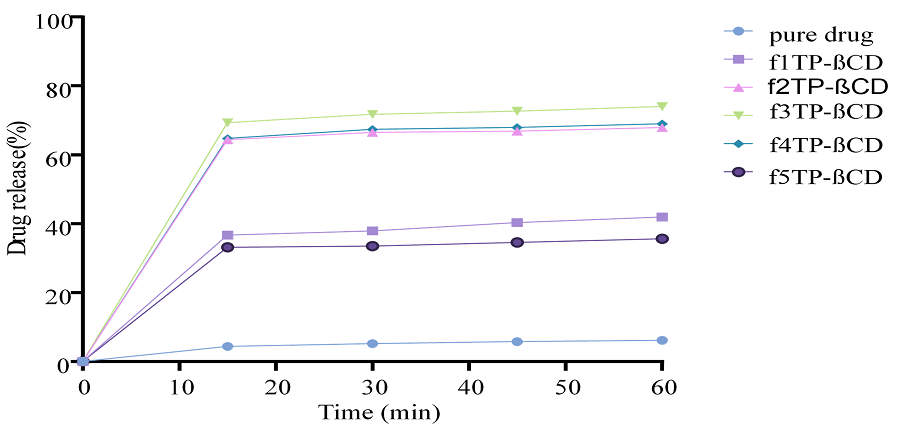
Figure 10. In Vitro Drug Release Studies of TCG Complexed with β-CD using Transcutol-P as Co-surfactant (F1-F5)
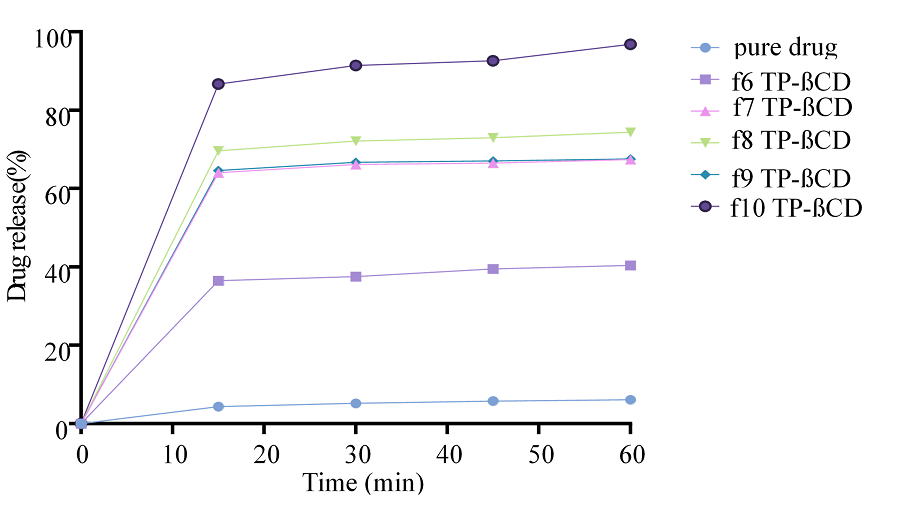
Figure 11. In Vitro Drug Release Studies of TCG Complexed with β-CD using Transcutol-P as Co-surfactant (F6-10)
The findings of in vitro drug release studies were conducted for different complexes prepared using β-CD as carrier and Transcutol-P as co-surfactant. Drug release was in the range of 35%-95% (Figures 10 and 11). It was revealed that with the increase in solubility enhancer β-CD and co-surfactant, there was a significant increase in the drug release [35].
3.5.4.5. Complexation Formation of TP-PLX.
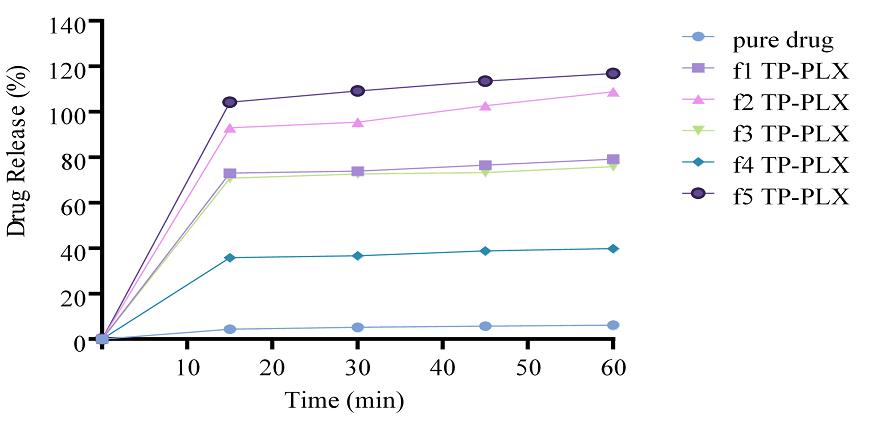
Figure 12. In Vitro Drug Release Studies of TCG Complexed with PLX using Transcutol-P as co-surfactant (F1-F5)
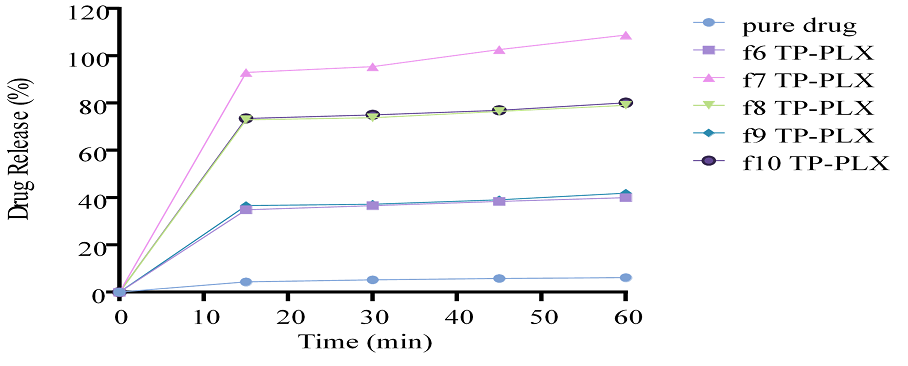
Figure 13. In Vitro Drug Release Studies of TCG Complexed with PLX using Transcutol-P as Co-surfactant (F6-F10)
In vitro drug release studies were performed for different complexes prepared using PLX as solubility enhancer and TP as co-surfactant. Drug release was in the range 40% to 116% (Figures 12 and 13). The outcomes showed that as the respective concentration of solubility enhancer PLX and co-surfactant TP increased, the drug release markedly increased as well.
3.5.4.6. Complexation Formation of Optimized Formulation. Optimized formulations were also applied to drug release studies. The results showed that the rate and extent of drug release form PLX-based formulation was comparatively better than β-CD-based optimized formulation. It was also observed that the drug release of f1 β-CD-OPT was 60%, while the drug release of f1 PLX-OPT was 80%.
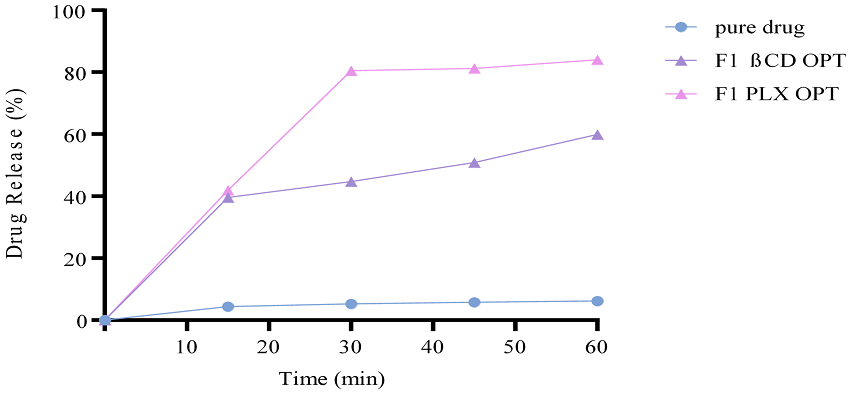
Figure 14. In Vitro Drug Release Studies of TCG from Optimized Formulations
The drug release pattern of formulations formed using complexation was in order of PLX> PEG> β-CD. Drug release of formulations having co-surfactant (TP) along with PLX in them had drug release up to 99%. However, with β-CD, drug release increased up to 118% (Figure 14). The increase in drug release was significant in comparison with the increase in solubility enhancer (PLX and β-CD) and co-surfactant (TP). The drug release of optimized formulation also increased with PLX as compared to β-CD.
3.5.5. Similarity and Dissimilarity Factors of Formulations. The similarity and dissimilarity factors of formulations are shown below in tables
Table 7. Dissimilarity and Similarity Factors of Test Formulations of β-CD and TCG with Reference Formulation
|
Formulation |
β-CD Based Formulation |
PLX Based Formulation |
||
|
f1 |
f2 |
f1 |
f2 |
|
|
f1 |
9 |
57 |
10 |
57 |
|
f2 |
10 |
55 |
9 |
55 |
|
f3 |
10 |
57 |
10 |
57 |
|
f4 |
9 |
53 |
10 |
53 |
|
f5 |
9 |
54 |
9 |
64 |
|
f6 |
8 |
55 |
9 |
55 |
|
f7 |
10 |
57 |
8 |
57 |
|
f8 |
7 |
56 |
10 |
56 |
|
f9 |
7 |
56 |
7 |
56 |
The similarity and dissimilarity factors were estimated for all formulations. The results of dissimilarity factor F1 (Limit 0-15) and similarity factor F2 (Limit 50-100) were in range for all the formulations which implies that they were comparatively significant.
3.5.6. Drug Release Kinetics. The results obtained from in vitro drug release were further evaluated for different kinetic models which included zero, first, Higuchi, Korsmeyer, and Hixson-Crowell models.
Table 8. R2 and Other Kinetic Models of Formulations containing β-CD, Transcutol-P, and the Drug
|
Formulation |
Higuchi Model |
Hixson-Crowell Model |
Zero Order |
First Order |
Korsmeyer- Peppas Model |
||||||
|
R2 |
Kh |
R2 |
KHC |
R2 |
K0 |
R2 |
K1 |
R2 |
Kkp |
n |
|
|
F1 |
0.74 |
0.50 |
0.90 |
0.00 |
0.85 |
0.15 |
0.97 |
0.01 |
0.19 |
0.33 |
0.03 |
|
F2 |
0.69 |
0.41 |
0.89 |
0.00 |
0.86 |
0.16 |
0.95 |
0.01 |
0.19 |
0.11 |
0.09 |
|
F3 |
0.68 |
0.35 |
0.86 |
0.00 |
0.83 |
0.15 |
0.90 |
0.01 |
0.19 |
0.31 |
0.14 |
|
F4 |
0.73 |
0.35 |
0.90 |
0.00 |
0.85 |
0.15 |
0.97 |
0.01 |
0.20 |
0.28 |
0.01 |
|
F5 |
0.64 |
0.35 |
0.83 |
0.00 |
0.80 |
0.14 |
0.90 |
0.01 |
0.20 |
0.04 |
0.03 |
|
F6 |
0.76 |
0.17 |
0.94 |
0.00 |
0.90 |
0.16 |
0.98 |
0.01 |
0.20 |
0.37 |
0.02 |
|
F7 |
0.74 |
0.34 |
0.94 |
0.00 |
0.92 |
0.20 |
0.97 |
0.01 |
0.20 |
0.22 |
0.09 |
|
F8 |
0.74 |
0.35 |
0.90 |
0.00 |
0.86 |
0.15 |
0.97 |
0.01 |
0.20 |
0.33 |
0.03 |
|
F9 |
0.71 |
0.18 |
0.92 |
0.00 |
0.90 |
0.17 |
0.94 |
0.01 |
0.20 |
0.19 |
0.05 |
|
F10 |
0.72 |
0.18 |
0.93 |
0.00 |
0.91 |
0.18 |
0.97 |
0.01 |
0.20 |
0.16 |
0.03 |
Table 9. R2 and Other Kinetic Models of Formulations Containing β-CD, Transcutol-P, and the Drug
|
Formulation |
Hixson-Crowell Model |
Higuchi Model |
Zero Order |
First Order |
Korsmeyer- Peppas Model |
|||||||
|
R2 |
R2 |
Kh |
KHC |
R2 |
K0 |
R2 |
K1 |
R2 |
Kkp |
n |
||
|
F1 |
0.91 |
0.92 |
0.00 |
0.00 |
0.90 |
0.00 |
0.97 |
0.00 |
0.92 |
0.18 |
0.01 |
|
|
F2 |
0.96 |
0.93 |
0.00 |
0.00 |
0.91 |
0.00 |
0.95 |
0.00 |
0.93 |
0.18 |
0.01 |
|
|
F3 |
0.86 |
0.92 |
0.00 |
0.00 |
0.92 |
0.00 |
0.96 |
0.00 |
0.92 |
0.18 |
0.01 |
|
|
F4 |
0.90 |
0.93 |
0.00 |
0.00 |
0.92 |
0.00 |
0.97 |
0.00 |
0.93 |
0.19 |
0.01 |
|
|
F5 |
0.83 |
0.89 |
0.00 |
0.00 |
0.89 |
0.00 |
0.91 |
0.00 |
0.90 |
0.19 |
0.01 |
|
|
F6 |
0.94 |
0.96 |
0.00 |
0.00 |
0.90 |
0.00 |
0.98 |
0.00 |
0.96 |
0.19 |
0.00 |
|
|
F7 |
0.92 |
0.92 |
0.00 |
0.00 |
0.91 |
0.00 |
0.94 |
0.00 |
0.92 |
0.18 |
0.01 |
|
|
F8 |
0.90 |
0.90 |
0.00 |
0.00 |
0.92 |
0.00 |
0.97 |
0.00 |
0.89 |
0.19 |
0.00 |
|
|
F9 |
0.92 |
0.92 |
0.00 |
0.00 |
0.89 |
0.00 |
0.95 |
0.00 |
0.92 |
0.19 |
0.00 |
|
|
F10 |
0.91 |
0.96 |
0.00 |
0.00 |
0.89 |
0.00 |
0.97 |
0.00 |
0.96 |
0.19 |
0.00 |
|
The results confirmed that the formulations developed by using β-CD/TCG and PLX/TCG have higher R2 and first-order model values, which showed that the drug release is dependent on its concentration. Moreover, the value of n for both types of formulations was less than 0.5, which signifies that the release of drug follows the Fickian diffusion.
3.5.7. Mathematical Modeling. Mathematical modeling generated using the design expert model both for calculated response and variables is as follows:
Y= Xo + X1 + X2 + X1X2 + X12 + X22
(Response 1)
Phase solubility (mg/ml) of PLX= 1.55 + 0.3623 + 0.0100 - 0.0300 + 0.2038 - 0.0512
From polynomial equation, contour, and 3D graph, it can be shown that the overall response is productive. The positive values of X1 and X2 suggest that both these variables enhance the response (solubility).
(Response 2)
In vitro release (%) of PLX= 79 + 31.27 + 2.25 + 1.28 - 0.1938 - 2.6
From the polynomial equation, graphs of drug release, contour, and 3D, it can be perceived that the whole response is positive. The positive values of X1 and X2 recommend that both variables improve the drug release.
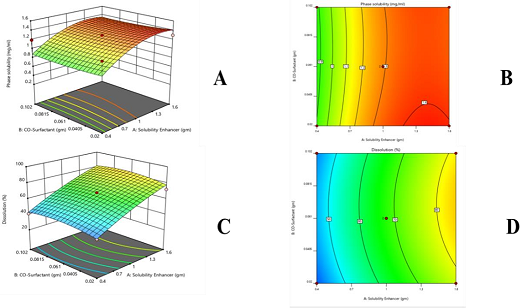
Figure 15. (A) 3D Graph of Phase Solubility (mg/ml) of PLX, (B) Contour Graph of Phase Solubility (mg/ml) of PLX, (C) 3D graph of Dissolution (%) of PLX, (D) Contour Graph of Dissolution (%) of PLX
(Response 1)
Phase solubility (mg/ml) of β-CD = 1.29 + 0.2410 - 0.0231 - 0.0090 - 0.1819 + 0.0261
From the graphs including contour and 3D graphs and polynomial equations, it can be observed that the whole response is productive. The positive values of X1 and X2 show that both variables increase the response (solubility).
(Response 2)
In vitro release (%) of β-CD = 67.75 + 18.91 + 1.61 + 0.2500 - 3.06 - 4.06
From the polynomial equation and graphs of drug release including contour and 3D, it is concluded that the whole response is positive. The positive values of X1 and X2 obtained by applying ANOVA indicate that both variables enhance the drug release.
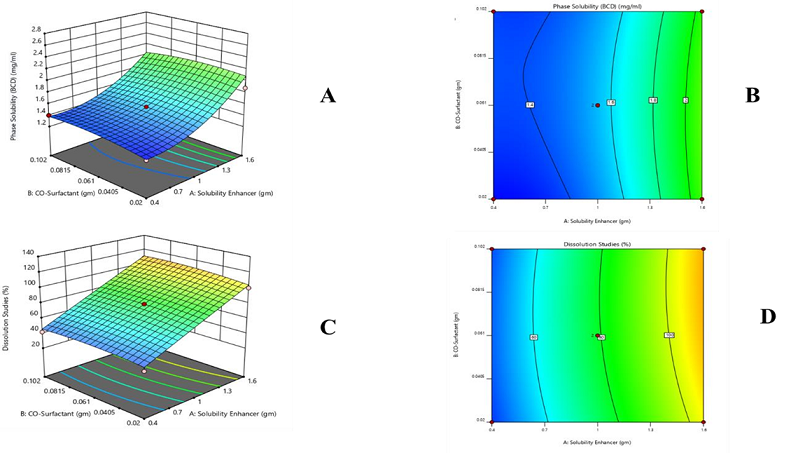
Figure 16. (A) 3D Graph of Phase Solubility (mg/ml) of β-CD, (B) Contour Graph of Phase Solubility (mg/ml) of β-CD, (C) 3D Graph of Dissolution (%) of β-CD, (D) Contour Graph of Dissolution (%) of β-CD
3.5.8. ANOVA. ANOVA was applied and significance was evaluated.
Table 10. Analysis of Variance for Phase Solubility of β-CD
|
Terms |
Degree of Freedom |
F-Value |
P-Value |
Significance |
|
Model |
5 |
7.41 |
0.0376 |
Yes |
|
X1 |
1 |
28.77 |
0.0058 |
No |
|
X2 |
1 |
0.0220 |
0.8892 |
No |
|
X1X2 |
1 |
0.0986 |
0.7692 |
No |
|
X12 |
1 |
5.20 |
0.0848 |
No |
|
X22 |
1 |
0.3290 |
0.5970 |
No |
The applied model was found significant.
Table 11. Analysis of Variance for Dissolution of β-CD
|
Terms |
Degree of Freedom |
F-Value |
P-Value |
Significance |
|
Model |
5 |
50.68 |
0.0010 |
Yes |
|
X1 |
1 |
250.68 |
< 0.0001 |
Yes |
|
X2 |
1 |
1.29 |
0.3188 |
No |
|
X1X2 |
1 |
0.2084 |
0.6717 |
No |
|
X12 |
1 |
0.0055 |
0.9444 |
No |
|
X22 |
1 |
1.06 |
0.3607 |
Yes |
The applied model was found non-significant.
Table 12. Analysis of Variance for Phase Solubility of PLX
|
Terms |
Degree of Freedom |
F-Value |
P-Value |
Significance |
|
Model |
5 |
1.35 |
0.3976 |
No |
|
X1 |
1 |
4.60 |
0.0986 |
No |
|
X2 |
1 |
0.042 |
0.8473 |
No |
|
X1X2 |
1 |
0.0032 |
0.9576 |
No |
|
X12 |
1 |
1.50 |
0.2884 |
No |
|
X22 |
1 |
0.0309 |
0.8691 |
No |
The applied model was found significant.
Variance studies using ANOVA following the quadratic model were found to be significant for the phase solubility of PLX and β-CD, as well as for the dissolution of PLX. The 3D and contour graphs from bottom to top proved that the increasing concentration of solubility enhancer and co-surfactant resulted in increased solubility and drug release.
3.6. Conclusion
From the current study, various conclusions can be drawn. Firstly, the solubility of TCG does not depend on pH. Secondly, PLX is mainly responsible for enhancing the solubility of TCG. Thirdly and lastly, solid dispersion has a more noticeable effect on the solubility of drug after co-solvation. /Furthermore, it can be speculated that for the development of and other pharmaceutical procedures including different variables, statistical modeling can be a more effective approach than the hit and trial method.
Conflict of Interest
The author of the manuscript has no financial or non-financial conflict of interest in the subject matter or materials discussed in this manuscript.
Data Availability Statement
The data associated with this study will be provided by the corresponding author upon request.
Funding details
This research did not receive grant from any funding source or agency.
Bibliography
- Markovic M, Zur M, Ragatsky I, Cvijić S, Dahan A. BCS class IV oral drugs and absorption windows: regional-dependent intestinal permeability of furosemide. Pharmaceutics. 2020;12(12):e1175. https://doi.org/10.3390/pharmaceutics12121175
- Aziz A, Zaman M, Khan MA, et al. Preparation and evaluation of a self-emulsifying drug delivery system for improving the solubility and permeability of ticagrelor. ACS Omega. 2024;9(9):10522–10538. https://doi.org/10.1021/acsomega.3c08700
- Jansook P, Ogawa N, Loftsson T. Cyclodextrins: structure, physicochemical properties and pharmaceutical applications. Int J Pharmaceutics. 2018;535(1-2):272–284. https://doi.org/10.1016/j.ijpharm.2017.11.018
- Bayoumi AA. Enhancement of solubility of a poorly soluble antiplatelet aggregation drug by cogrinding technique. Asian J Pharm Clin Res. 2018;11(10):340–344.
- Stella V, Borchardt R, Hageman M, Oliyai R, Maag H, Tilley J, eds. Prodrugs: Challenges and Rewards. Springer Science & Business Media; 2007.
- Murtaza G. Solubility enhancement of simvastatin: a review. Acta Pol Pharm. 2012;69(4):581–590.
- Mehran R, Baber U, Sharma SK, et al. Ticagrelor with or without aspirin in high-risk patients after PCI. New Eng J Med. 2019;381(21):2032–2042. https://doi.org/10.1056/NEJMoa1908419
- Saokham P, Muankaew C, Jansook P, Loftsson T. Solubility of cyclodextrins and drug/cyclodextrin complexes. Molecules. 2018;23(5):e1161. https://doi.org/10.3390/molecules23051161
- Yuan D, Zhang C, Tang S, et al. Fe3+-sulfite complexation enhanced persulfate Fenton-like process for antibiotic degradation based on response surface optimization. Sci Total Environ. 2020;727:e138773. https://doi.org/10.1016/j.scitotenv.2020.138773
- Kim M, Sahu A, Kim GB, et al. Comparison of in vivo targeting ability between cRGD and collagen-targeting peptide conjugated nano-carriers for atherosclerosis. J Control Release. 2018;269:337–346. https://doi.org/10.1016/j.jconrel.2017.11.033
- Samadi A, Hasanzadeh R, Azdast T, Abdollahi H, Zarrintaj P, Saeb MR. Piezoelectric performance of microcellular polypropylene foams fabricated using foam injection molding as a potential scaffold for bone tissue engineering. J Macromol Sci. 2020;59(6):376–389. https://doi.org/10.1080/00222348.2020.1730573
- Shaikh A, Bhide P, Nachinolkar R. Solubility enhancement of celecoxib by solid dispersion technique and incorporation into topical gel. Asian J Pharm Clin Res. 2019;12:294–300.
- Shi H, Xie Y, Xu J, Zhu J, Wang C, Wang H. Solubility enhancement, solvent effect and thermodynamic analysis of pazopanib in co-solvent mixtures. J Chem Thermodyn. 2021;155:e106343. https://doi.org/10.1016/j.jct.2020.106343
- Rajabzadeh P, Ghanbarpour P, Rahimpour E, et al. Non-Electrostatic energies as a metric for prediction of deferasirox solubility in binary solvent mixtures: polarized continuum model tactic. J Mol Liq. 2021;339:e115791. https://doi.org/10.1016/j.molliq.2021.115791
- Mukherji D, Marques CM, Kremer K. Collapse in two good solvents, swelling in two poor solvents: defying the laws of polymer solubility? J Phys Condens Matter. 2017;30(2):e024002. https://doi.org/10.1088/1361-648X/aa9c77
- Wallat JD, Harrison JK, Pokorski JK. pH responsive doxorubicin delivery by fluorous polymers for cancer treatment. Mol Pharmaceutics. 2018;15(8):2954–2962. https://doi.org/10.1021/acs.molpharmaceut.7b01046
- Ding L, Jiang Y, Zhang J, Klok H-A, Zhong Z. pH-sensitive coiled-coil peptide-cross-linked hyaluronic acid nanogels: synthesis and targeted intracellular protein delivery to CD44 positive cancer cells. Biomacromolecules. 2018;19(2):555–562. https://doi.org/10.1021/acs.biomac.7b01664
- Rinaki E, Valsami G, Macheras P. Quantitative biopharmaceutics classification system: the central role of dose/solubility ratio. Pharm Res. 2003;20:1917–1925. https://doi.org/10.1023/B:PHAM.0000008037.57884.11
- Mircioiu C, Voicu V, Anuta V, et al. Mathematical modeling of release kinetics from supramolecular drug delivery systems. Pharmaceutics. 2019;11(3):e140. https://doi.org/10.3390/pharmaceutics11030140
- Nayak AK, Panigrahi PP. Solubility enhancement of etoricoxib by cosolvency approach. ISRN Phys Chem. 2012;2012(1):e820653. https://doi.org/10.5402/2012/820653
- Muller R, Bohm B, Grau J, Wise D. Nanosuspensions: a formulation approach for poorly soluble and poorly bioavailable drugs. In: Wise DL, ed. Handbook of Pharmaceutical Controlled Release Technology. CRC Press; 2000:345–357.
- Wang X, Luo Z, Xiao Z. Preparation, characterization, and thermal stability of β-cyclodextrin/soybean lecithin inclusion complex. Carbohydr Polym. 2014;101:1027–1032. https://doi.org/10.1016/j.carbpol.2013.10.042
- Zheng Y, Eli W, Li G. FTIR study of Tween80/1-butyl-3-methylimidazolium hexafluorophosphate/toluene microemulsions. Colloid Polym Sci. 2009;287:871–876. https://doi.org/10.1007/s00396-009-2044-x
- Newa M, Bhandari KH, Li DX, et al. Preparation, characterization and in vivo evaluation of ibuprofen binary solid dispersions with poloxamer 188. Int J Pharmaceutics. 2007;343(1-2):228–237. https://doi.org/10.1016/j.ijpharm.2007.05.031
- Benyacoub A, Skender A, Boutemak K, Hadj-Ziane-Zafour A. Inclusion complexes of Melia azedarach L. seed oil/β-cyclodextrin polymer: preparation and characterization. Chem Zvesti. 2019;73:525–534. https://doi.org/10.1007/s11696-018-0600-x
- Htun WW, Steinhubl SR. Ticagrelor: the first novel reversible P2Y12 inhibitor. Expert Opin Pharmacother. 2013;14(2):237–245. https://doi.org/10.1517/14656566.2013.757303
- Dangas G, Baber U, Sharma S, et al. Ticagrelor with or without aspirin after complex PCI. J Am Coll Cardiol. 2020;75(19):2414–2424.
- Na Y-G, Byeon J-J, Kim M-K, et al. Pharmacokinetic/pharmacodynamic modeling to predict the antiplatelet effect of the ticagrelor-loaded self-microemulsifying drug delivery system in rats. Mol Pharm. 2020;17(4):1079–1089. https://doi.org/10.1021/acs.molpharmaceut.9b00964
- Liu J, Liu Q, Yang C, et al. cRGD-modified benzimidazole-based pH-responsive nanoparticles for enhanced tumor targeted doxorubicin delivery. ACS Appl Mater Interfaces. 2016;8(17):10726–10736. https://doi.org/10.1021/acsami.6b01501
- Henriksson R, Björklund F, Mooe T. The introduction of ticagrelor is associated with lower rates of recurrent ischemic stroke after myocardial infarction. PLoS One. 2019;14(5):e0216404. https://doi.org/10.1371/journal.pone.0216404
- Mohammed IA, Ghareeb MM. Investigation of solubility enhancement approaches of ticagrelor. Iraqi J Pharm Sci. 2018;27(1):8–19. http://dx.doi.org/10.31351/vol27iss1pp8-19
- Zhou X, Xu L, Xu J, et al. Construction of a high-efficiency drug and gene co-delivery system for cancer therapy from a pH-sensitive supramolecular inclusion between oligoethylenimine-graft-β-cyclodextrin and hyperbranched polyglycerol derivative. ACS Appl Mater Interfaces. 2018;10(42):35812–35829. https://doi.org/10.1021/acsami.8b14517
- Zhang X, Huang Y, Ghazwani M, et al. Tunable pH-responsive polymeric micelle for cancer treatment. ACS Macro Lett. 2015;4(6):620–623. https://doi.org/10.1021/acsmacrolett.5b00165
- Hu Q-D, Tang G-P, Chu PK. Cyclodextrin-based host–guest supramolecular nanoparticles for delivery: from design to applications. Acc Chem Res. 2014;47(7):2017–2025. https://doi.org/10.1021/ar500055s
- Coughlan J, Aytekin A, Ndrepepa G, et al. Ticagrelor or prasugrel in patients with acute coronary syndrome undergoing complex percutaneous coronary intervention. Circ Cardiovasc Interv. 2021;14(7):e010565. https://doi.org/10.1161/CIRCINTERVENTIONS.121.010565