
| Review | Open Access |
|---|
Validation of an RP-HPLC Method to Determine Rupatadine as a Fumarate in Pharmaceutical Dosage Form |
 |
|---|
![]() Qazi Amir Ijaz1* , Mohammad Ibrahim2, Yasir Mehmood2, Bilal Khalid2, Muhammad Affan3, and Naila Abdul Sattar4
Qazi Amir Ijaz1* , Mohammad Ibrahim2, Yasir Mehmood2, Bilal Khalid2, Muhammad Affan3, and Naila Abdul Sattar4
1Department of Pharmacy, Mirpur University of Science and Technology, Mirpur, Pakistan
2Riphah Institute of Pharmaceutical Sciences (RIPS), Riphah International University Faisalabad, Faisalabad, Pakistan
3Saffron Pharmaceutical PVT LTD, Faisalabad, Pakistan
4Government College Women University, Faisalabad, Pakistan
Rupatadine (RUP) is a second generation antihistamine drug and an agonist of platelets activating factor. Literature does not report any specific method for the determination of RUP. Therefore, a Reverse Phase High Performance Liquid Chromatography (RP-HPLC) method was developed in this research for the quantitative determination of RUP in pharmaceutical dosage form. For this purpose, a mixture of monosodium phosphate buffer and acetonitrile 80:20 v/v was used as mobile phase, flowing at a rate of 1.0 ml/min. A well-characterized reference material of RUP with a potency of 99.68% (as is basis) was used throughout the study. RUP for system suitability chemical related substances (CRS) (containing impurities A and B) was also used in this study for the identification of fumaric acid, impurity A, impurity B, and RUP in the pharmaceutical dosage form. Method validation was performed by the preliminary analysis of the standard sample and by performing recovery studies. The method was found to be linear with regression line y = 95464x -6164, having correlation 1.0000, in the range of 17.04-85.20 µg/ml. Moreover, percentage recovery of RUP was found to be in the range of 99.08 to 100.25. The limit of detection (LOD) was found to be 0.63 µg/ml and the limit of quantification (LOQ) was found to be 1.91µg/ml. It can be inferred from the obtained results that the developed method is simple, linear, precise, accurate, and robust. Therefore, it can be employed for the quantitative determination of RUP in the pharmaceutical dosage form.
1. INTRODUCTION
Rupatadine (benzocycloheptapyridine) is widely known as the safest and the most effective drug against a variety of allergic problems [1, 2]. The reported side effects include general fatigue, accompanied with headaches [3]. Canadian Drug Authority was the first organization to approve its marketing in tablet form [4]. Rupatadine or RUP is a non-sedative antihistamine drug with prolonged action on peripheral H1 receptor. It inhibits the degranulation of the mast cells [5], as well as the release of cytokines [6], and especially the TNF ( tumor necrosis factors) of human monocytes and mast cells [7]. The byproducts of RUP in vivo are 3-hydroxydesloratadine, desloratadine, 5-hydroxydesloratadine, and 6-hydroxydesloratadine. RUP is commercialized under the brand name Rupasaf (10 mg tablets). It is recommended for the symptomatic cure of rhinitis (allergic) and urticaria, both in adults and in individuals over 12 years of age [8, 9]. The maximum daily dose of RUP is 10 mg.
Very few methods have been reported in the literature for the determination of RUP by using RP-HPLC [10]. Nogueira et al. reported the use of micellar electrokinetic chromatography technique for RUP assay [11]. Some titration and spectrophotometric methods have been reported as well [12–14]. Most of the official literature does not document any quantitative method for RUP in tablet dosage form, but a liquid chromatographic method was described by the European Pharmacopoeia for related substances of RUP [15]. After some amendments, this method was applied for the quantitative determination of RUP in solid oral dosage form (Tablet). The ICH guideline Q2R1 requires that the test method used for assessing product compliance with established specifications should meet the appropriate standards of method validation [16]. Therefore, this study aimed to develop a simple and precise method to determine RUP in solid dosage form. The developed method was validated for specificity, force degradation, linearity, range, LOD, LOQ, system suitability, accuracy, precision, solution stability, and robustness under actual conditions of use [17].
2. MATERIALS AND METHODS
2.1. MaterialsA well-characterized reference material of RUP fumarate with documented evidence having Batch # BRPFA/1911009 with potency 99.68% was gifted by the Panacea Biotec Ltd, India. RUP for system suitability CRS (containing impurities A and B) was also used in this study for the identification of fumaric acid, impurity A, impurity B, and RUP. PVP-K30, Avicel 102, starch-1500, magnesium stearate, lactose monohydrate, iron oxide, sodium hydroxide, and hydrochloric acid were purchased from Sigma Aldrich, USA. Monosodium phosphate (NaH2PO4) and acetonitrile were purchased from PanReac ITW-Germany.
2.2. InstrumentationThe analysis was carried out on Shimadzu HPLC-04 equipped with quaternary pump LC-2AT, detector SPD-M20A DIODE array, auto-sampler SIL-20ACHT, oven CTO-20AC, and degasser DGU-20A5R. A mixture of NaH2PO4 buffer solution and acetonitrile (60:40) was used as mobile phase. The above mixture was filtered and degassed before use. The flow rate of mobile phase was established at 1 ml/min, while the column temperature was maintained at 35ºC. The injection volume was standardized at 20 µl. Optimal separation was attained by utilizing a C18 (4.6 mm x 150-mm; 5 µm) column, with a wavelength of 210 nm identified as the optimum wavelength for the determination of RUP.
2.3. Preparation of SolutionsFollowing solutions were prepared for the analytical method.
2.3.1 Buffer Preparation. For buffer preparation (pH 6), 7.0 g of NaH2PO4 was dissolved in 1 liter of purified water.
2.3.2 Reference Solution Preparation. About 32.0 mg of RUP working standard, equivalent to about 25.0 mg of RUP, was dissolved in the diluent (buffer: acetonitrile., 80:20) in a volumetric flask (50 ml). Then, 5 ml of this solution was withdrawn and diluted to 50 ml with the diluent to obtain the final concentration of 50.0 µg/ml RUP.
2.3.3. Sample Solution Preparation. A total of 20 tablets were crushed and powder corresponding to 25.0 mg of drug was dissolved in the diluent in a 50 ml flask. Then, 5.0 ml of this solution was withdrawn and diluted with the diluent to attain 50.0 µg/ml of the final concentration.
2.3.4. Placebo Preparation. For placebo preparation, 41.38 g of lactose monohydrate, 1.5 g of starch-1500, and 0.113 g of iron oxide were mixed and passed through a sieve of mesh size # 40. Then, 1.875 g of PVPK-30 was dissolved in distilled water (10 ml) to prepare the binder solution, which was poured on the above premixed material and the mixture was passed through sieve # 06. After drying, 18.563 g of Avicel-102 and 1.5 g of starch-1500 were added to the above mixture, which was passed through sieve# 30 and manually mixed for 20 minutes. Afterwards, 0.563 g of magnesium stearate was added to the above mixture and manually mixed for 5 minutes.
2.4. Force Degradation StudyIn order to ensure the specificity and stability of the proposed method, stress studies were performed [18]. Acid hydrolysis and base hydrolysis were carried out in the presence of 0.15 N hydrochloric acid (HCl) and 0.15 N sodium hydroxide (NaOH) at 70oC for 24 h, respectively. Other stress studies included oxidation stress (5% H2O2 at 70oC for 4 h), thermal stress (60oC for 24 h in a closed container), and photolytic stress (1.2x10⁶ lux hour/200 watt hours, square meter) [19]. Photo effect was studied in three segments, that is, sample directly exposed to light, in primary packaging, and in secondary packaging [19].
2.5. System SuitabilitySystem suitability parameters, such as retention time (RT), theoretical plates (N), peak resolution (R), tailing factor (AS), and repeatability were assessed using 5 replicate injections of RUP at a concentration of 50 µg/ml.
2.6. Validation of Method Performance CharacteristicsMethod validation was performed in accordance with the ICH Q2(R1) guidelines. The parameters included linearity and range, limit of detection, limit of quantification, precision, accuracy, and specificity.
2.6.1. Linearity and Range. A five-point calibration curve was established to determine linearity and range using a stock solution prepared by dissolving 27.0 mg of RUP and diluted to 50 ml with the diluent to achieve a drug concentration of 422 µg/ml [20]. Then, 5 linear dilutions of the drug were prepared, including 17.04 µg/ml, 34.08 µg/ml, 51.12 µg/ml, 68.16 µg/ml, and 85.20 µg/ml.
2.6.2. Limit of Detection (LOD) and Limit of Quantification (LOQ). The standard deviation of the response and the slope of the calibration curve were calculated through the regression line [21]. For this purpose, the previously prepared dilutions were run on liquid chromatographic system under defined chromatographic conditions. The data was reviewed statistically and LOD was calculated by using the following expression:
LOD = 3.3σ/S
where ‘σ’ is the residual standard deviation and ‘S’ is the slope of the corresponding calibration curve. Both parameters were calculated through the regression line. The prepared dilutions were run on the LC system under previously defined chromatographic conditions. The data was reviewed statistically and LOQ was calculated by using the following expression:
LOQ =10σ/S
2.6.3. Precision. Precision study was conducted according to ICH guidelines by assessing method repeatability and intermediate precision.
2.6.3.1. Repeatability. To analyze repeatability, 6 samples were prepared at 100% of the test concentration for both sample and reference solutions.
2.6.3.2. Intermediate Precision. Intermediate precision was studied by performing the same analysis on the same day using the same instrument by different analysts, on the same day by the same analyst but using a different instrument, and by using the same instrument and on the same day by a different analyst [22]. The assay of all samples was determined and % relative standard deviation (coefficient of variation) was calculated.
2.6.4. Accuracy. The determination of accuracy involved assessing the % assay of the drug in the sample by using the spiking method on three different concentrations, that is, 80%, 100%, and 120%. For 100% concentration sample, 218 mg placebo was placed in the 50 ml volumetric flask. It was spiked by 32 mg of RUP (equivalent to about 25.0 mg RUP as fumarate), vortex mixed and sonicated until complete dissolution and the desired volume was achieved by adding the diluent. After the filtration of the above solution, 5 ml of the filtrate was diluted to make it 50 ml in order to prepare 50 µg/ml concentration. Similarly, samples were prepared for 80% and 120% concentration by changing the relative volume of placebo and RUP. A reference solution containing 50.0 µg/ml of drug was also run in parallel.
2.6.5. Robustness. Robustness was evaluated by applying small deliberate variations in chromatographic conditions [23]. To demonstrate the robustness of the method for RUP, sample solution was prepared as defined in “method description” and injected in the LC system by deliberately changing the conditions.
2.6.6. Solution Stability. Both standard and sample solutions were injected into the LC system and the peak areas were observed at 0 h, 24 h/8-15ºC, and 24 h/30ºC to check the stability of RUP in solution state.
2.6.7. Specificity. The specificity of the devised method was evaluated by observing the interference of excipients and the drug. A sample of “RUP for system suitability CRS (containing impurities a and b)” was studied for the identification of fumaric acid and RUP. In order to prepare a solution, 3.0 mg of RUP CRS (containing impurities a and b) was dissolved in the diluent to increase the final volume up to 5 ml.
3. RESULTS AND DISCUSSION
The validation of the analytical method is an important step in the quantification of a drug product. The current method includes several validation parameters of an RP-HPLC method for the quantification of RUP as fumarate in tablet dosage form.
3.1. SpecificityThe peak purity of RUP was analyzed to obtain satisfactory results under stress conditions. Individual and combined chromatograms of diluent, mobile phase, placebo, RUP, and RUP with placebo were studied, as shown in Figure 1. It was observed that the placebo showed no interference in the retention time of the RUP peak. Few peaks appeared due to the solvent but the concerned peak of RUP showed good resolution. For the identification of fumaric acid and RUP, RUP system suitability CRS (containing impurities A and B) was also performed and the elution was compared with the elution order described in European Pharmacopoeia under “Related Substances Test,” that is, firstly fumaric acid and then RUP was eluted. So, from this comparison, it was confirmed that the peak at the retention time of 1.329 minute was of fumaric acid and at 5.763 minutes was of RUP.
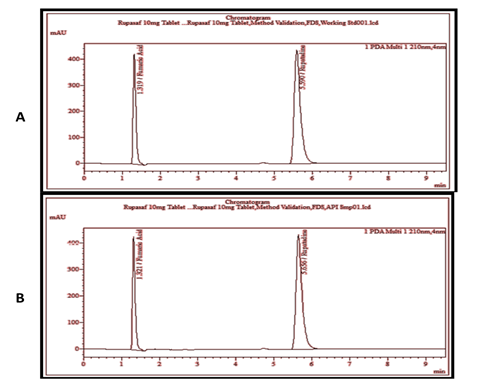
Figure 1. Chromatogram of Reference Solution (A) and RUP Sample Solution (Unstressed) (B)
3.2. Force Degradation Study3.2.1. Acid Hydrolysis. From the results (Figure 2 and Table 1), it was found that the pure drug and drug in sample showed no significant chemical interference with 0.15 N HCl, after storing for 08 h and 24 h at room temperature, respectively.
3.2.2. Alkaline Hydrolysis. It was revealed from the results (Figure 2 and Table 1) that chemical configuration of pure drug and drug in sample was not affected by 0.15 N NAOH after 08 h and 24 h of the incubation of both solutions at room temperature, respectively.
3.2.3. Oxidation Stress. Both HPLC chromatograms from Figure 2 and the results in Table 1 showed significant degradation of the drug. It was observed that the addition of 5 ml of 5% H2O2 resulted in 6.91% and 7.84% degradation, of pure drug and drug in sample respectively, after 08 h incubation at room temperature. While, an incubation period of 24 h at the same temperature resulted in 13.96% and 14.76% degradation of pure drug and drug in sample, respectively. Such degradation was confirmed on the chromatogram by the appearance of a single extra peak at 1.486RT, other than the concerning peak at 5.651RT. Thus, it can be inferred from the results that the concerning peak did not show any interference with the degraded peak. Similar behavior was observed previously by Amer et al [24].
3.2.4. Thermal Stress. It was revealed from the results (Figure 2 and Table 1) that thermal stress has no significant effect on the chemical stability of pure drug and drug in sample. More precisely, the percentage recovery of both reference and sample remain the same as the percentage recovery of unstressed reference and sample, after keeping them in oven at 60°C for 08 h and 24 h, respectively.
3.2.5. Photolytic Stress. The existing results of photolytic stress indicated that the drug showed more sensitivity towards light, as compared to primary and secondary packs, on direct exposure. Such minimum quantitative difference is not considered to be significant, thus both the standard drug and the sample remained chemically stable against photolytic stress.
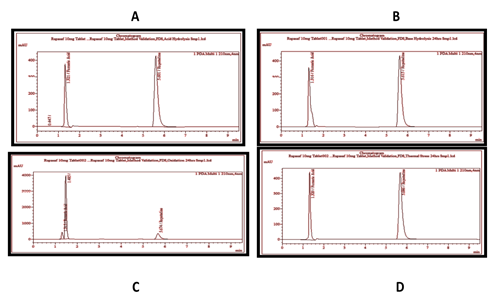
Figure 2. Chromatograms of Sample Solution Under Stressed 5 ml of 0.15 N HCl (A), 5 ml of 0.15 N NaOH (B), and 5 ml of 3% H2O2 for (C), After Keeping Them for 24 h at 60°C in an Oven (D).
Table 1. Stress Studies
|
Type of Sample |
Stress Condition |
%Assay |
Degradation (%) |
|---|---|---|---|
|
API |
NIL |
99.67 |
|
|
Sample (unstressed) |
NIL |
98.83 |
|
|
Sample |
5 mL of 0.15N HCl for 24 h at 25 oC |
99.31 |
0.85 |
|
Sample |
5mL of 0.15N NaOH for 24 h at 25 oC |
99.67 |
1.21 |
|
Sample |
5mL of 5% H2O2 for 24 h at 25 oC |
83.70 |
14.76 |
|
Sample |
At 60°C in oven for 24 h |
100.38 |
1.92 |
|
Sample (Directly exposed) |
1.2x10⁶ lux hour in photo stability chamber |
94.03 |
1.98 |
|
Sample (Primary packing) |
1.2x10⁶ lux hour in photo stability chamber |
94.36 |
1.65 |
|
Sample (Secondary packing) |
1.2x10⁶ lux hour in photo stability chamber |
94.71 |
1.30 |
3.3. Validation of Method Performance Characteristics
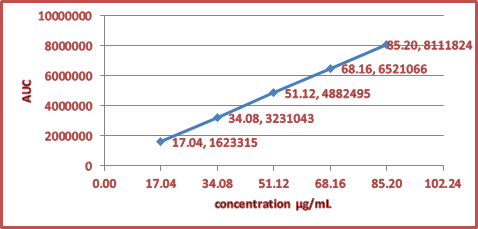
Figure 3. Linearity of RUP Fumarate
3.3.1. Linearity and Range. The response of the drug was linear, as shown in Figure 3. The linear regression equation for RUP is y = 95464x – 6164, with correlation coefficient R² = 0.998. The statistical data of the regression line is given in Table 2.
Table 2. Mean Area Values, Residual Sum of Least Squares, and Statistical Data of the Calibration Curve.
|
Conc. (µg/mL) |
Mean AUCa± (S. E) |
Residual Sum of Least Squaresb |
|---|---|---|
|
17.04 |
1623315 ± 0.16 |
1620540.04 |
|
34.08 |
3231043 ± 0.11 |
3247244.22 |
|
51.12 |
4882495 ± 0.04 |
4873948.39 |
|
68.16 |
6521066 ± 0.05 |
6500652.57 |
|
85.20 |
8111824 ± 0.01 |
8127356.74 |
Note.a Mean of three values, b Using regression equation. Intercept (b) = -6164.13, Slope (a) = 95463.86, Correlation =0.99998, n = 5
3.3.2. Limit of Detection (LOD) and Limit of Quantification (LOQ). LOD signifies the smallest quantity of drug that can be detected, while LOQ represents the smallest quantity of drug that can be quantified easily [25]. The LOD value was calculated as 0.63 µg/ml and the LOQ value was calculated as 1.91µg/ml.
3.3.3. Precision. Precision is a measure of the similarity of a method’s response to the same concentration when performed on different days and by different analysts. It is an important parameter which ensures that the method remains unaffected by changing time or person [26]. Precision study was established according to the ICH guidelines by evaluating method repeatability and intermediate precision [27]. The co-efficient of variation was observed to be 0.654, while the relative mean error was observed to be 0.267.
3.3.3.1. Repeatability. The calculated coefficient of variation (% CV) of 6 results was found to be 0.65%, which confirmed the precision of the selected method within the confined limit, that is, < 2.0%.
3.3.3.2. Intermediate Precision. The calculated F-value for different analysts, different instruments, and different days were 3.619, 1.341 and 2.678, respectively. The calculated F-values were less than the tabulated F-value (5.05) at 95% confidence level, which revealed the lack of significant difference between the precision of drugs.
3.3.4. Accuracy. The mean recovery of the drug was satisfactory, that is, ranging from 99.25% to 99.76%.
3.3.5. Robustness. The results of the robustness study revealed that the assay of the test solution remained unaffected by changing chromatographic conditions, which showed the robustness of the developed method.
3.4. System SuitabilityThe results of system suitability are presented in Table 3. The number of theoretical plates (N) was observed to be 6707.6, while the tailing factor was observed to be 1.308.
Table 3. System Suitability Parameters
| No. of Injection | Area | Retention Time (RT) | Theoretical Plate (N) | Tailing Factor (As) | Resolution (R) |
|---|---|---|---|---|---|
| 1 | 4899183 | 5.350 | 6667.000 | 1.311 | 20.211 |
| 2 | 4908722 | 5.409 | 6705.000 | 1.306 | 20.357 |
| 3 | 4880980 | 5.422 | 6680.000 | 1.308 | 20.166 |
| 4 | 4865615 | 5.424 | 6708.000 | 1.307 | 20.224 |
| 5 | 4860848 | 5.433 | 6778.000 | 1.307 | 20.367 |
| Average | 4883069.6 | 5.408 | 6707.600 | 1.308 | |
| SD | 20739.55 | 0.033 | |||
| %RSD | 0.425 | 0.619 |
Table 4. Evaluation of the Precision (Repeatability) of the Proposed Method
| Amount of Drug Added (mg) | Amount of Drug Found (mg) | Recovery (%) | Coefficient of Variation (CVa) | Relative Mean Error (RME) | Confidence Limit |
|---|---|---|---|---|---|
| 32.1 | 32.1 | 100.07 | 0.654 | 0.267 | 99.87±0.54 |
| 32.0 | 32.2 | 100.77 | |||
| 32.1 | 31.9 | 99.35 | |||
| 32.0 | 31.7 | 99.13 | |||
| 32.0 | 2108 | 99.47 | |||
| 32.1 | 32.2 | 100.43 | |||
| Mean | 32.0 | 99.87 |
Note. n = 6. b Confidence limits at 95% and five degrees of freedom
Table 5. Evaluation of the Accuracy of the Proposed Method for RUP Tablet
| Amount of Drug Added (%) | Amount of Drug Added (mg) | Amount of Drug Found (mg) | Recovery (%) | Coefficient of Variation (CV) | Relative Mean Error (RME) | Confidence Limits b |
|---|---|---|---|---|---|---|
| 80 | 25.5 | 25.3 |
99.00 99.90 99.8 |
0.4954 | 0.2860 | 99.57±0.83 |
| 80 | 25.5 | 25.5 | ||||
| 80 | 25.5 | 25.5 | ||||
| Mean | 25.5 | 25.4 | 99.57 | % RSD = 0.49 | ||
| 100 | 32.0 | 31.8 |
99.25 99.16 99.34 |
0.0907 | 0.0524 | 99.25±0.15 |
| 100 | 32.0 | 31.7 | ||||
| 100 | 32.0 | 31.8 | ||||
| Mean | 32.0 | 31.8 | 99.25 | % RSD = 0.09 | ||
| 120 | 38.1 | 38.1 |
99.94 99.08 100.25 |
0.6076 | 0.3508 | 99.76±1.02 |
| 120 | 38.1 | 37.7 | ||||
| 120 | 38.1 | 37.8 | ||||
| Mean | 38.1 | 37.9 | 99.76 | % RSD = 0.61 | ||
Note. n = 6. b Confidence limits at 95% and two degrees of freedom
3.5. Solution StabilitySolution stability studies established the stability of both reference and sample solutions for up to 48 h during assay determination.
Table 6. Stability Studies for Reference and Sample Solutions
| Weight (mg) | Area | Average | Recovery (%) | ||
|---|---|---|---|---|---|
| Ref. | 32.2 | 4909149 | 4911989 | 4910569 | |
| API 0hr | 32.1 | 4845780 | 4862414 | 4854097 | 99.16 |
| SMP 0hr | 250.2 | 4759848 | 4806316 | 4783082 | 97.69 |
| Ref. | 32.2 | 4897328 | 4885471 | 4891400 | |
| API 8-15 ºC 48hr | 32.1 | 4826218 | 4897067 | 4861643 | 99.70 |
| SMP 8-15 ºC 48hr | 250.2 | 4839345 | 4763693 | 4801519 | 98.45 |
| API 30ºC 48hr | 32.1 | 4877331 | 4858766 | 4868049 | 99.83 |
| SMP 30 ºC 48hr | 250.2 | 4800551 | 4795389 | 4797970 | 98.38 |
4. Conclusion
In this study, an isocratic RP-HPLC method was validated successfully through the quantitative analysis of RUP in pharmaceutical solid dosage form. Placebo showed no interference at the retention time of the RUP peak. System suitability was confirmed with the reasonable values of system suitability parameters. The LOD and LOQ values confirmed that the method is detectable as well as quantifiable. The mean recovery of the drug was satisfactory, ranging from 99.25% to 99.76%. The developed method demonstrated acceptable stability against most of the stressful conditions, as proved by the results of force degradation study. Therefore, it can be concluded that the developed method is linear, specific, robust, precise, and accurate. Hence, it can be used for the quantitative determination of RUP in tablets.
CONFLICT OF INTEREST
The authors of the manuscript have no financial or non-financial conflict of interest in the subject matter or materials discussed in this manuscript.
DATA AVAILABILITY STATEMENT
Data associated with this study is presented within the manuscript.
FUNDING DETAILS
This study did not receive any funding from any sources.
REFERENCES
- Brayfield A. Martindale: the complete drug reference. Pharmaceutical Press; 2017.
- Tian X, Ma W, Yusuf B, Su B, Hu J, Zhang T. Assessment of the efficacy of the antihistamine drug rupatadine used alone or in combination against mycobacteria. Pharmaceutics. 2024;16(8):1049. https://doi.org/10.3390/pharmaceutics16081049
- Alexander M, Alexander J. Rupatadine-induced nocturnal dyskinesia and paroxysmal sleep terrors in a 72-year-old male with anaphylaxis. Ann Allergy Asthma Immunol. 2024;133(6):S109. https://doi.org/10.1016/j.anai.2024.08.476
- Winnicka K. Utilization of ethylcellulose microparticles with rupatadine fumarate in designing orodispersible minitablets with taste masking effect. Materials. 2020;13(12):2715. https://doi.org/10.3390/ma13122715
- Joint Formulary Committee. BNF 78: September 2019–March 2020. BMJ Group/Pharmaceutical Press; 2019.
- Malavige GN, Wijewickrama A, Fernando S, et al. A preliminary study on efficacy of rupatadine for the treatment of acute dengue infection. Sci Rep. 2018;8:3857. https://doi.org/10.1038/s41598-018-22285-x
- Nogueira DR, D’Avila FB, Rolim CMB, Dalmora SL. Development and validation of a stability-indicating LC method for the determination of rupatadine in pharmaceutical formulations. Chromatographia. 2007;66(11-12):915–919. https://doi.org/10.1365/s10337-007-0426-0
- Olechno K, Maciejewski B, Głowacz K, et al. Orodispersible films with rupatadine fumarate enclosed in ethylcellulose microparticles as drug delivery platform with taste-masking effect. Materials. 2022;15(6):2126. https://doi.org/10.3390/ma15062126
- Ellis AK, Connors L, Francoeur MJ, Mack DP. Rupatadine to prevent local allergic reactions to sublingual allergy immunotherapy: a case series. Allergy Asthma Clin Immunol. 2021;17:125. https://doi.org/10.1186/s13223-021-00630-6
- Shirkhedkar AS, Thorve RT, Fursule RF, Surana SS. Development and validation of a stability-indicating HPTLC method for analysis of rupatadine fumarate in the bulk drug and tablet dosage form. Acta Chromatogr. 2008;20(3):423–437. https://doi.org/10.1556/achrom.20.2008.3.9
- Nogueira DR, Sangoi MS, da Silva LM, Todeschini V, Dalmora SL. Determination of rupatadine in pharmaceutical formulations by a validated stability-indicating MEKC method. J Sep Sci. 2008;31(16-17):3098–3105. https://doi.org/10.1002/jssc.200800254
- Goyal A, Sharma C, Singh G. Development of UV and visible spectrophotometric methods for estimation of rupatadine fumarate from tablet formulation. Int J Pharm Res Dev. 2010;2(4):14. https://doi.org/10.1007/s00216-009-2878-2
- Rele R, Desai P, Sawant S. Simple extractive spectrophotometric determination of rupatadine as rupatadine fumarate from pharmaceutical formulation. Int J Chem Sci. 2010;8(1):22–28. https://doi.org/10.21746/ijcs.2010.8.1.3
- Rele RV, Mahimkar SA, Sawant SA. A validated simple titrimetric method for the quantitative determination of rupatadine as rupatadine fumarate from pharmaceutical dosages. Anal Chem Indian J. 2009;8:561–564. https://doi.org/10.22453/acij.2009.8.4
- Trivedi HK, Patel MC. Development of a stability-indicating RP-HPLC method for the determination of rupatadine and its degradation products in solid oral dosage form. Sci Pharm. 2012;80(4):889–902. https://doi.org/10.3797/scipharm.1208-10
- Cai Y, Mclaughlin M, Zhang K. Advancing the FDA/office of regulatory affairs mycotoxin program: new analytical method approaches to addressing needs and challenges. J AOAC Int. 2020;103(3):705–709. https://doi.org/10.1093/jaocint/qsz007
- Guideline IHT. Q2 (R1) Validation of analytical procedures: text and methodology. In: Teasdale A, Elder D, Nims RW, editors. ICH quality guidelines: an implementation guide. John Wiley & Sons, Inc; 2005:128–166.
- Sukumar V, Chinnusamy S, Chanduluru HK, Rathinam S. Method development and validation of atorvastatin, ezetimibe and fenofibrate using RP-HPLC along with their forced degradation studies and greenness profiling. Green Chem Lett Rev. 2023;16(1):2198651. https://doi.org/10.1080/17518253.2023.2198651
- Al Bratty M, Thangavel N, Peraman R, et al. HPLC-DAD method for investigating pantoprazole for its stress-dependent degradation by photolysis and oxidation. Acta Chromatogr. 2020;32(4):247–255. https://doi.org/10.1556/1326.2019.00709
- Al-Sanea MM, Gamal M. Critical analytical review: rare and recent applications of refractive index detector in HPLC chromatographic drug analysis. Microchem J. 2022;178:107339. https://doi.org/10.1016/j.microc.2022.107339
- Abba S, Usman A, Selin I. Simulation for response surface in the HPLC optimization method development using artificial intelligence models: a data-driven approach. Chemom Intell Lab Syst. 2020;201:104007. https://doi.org/10.1016/j.chemolab.2020.104007
- Kotani A, Watanabe R, Hayashi Y, Hakamata H. Chemometric evaluations of repeatability and detection limit in high-performance liquid chromatography with electrochemical detection. J Chromatogr A. 2022;1673:463075. https://doi.org/10.1016/j.chroma.2022.463075
- Woziński M, Greber KE, Pastewska M, et al. Modification of gradient HPLC method for determination of small molecules’ affinity to human serum albumin under column safety conditions: robustness and chemometrics study. J Pharm Biomed Anal. 2024;239:115916. https://doi.org/10.1016/j.jpba.2023.115916
- Amer M, Habib AA, Hammad S, Kamal A. Review on strategies for analysis of some structurally related pharmaceutical compounds: approach to forced degradation, degradation kinetics and impurity profiling of drugs. J Adv Med Pharm Res. 2025;6(1):32–47. https://doi.org/10.21608/jampr.2025.342078.1084
- Salomone A, Di Corcia D, Negri P, et al. Targeted and untargeted detection of fentanyl analogues and their metabolites in hair by means of UHPLC-QTOF-HRMS. Anal Bioanal Chem. 2021;413:225–233. https://doi.org/10.1007/s00216-020-02994-x
- Hanif S, Syed MA, Rashid AJ, et al. Validation of a novel RP-HPLC technique for simultaneous estimation of lignocaine hydrochloride and tibezonium iodide: greenness estimation using AGREE penalties. Molecules. 2023;28(8):3418. https://doi.org/10.3390/molecules28083418
- González-González O, Ramirez IO, Ramirez BI, et al. Drug stability: ICH versus accelerated predictive stability studies. Pharmaceutics. 2022;14(11):2324. https://doi.org/10.3390/pharmaceutics14112324