
| Review | Open Access |
|---|
Pharmacognostic, Phytochemical, and DNA Protection Assays of Eclipta alba, Ageratum conyzoides, Calendula officinalis, and Conyza bonariensis |
 |
|---|
![]() Waheed Ullah Hafiz1 , Saiqa Ishtiaq2, Sabi Ur Rehman3* , Laiba Arshad3, Daud-Ur-Rehman3, and Hamid Saeed2
Waheed Ullah Hafiz1 , Saiqa Ishtiaq2, Sabi Ur Rehman3* , Laiba Arshad3, Daud-Ur-Rehman3, and Hamid Saeed2
1Department of Basic Science, Faculty of Medicine, Bayazid Rokhan Institute of Higher Education, Kabul, Afghanistan
2University College of Pharmacy, University of the Punjab, Lahore, Pakistan
3Department of Pharmacy, Forman Christian College (A Chartered University), Lahore, Pakistan
Asteraceae is the most famous family of ornamental flowering plants. Most of the plants included in this family have medicinal properties. The current research aimed to investigate the pharmacognostic and phytochemical standards of Eclipta alba L., Ageratum conyzoides L., Calendula officinalis L., and Conyza bonariensis L. to ensure their purity, safety, and efficacy as medicinal agents. The investigated parameters included pharmacognostic characterization, that is, powder microscopy, preliminary phytochemical analysis, physicochemical analysis, and in vitro DNA protection assay. The pharmacognostic characteristics evaluated via microscopy included the presence of fibers, linear covering trichomes, and glandular trichomes. Preliminary phytochemical screening confirmed the presence of different classes of phytoconstituents, such as glycosides, flavonoids, phenols, and triterpenoids. The DNA damage protection assay revealed that the crude methanolic extracts of these plants effectively protected human DNA from oxidative stress generated by free radicals of the oxidizing agent (Fenton’s reagent).
1. INTRODUCTION
Plants are medicinally important to human beings because they produce special chemical substances. Traditional medicine makes considerable use of medicinally significant plants, which are also essential for biochemical research [1]. Plant-based therapeutic chemicals are essential for both preventing and treating human illnesses. These compounds may serve as important sources for new drugs [2].
Approximately 80% of the world's population makes use of traditional medicine. Numerous investigations have demonstrated that patients suffer from serious side effects of such medicine, many of which are linked to subpar raw ingredients [3]. Consequently, to create standardized herbal products, thorough and timely research must be conducted [4]. The process of prescribing a set of standard criteria or features and conclusive qualitative and quantitative approaches that warrant the quality, safety, and efficacy of herbal medicines is known as standardization. It is an excellent technique for herbal drug quality control. Specific standards are established via observation and experimentation and a set of characteristics exhibited by herbal medicines are prescribed. Hence, standardization is an excellent tool in the quality control of herbal drugs [5].
Since dietary plant antioxidants can eliminate free radicals, several epidemiological studies have found an inverse association between the intake of herbal natural antioxidants and the prevalence of disease progression [6]. For many organisms to generate energy for regular metabolic functions, oxidation is essential. On the other hand, unchecked production of reactive oxygen species (ROS) damages tissue and can ultimately lead to death. Numerous illnesses, such as diabetes, cancer, heart disease, aging, and more, have been linked to ROS. Antioxidants can shield the body from the harm brought on by ROS [7].
The largest and the most well-known family of blooming plants is Asteraceae. There are 23,000 species and 1,600 genera in this family [8]. Numerous Asteraceae species, including polyphenols, flavonoids, glycosides, and diterpenoids, have been demonstrated to exhibit pharmacological action. The antibacterial, antifungal, anti-inflammatory, insecticidal, and anticancer qualities of the Asteraceae species have been confirmed by numerous investigations. In China, up to 300 species of the Asteraceae family are utilized as herbal remedies. For instance, Artemisia annua effectively combat malaria [9, 10]. Similarly, along with its other qualities, Saussurea involucrate has anti-inflammatory and anticancer effects. While Echinacea improves the immune system's ability to fight off microbial infections and aids in wound healing [11]. The current study is designed to investigate the pharmacognostic features and DNA protection potential of the plants of the Asreaceae family, including Eclipta alba, Ageratum conyzoides, Calendula officinalis, and Conyza bonariensis. It aims to contribute to quality control and standardization of herbal medicines.
2. MATERIALS AND METHODS
2.1. ChemicalsMethanol, distilled water, acetic acid, sodium hydroxide, hydrogen peroxide, ethylene diamine terta acetic acid, ascorbic acid, ethidium bromide, and glycerol were purchased from Lahore, Pakistan. The following chemicals were used to isolate DNA from human blood and were incorporated in the Qiajin Mini Kit: Trisbase (Ultra-pure grade, Cat No. 42020236-2), Protinase k (Qiagen mini kit, Catalogue 154029091, Germany), Buffer ATL (Qiagen mini kit, Cat. No. 154042393, Germany), Buffer AL (Qiagen mini kit, Cat. No. 1014594 Germany), Buffer AW1 (Qiagen mini kit, Cat. No. 154039747, Germany), Buffer AW2 (Qiagen mini kit, Cat. No. 154042393, Germany), and Buffer AE (Qiagen mini kit, Cat. No. 1014572 Germany,). All the chemicals used were of analytical grade.
2.2. Collection and Preservation of Plant MaterialThe samples of the aerial parts of E. alba, A. conyzoides, and C. bonariensis were collected from Tehsil Feroz Wala, District Sheikhupura, while the samples of C. officinalis were collected from Rawalpindi. All samples were collected in spring 2017. The plant specimens were authenticated by Prof. Dr. Zaheer-ud-Din Khan, taxonomist of the Botany Department, Government College University Lahore. Each plant was given a specific voucher number as follows: GC. Herb. BOT. 3459 Eclipta alba L., GC. Herb. BOT. 3460 Ageratum conyzoides L., GC. Herb. BOT. 3456 Calendula officinalis L., and GC. Herb. BOT. 3464 Conyza bonariensis L. The leaves and stem samples were also preserved in bottles containing fixative solutions (formaldehyde 10 ml, glacial acetic acid 5ml, and distilled water 10 ml) for section cutting. The quantity of the sample was different for each plant due to the availability of the particular plant.
2.3. Extraction of Plant MaterialFor this study, 50 g of each sample including the leaves and stems of A. conyzoides and C. officinalis, E. alba leaves, and the stem of C. bonariensis were accurately weighed and transferred to a conical flask of 500 ml capacity. Then, an accurately measured 300 ml of methanol was added to the sample flask, so that the sample was completely dipped into the methanol. It was macerated for 5 days at room temperature with occasional stirring. After maceration, the filtration of extracts was performed using filter paper and the extracts were collected in large petri dishes. They were then concentrated by evaporating the solvent in rotary evaporator at 45◦C in a vacuum. The obtained semi solid extracts were stored in the refrigerator for further use [3].
2.4. Physicochemical Analysis
2.4.1 Extractive Values. The extractive value was measured by macerating 5 g of finely powdered sample with alcohol and water. It was macerated with 25 ml of water and methanol for 24 hours. For the first 6 hours, the sample was shaken frequently using an electric shaker; after removing it from the shaker, it was kept for another 18 hours. After 24 hours, the sample was filtered and the extract was collected in previously measured petri dishes. Then, the extract was dried, and the filtrate was evaporated in an oven at a controlled temperature. It was weighed again and the percentage of alcohol-soluble extractive values was calculated with reference to the air-dried drugs. The extract was filtered, concentrated to dryness, and weighed.
2.4.2 Fluorescence Analysis. A total of 1g of plant material was accurately weighed and put into test tubes. Small quantities of freshly prepared chemicals were added to the test tubes. Then, the test tubes were examined in visible light and were also observed under a UV lamp, first in short UV light (wavelength 254 nm) and then in long-range UV light (wavelength 365 nm). The different colors detected were noted [12].
2.4.3 Swelling Index. This parameter describes the swelling of crude drug in a specified period. A total of 1 g of crude was taken by using the cylinder and 20 ml of water was added to it. The volume was noted. The cylinder was shaken for 1 hour at an interval of 15 minutes. Then, it was allowed to stand for 3 hours at room temperature. After 3 hours, the volume occupied by the crude drug was measured. The difference between the two values comprised the swelling index [13].
2.5. Foaming IndexA total of 5g of crude was taken in a 250 ml conical flask containing 30 ml water and boiled for 30 minutes. Then, it was filtered and cooled at room temperature and diluted by adding more water. It was poured into 10 test tubes in increasing order of concentration (1 ml, 2 ml, 3 ml). The volume of these test tubes was adjusted with water up to 10 ml, shaken well for 15 seconds, and allowed to stand for 10 minutes. At the end, the height of the foam was measured with scale [14]. Foaming index (FI) was calculated as per the following formula:
FI=1000/D,
where D is the dilution factor at which foam height is less than 1 cm.
2.6. Preliminary Phytochemical ScreeningFor the phytochemical screening of plant materials various qualitative tests were applied, according to the methods of [14–16]. Different secondary metabolites were examined, such as alkaloids, glycosides, saponins, phenols, terpenes, carbohydrates, proteins, and flavonoids. The results were calculated by the change in color and the presence or absence of precipitates, as shown in Table 6.
2.7. Free Hand Section Cutting and Staining
Microscopical features were studied using a binocular zoom light microscope, semi plan achro (Model AxL, LABO, Germany). Free hand sectioning technique was used to cut thin sections of the fresh plant material and each section was cleared with chloralhydrate to remove chlorophyll. The sections were sequentially placed initially in 30% alcohol, then in 70% alcohol, followed by 90% alcohol, each for 5 minutes. They were then transferred to watch glass containing safranin 10% for 1 minute. Excessive dye was rinsed with 70% alcohol and was observed under light microscope. Afterwards, the sections were stained with fast green for 10-15 seconds. Excessive stain was rinsed with 70% alcohol and observed under light microscope. Then, the sections were treated with xylol, acting as a cleaning agent. For preservation, a drop of Canada balsam was placed on the slides and onto the sections before putting cover slip on the slides to preserve them.
For the microscopical study of the powdered drug, shade dried material was ground and passed through sieve 10. The samples were treated with chloralhydrate before observation under microscope. Permanent slides were prepared using Canada balsam. Photographs of slides were taken from light microscope using mobile phone camera of 50 MP [17, 18].
2.8. DNA Protection Assay2.8.1. Preparation of Fenton’s Reagent. Fenton’s reagent is used to produce oxidative stress in samples containing DNA and causes damage to DNA bases. Fenton’s reagent comprises three chemicals, namely FeCl3, ascorbic acid, and hydrogen peroxide. The solutions of these chemical compounds were prepared in 80 mm, 50 mm, and 30 mm, respectively. After making the required concentration, they were mixed in equal proportions [19].
2.8.2. DNA Protection Assay. DNA was isolated from human blood using spin method. Samples were prepared in Eppendorf tubes and were labelled as A, B, C, D till J, as shown in Table 1. DMSO was used as a solvent for sample preparation of plant extracts. A total of 10 mg of extract was added to the Eppendorf tube and 1 ml of DMSO was also added to it. Further, this solution was filtered using micro filters of 0.22 µm size. The concentration of extracts was 10µg/µl (5µl contains 50µg of extract and 10 µl contains 100 µg of extract). The first series of samples was prepared (as shown in Table 1). These samples were prepared and incubated for 30 minutes at 37℃. After incubation, bromophenol blue dye was added just before the loading of samples [20].
Table 1. Samples Prepared for Gel Electrophoresis
| Sr. No. | Sample | Sample Composition |
|---|---|---|
| 1 | A | Control sample. 3µl DNA and 17µl deionized water |
| 2 | B | Negative control. 3µl DNA, 2µl Fenton’s, 15µl water |
| 3 | C. C. bonariensis | DNA 3µl, Fenton’s 2µl, extract 5µl, H2O 10µl, dye 2µl |
| 4 | D. C. bonariensis | DNA 3µl, Fenton’s 2µl, extract 10µl, H2O 4µl, dye 2µl |
| 5 | E. A. conyzoides | DNA 3µl, Fenton’s 2µl, extract 5µl, H2O 10µl, dye 2µl |
| 6 | F. A. conyzoides | DNA 3µl, Fenton’s 2µl, extract 10µl, H2O 4µl, dye 2µl |
| 7 | G. E. alba | DNA 3µl, Fenton’s 2µl, extract 5µl, H2O 10µl, dye 2µl |
| 8 | H. E. alba | DNA 3µl, Fenton’s 2µl, extract 10µl, H2O 4µl, dye 2µl |
| 9 | I. C. officinalis | DNA 3µl, Fenton’s 2µl, extract 5µl, H2O 10µl, dye 2µl |
| 10 | J. C. officinalis | DNA 3µl, Fenton’s 2µl, extract 10µl, H2O 4µl, dye 2µl |
Gels were run for 45 minutes at 100 volts. The results were noted and photographs were taken using the gel documentation system. This experiment was performed at the School of Biological Sciences, University of the Punjab, Lahore. With a few minor adjustments, the previously reported DNA nicking experiment was used to assess the capacity of various plant extract concentrations to shield pUC19 plasmid DNA from the damaging effects of hydroxyl radicals generated by Fenton's reagent. In this regard, 3 μl of plasmid DNA, 10 μl of Fenton's reagent (30 mm H2O2, 50 mm ascorbic acid, and 80 mm FeCl3), and various extract concentrations (0, 5, 10, 15, and 50 μg/ml) were added to the reaction mixture. Double-distilled water was used to bring the mixture's final volume up to 20 μl. The reaction mixture was incubated at 37°C for 30 minutes. Bromophenol blue dye (0.25% in 50% glycerol) was added following a 30-minute incubation period. After loading the reaction solution (20 μl) onto a 0.8% agarose gel (made by dissolving 0.4 g of agarose in 50 ml of 1 × TBE Buffer), electrophoresis was run for an hour at 90 V. Then, ethidium bromide staining was done. The LAS-4000 MINI Gel documentation system was used to display and quantify the closed circular, linear, and relaxed forms of pUC19 [19].
2.8.2.1 Agarose Gel Electrophoresis Procedure. A total of 1% agarose gel was prepared and solidified in the caster. The caster was then placed into the horizontal gel apparatus, filled up to the maximum marking with 1X TAE. Samples were loaded into the wells with the help of micro pipit. Pipet tips were changed before loading each sample. The lid or cover of horizontal gel running apparatus was placed tightly. Voltage providing device was set at 100 volts and time was adjusted for 45 minutes. Bromophenol blue dye slowly started moving toward the positive end of the apparatus due to the charge and density of the dye. Moreover, DNA also started moving toward the positive end. After 45 minutes, the cover of the apparatus was removed and gel caster was detached and observed under UV trans illuminator for visualizing the DNA bands. The images of gel documentation system and UV trans illuminator were captured and are shown in the results [20].
3. RESULTS
3.1 Physicochemical Studies
3.1.1 Extractive Values. Extractive values were calculated as percentage values for 4 plant species, namely E. alba, A. conyzoides, C. bonariensis, and C. officinalis, to indicate the presence of bioactive compounds soluble in specific solvents. Table 2 presents alcohol-soluble and water-soluble extractive values for the 4 above mentioned plant species. Among them, C. bonarienses exhibited the highest extractive values, particularly in water, that is, 14%, when compared with the other 3. Whereas, A. conyzoides exhibited the lowest extractive value of 2% in alcohol. It suggests that this plant may have the major concentration of polar compounds.
Table 2. Alcohol Soluble and Water-Soluble Extractive Values
| No. | Plant Sample | Alcohol-Soluble Extractive Values (%) | Water-Soluble Extractive Values (%) |
|---|---|---|---|
| 1 | E. alba | 4 | 5 |
| 2 | A. conyzoides | 2 | 4 |
| 3 | C. officinalis | 4 | 8 |
| 4 | C. bonariensis | 4 | 14 |
All the findings are given as the mean value of triplicates values.
3.1.2 Fluorescence Analysis. Fluorescence analysis is a qualitative technique used to identify the presence of certain phytochemicals based on their fluorescence under different wavelengths of light: Visual light, Short UV (254 nm), and Long UV (365 nm). Table 3 below presents the fluorescence characteristics of the powdered materials of E. alba, A. conyzoides, C. bonariensis, and C. officinalis. The results revealed distinct patterns for each plant sample, suggesting the presence of diverse phytochemicals.
Table 3. Fluorescence Analysis of Plant Material
| No | Treatment | E. alba | A. conyzoides | C. officinalis | C. bonariensis | ||||||||
|---|---|---|---|---|---|---|---|---|---|---|---|---|---|
| VL | SL | LL | VL | SL | LL | VL | SL | LL | VL | SL | LL | ||
| 1 | Powder only | PG | G | G | DG | DG | DG | W | G | LG | PG | DG | PG |
| 2 | Pet. Ether | MG | B | W | DG | BR | FP | W | B | YW | LG | BR | P |
| 3 | 10% NaoH | YG | BR | DG | DG | DB | DG | PO | RB | LG | YB | R | PG |
| 4 | Chloroform | DG | BR | W | BL | DB | FP | MG | RB | YW | G | LG | WP |
| 5 | 50% H2SO4 | DG | LB | LG | BL | G | GB | B | BR | G | BL | BR | LG |
| 6 | 50% HNO3 | R | BR | DG | B | LY | DG | PO | B | B | O | LB | LG |
| 7 | 50% HCl | RB | BR | G | MG | LG | DG | YW | LG | G | G | BR | LG |
Note. VL= Visual light, SL= Short UV (254 nm), LL= Long UV (365 nm) PG= Pale green, MD= Muddy green, YG= Yellowish green, DG= Dark green, R= Red, RB= Reddish brown, G= Green, B= Brown, BR= Brick red, LB= Light brown, W= White, LG= Light green, BL= Black, DB= Dark brown, LY= Light yellow, FP= Fluorescent pink, GB= Greenish brown, PO= Pale orange, YW= Yellowish white, YB= Yellowish brown, O= Orange, P= Pink, WP= Whitish pink.
3.1.3 Swelling Index. Swelling index is an important parameter to identify mucilage and resins. All the samples did not absorb water. The analysis displayed that these crude drugs do not have a swelling index. The results are given in Table 4 below.
Table 4. Swelling Index
| Sr. No. | Plant | Swelling Index |
|---|---|---|
| 1 | E. alba | No |
| 2 | A. conyzoides | No |
| 3 | C. officinalis | No |
| 4 | C. bonariensis | No |
Foaming index (FI) is an important parameter to identify saponins. The results are shown in Table 5 below. FI was less than 100 where foam height was less than 1 cm, while FI was 100 where foam height was 1 cm.
Table 5. Foaming Index
| Sr. No. | Plant | FI |
|---|---|---|
| 1 | E. alba | 100 |
| 2 | A. conyzoides | Less than 100 |
| 3 | C. officinalis | Less than 100 |
| 4 | C. bonariensis | 100 |
Preliminary phytochemical screening was carried out to identify the chemical constituents present in the extracts. Tests were performed by treating extract solutions with different reagents. The results are given in Table 6 below.
Table 6. Qualitative Phytochemical Analysis for Secondary Metabolites
| No. | Phytoconstituents | Test/Reagent | E. alba | A. conyzoides | C. officinalis | C. bonariensis |
|---|---|---|---|---|---|---|
| 1 | Glycosides | Keller-Killiani Test | Present | Absent | Present | Present |
| 2 | Alkaloids | Hager’s reagent Test | Present | Present | Present | Present |
| 3 | Proteins | Biuret reagent Test | Absent | Absent | Present | Absent |
| 4 | Saponins | Foaming Test | Present | Absent | Absent | Present |
| 5 | Carbohydrates | Benedict reagent Test | Absent | Absent | Present | Absent |
| 6 | Flavonoids | Ferric Chloride Test | Present | Present | Present | Present |
| 7 | Triterpenoids | Liebermann Burchard Test | Present | Present | Present | Present |
| 8 | Phenols | Lead acetate Test | Present | Present | Present | Present |
Powered microscopy was performed to identify the microscopic structures present in the powders, such as trichomes, stomata, starch granules, and vascular bundle epidermis. This technique provides valuable insights into the microscopic characteristics unique to each plant sample and serves as a diagnostic tool for the quality control of medicinal plants. The results for each plant sample including stem and leaf samples are presented below.
3.4. Microscopic Studies of Powdered Plant Samples3.4.1. Powdered Microscopy of E. alba Leaf and Stem. The qualitative powder microscopy of E. alba leaf and stem, shown in Figure 1, revealed important diagnostic features including unicellular trichomes, epidermal cells, lignified vessels with specific pitted structures, thin-walled parenchyma cells, crystals of calcium oxalate, abundant starch granules, fibers, and leaf stomata.
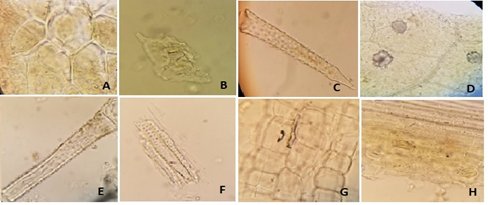
Figure 1. A (Unicellular trichomes of leaf), B (Vessels at vein termination of leaf), C (Calcium oxalate rosette in leaf), D (Starch granules in leaf), E (Epidermal cells of stem), F (Pitted vessels of stem), G (Parenchyma cells of stem), H (Fibers and stomata in stem)
3.4.2. Powdered Microscopy of A. conyzoides Leaf and Stem. The powdered microscopy of A. conyzoides (Figure 2) revealed significant anatomical features, including epidermis cells containing stomata in leaf powder, spiral and reticulate vessels, parenchyma cells, and trichomes. These microscopic observations provide detailed insights into the structural characteristics of this important medicinal plant.
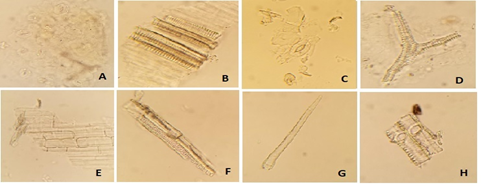
Figure 2. A (Epidermis containing stomata of leaf), B (Group of spiral vessels of leaf), C (Stomata of leaf) D (Vessels at vein termination), E (Parenchyma cells of stem), F (Fibers in stem), G (Unicellular trichome head of stem), H (Spiral vessel of stem)
3.4.3. Powdered Microscopy of C. officinalis Leaf and Stem. The powdered microscopy of C. officinalis leaves and stem revealed significant anatomical features, as illustrated in Figure 3. In the figure, parenchyma cells, glandular trichomes, as well as their fragments and heads, are observed. Epidermal cells are also prominent. Some epidermal cells containing open stomata are detectable, including some reticulate vessels, showcasing the vascular and structural components of this plant.
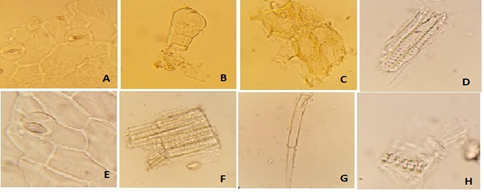
Figure 3. A (Glandular trichome of leaf), B (Glandular trichome head of leaf trichome), C (Parenchyma cells of leaf), D (Reticulate vessels of leaf), E (Epidermis cells containing open stomata in leaf), F (Fibers of stem), G (Fragment of a multicellular trichome), H (Spiral vessel of stem)
3.4.4. Powdered Microscopy of C. bonariensis Leaf and Stem. Figure 4 presents key microscopic features of C. bonariensis, including the epidermis cells containing open stomata in leaf, fragments of a multicellular trichome, and some starch granules seen in leaf portion, fibers, and vessels.
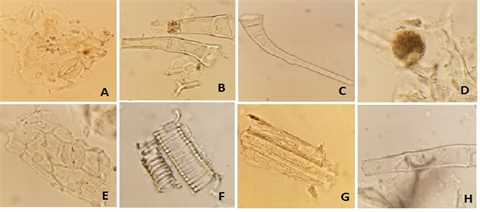
Figure 4. A (Epidermis cells containing open stomata in leaf), B (Fragments of trichomes in leaf), C (Long covering trichome of leaf), D (Starch granules in leaf), E (Epidermis cells containing open stomata of stem), F (Spiral vessels in stem), H (Fragment of trichome of stem)
3.5. Microscopic Study of Fresh Plant MaterialSections of fresh plant material, including leaf and stem portions, were cut by using free hand section cutting technique. The sections were carefully cut to maintain the integrity of tissues. Each section was stained in 10% safranin to enhance the visibility of tissues and subsequently observed under the microscope.
3.5.1. Transverse Section Cutting of E. alba Stem and Leaf. The transverse section of E. alba stem and leaf showed significant anatomical features, which are presented in Figure 5. In the figure, safranin-stained vascular bundles, including xylem and phloem, surrounded by the parenchyma cells of stem and leaf, are observed. Epidermal cells with covering trichomes and collenchyma cells below the epidermis are also visible. The upper epidermal layer of leaf, mesophyll, and stomata cells are also noticeable.
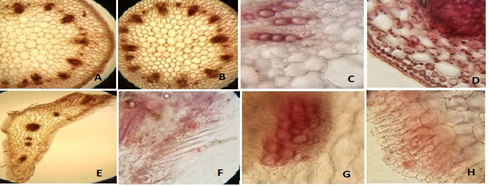
Figure 5. A, B (Transverse section of stem showing pith in the center), C (Safranin-stained vascular bundles surrounded by the parenchyma cells of stem), D (Epidermis cells of stem showing collenchyma cells below the epidermis of stem), E (Transverse section of leaf showing all the anatomical structure of leaf), F (Epidermis with covering trichomes), G (Safranin-stained vascular bundles surrounded by the parenchyma cells of leaf), H (Stomata in the upper epidermis layer)
3.5.2. Transverse Section Cutting of A. conyzoides Leaf and Stem. The transverse section of A. conyzoides leaf and stem revealed important structural features, as presented in Figure 6. In the figure, epidermal cells with covering trichomes and collenchyma cells are clearly visible, both in leaf and stem safranin-stained vascular bundles (xylem and phloem), surrounded by parenchyma cells. In the upper epidermis of leaf, there were visible stomata. In the center of the transverse section of stem, pith can be observed.
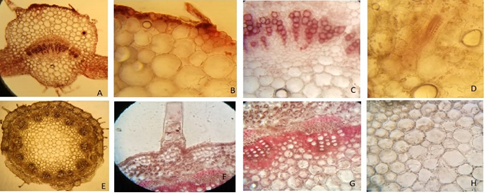
Figure 6. A (Transverse section of leaf showing all the anatomical structure of leaf), B (Epidermis cells with covering trichome of leaf), C (Safranin-stained vascular bundles surrounded by parenchyma cells in leaf), D (Stomata in the upper epidermis layer of leaf), E (Transverse section of stem showing pith in the center and all the anatomical structure of stem), F (Epidermis with covering trichome and collenchyma cells below the epidermis of stem), G (Safranin-stained vascular bundles of stem), H (Parenchyma cells of the stem)
3.5.3. Transverse Section Cutting of C. officinalis Leaf and Stem. Distant microscopical features of C. officinalis were studied under the microscope, as depicted in Figure 7. In the figure, epidermis, mesophyl, sfranin-stained xylem and phloem, paranchyma cells, fibers, stoma, cortex, and other features can be observed in the leaf and stem. These anatomical characteristics collectively highlight the structural and functional properties of both leaf and stem.
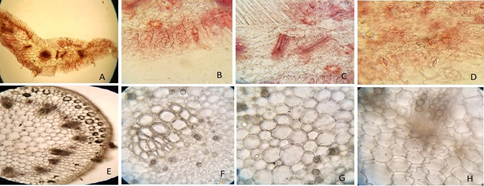
Figure 7. A (Transverse section of leaf showing all the anatomical structure of leaf), B (Epidermis cells with the stomata of leaf), C (Safranin-stained vascular bundles in leaf), D (Stomata in the upper epidermis layer of leaf), E (Transverse section of stem showing pith in the center), F (Phloem cells), G (Cortex of stem), H (Xylem cells)
3.5.4. Transverse Section Cutting of C. bonariensis Leaf and Stem. Figure 8 illustrates the microscopical features of C. bonariensis, including safranin-stained vascular bundles as conducting tissues and epidermal cells having multicellular covering trichomes in both leaf and stem. While parenchyma cells and collenchyma cells below the epidermis are visible and surrounding the xylem and phloem below the epidermis in both leaf and stem.
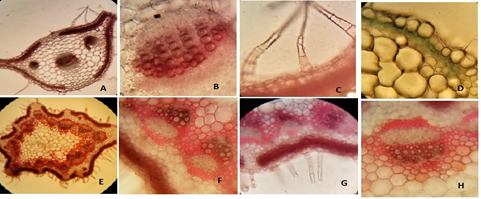
Figure 8. A (Transverse section of leaf), B (Vascular bundles of leaf), C (Safranin-stained trichomes in leaf), D (Epidermis cells of leaf), E (Transverse section of stem showing pith in the center and all the anatomical structure of stem), F (Collenchyma cells below the epidermis), G (Epidermis containing covering trichomes), H (Vascular bundles surrounded by parenchyma cells)
3.6. DNA Protection ActivityDNA protection activity of the extracts of all 4 selected plant species was investigated by using agarose gel electrophoresis, as illustrated in Figure 9.
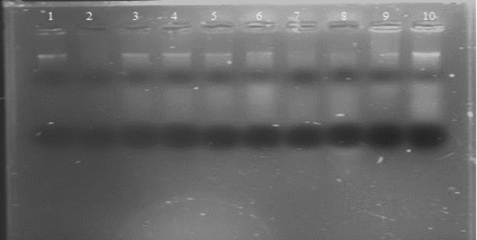
Figure 9. Gel Electrophoresis Representation of DNA Protection Assay
Well # 1 contains DNA and deionized water. An intact DNA band indicates that DNA is present. Well # 2 contains DNA, Fenton’s reagent, and deionized water. DNA smear indicates that DNA is damaged by Fenton’s reagent. Well # 3 contains DNA, Fenton’s reagent, and 50µg extract of C. bonariensis. DNA band indicates that the extract prevented DNA damage. Well # 4 contains DNA, Fenton’s reagent, and 100µg extract of C. bonariensis. DNA band indicates that the extract prevented DNA damage. Well # 5 contains DNA, Fenton’s reagent, and 50µg extract of A. conyzoides. DNA band indicates that the extract prevented DNA damage. Well # 6 contains DNA, Fenton’s reagent, and 100µg extract of A. conyzoides. DNA band indicates that the extract prevented DNA damage. Well # 7 contains DNA, Fenton’s reagent, and 50µg extract of E. alba. DNA smear indicates that the extract is less effective. Well # 8 contains DNA, Fenton’s reagent, and 100µg extract of E. alba. DNA smear indicates that the extract is more effective at this concentration. Well # 9 contains DNA, Fenton’s reagent, and 50µg extract of C. officinalis. DNA band indicates that the extract prevented DNA damage. Well # 10 contains DNA, Fenton’s reagent, and 100µg extract of C. officinalis. DNA band indicates that the extract prevented DNA damage.
4. DISCUSSION
Medicinal plants are a chief source to treat human ailments. About one fourth of the world population is reliant on traditional medicines, predominantly herbal drugs for treating illnesses [21]. Herbal drugs are a preferable choice over present synthetic medications. Usually, herbal preparations include the use of fresh or dehydrated plant parts. A precise understanding of crude herbal drugs is a very vital feature in the preparation, efficacy, and safety of natural products [22]. WHO has highlighted the necessity to confirm the quality control of natural products by means of the current techniques and by using suitable standards. In this regard, standardization is essential to validate the quality of natural products all over the world [23].
The current research was an attempt to investigate the pharmacognostic characteristics of 4 plants of the family Asteraceae, namely E. alba, A. conyzoides, C. officinalis, and C. bonariensis. To this end, the first step involved studying the aerial parts of these plants from a pharmacognostic perspective. This involved an in vitro DNA protection assay, microscopic evaluation, preliminary phytochemical analysis, and determining two physiochemical parameters: extractive values and fluorescence analysis. Predictably, different plants and classes would noticeably have diverse chemical profiles. Chemical constituents existing in the plant can be solved in different solvents for further analysis. Therefore, two solvents, namely water and alcohol, were selected. Water-soluble extractive values showed a significant role in the assessment of crude herbal drugs. A smaller extractive value specifies the addition of adulterants or improper handling during formulation, drying, or storage. The solubility of the constituents of the selected plants remained almost the same in alcohol, while water-soluble extractive values were higher. The water solubility of the plant constituents was in the order E. alba < A. conyzoides < C. officinalis < C. bonarienses [12].
In this study, preliminary phytochemical analysis showed the presence of alkaloids, glycosides, triterpenoids, phenols, and flavonoids in all 4 samples of methanolic extract and saponins, although they were absent in ageratum and calendula extracts. The presence of flavonoids and phenols indicated in the phytochemical screening confirmed their antioxidant potential [24].
The physical constant evaluation of the drugs is an important parameter in detecting adulteration or improper handling. The fluorescence characteristics of the stem and leaf powder of the selected plants were observed under daylight and UV. The results are presented in Table 3 [25]. Swelling index is an important parameter to identify mucilage and resins. All the samples did not absorb water and the analysis displayed that these crude drugs do not have a swelling index. Foaming index is another important parameter to determine the quality and purity of these crude drugs. Plants which have saponins show foaming index. The foaming index for two plants was 100 and for the remaining two it was less than 100. This indicates that saponins were present in the extract, which was also confirmed during the preliminary phytochemical screening of the crude drug. Morphological characteristics are frequently used to identify species. Anatomical features can help in identification, especially when they are powdered. The microscopic observation of the powder of the stem and leaf of these plants showed the presence of cellular structures, such as covering trichomes, glandular trichomes, spiral vessels, reticulated vessels, epidermis, and stomata. Trichomes of different types, such as simple covering, linear glandular, and capitum glandular trichomes were observed in the microscopy of the powder [26]. The mixing of adulterants can certainly be identified by the analysis of these microscopic structures. C. bonariensis stem showed numerous trichomes around the circumference. Stomata were present in the lower epidermis and in the E. alba and C. bonariensis stem. In the stem, there were collenchymatus cortex and pericycle in which collateral vascular bundles were present. In the center, parenchymatous pith was observed. There was collenchymatus cortex present in the stem inner to the epidermis. Moreover, collateral vascular bundles, as well as the inner most parenchymatous pith, were also present in the stem.
Oxidative stress is initiated by free radicals which leads to oxidation and DNA damage, resulting in genomic instability and the development of a variety of cancerous cells. Mostly, the 8-hydroxydeoxyguanisine base is broken by oxidative stress. Almost all natural products have natural antioxidants that reverse the effects of free radicals and ROS produced as a result of metabolism inside the cells. These free radicals damage the cellular structures, such as lipids, carbohydrates, and DNA. This, in turn, leads to the development of various diseases including cardiac diseases, cancer, and inflammatory response. Therefore, the antioxidant potential of the selected plants was investigated in vitro. This assay reflected the capability of extracts from the plants to protect DNA against the damage triggered by hydroxyl (OH) free radicals. Hydroxyl radicals, produced by the Fenton reaction, are known to cause oxidative induced breakdowns in DNA strands. Exposure of DNA to Fenton’s reagent eventually results in the breakdown of DNA strands, primarily due to the production of reactive free radicals and the consequent free radical-induced reaction on DNA. Hydroxyl free radicals react with nitrogenous bases of DNA, generating sugar radicals and base radicals. Base radicals then react with sugar, causing damage to sugar phosphate backbone of DNA, resulting in DNA damage [20]. The DNA protection assay revealed that these plant extracts effectively safeguarded DNA from strand breaks caused by hydroxyl radicals generated through the Fenton reaction. This antioxidant action could possibly be due to the presence of phenolic acids and flavonoids present in these plants’ extracts. These compounds stabilize free radicals by donating hydrogen atoms or electrons, preventing oxidative damage to the cells [24]. All the extracts, except E. alba, prohibited oxidative damage to DNA in the presence of DNA damaging agent (Fenton’s reagent) at a concentration of 50 µg/ml. E. alba may show antioxidants at high concentration because E. alba is an antioxidant plant. The antioxidant potential of selected plants observed in this study was in the following order: E. alba < A. conyzoides < C. bonarienses < C. officinalis. The findings align with the traditional medicinal applications of these plants in treating conditions associated with oxidative stress, such as liver disorders, wound healing, and inflammation. By providing scientific validation of their DNA-protective properties, the current study bridges the gap between traditional knowledge and molecular mechanisms, reinforcing their potential as natural therapeutic agents.
4.1. ConclusionThe identification and standardization of E. alba, A. conyzoides, C. bonarienses, and C. officinalis were shown to benefit from the results of pharmacognostical factors, including microscopic observations, phytochemical analysis, and a few physiochemical measures. The findings would help in the proper identification and quality standardization of these species. The study also showed the DNA damage inhibition potential of the methanolic extracts. These plants' ability to prevent DNA damage may be taken into consideration for treating oxidative stress-induced diseases. Further studies should be carried out to establish an antioxidant mechanism and quantitative analysis of secondary metabolites.
CONFLICT OF INTEREST
The authors of the manuscript have no financial or non-financial conflict of interest in the subject matter or materials discussed in this manuscript.
DATA AVAILABILITY STATEMENT
Data associated with this study will be provided by corresponding author upon reasonable request.
FUNDING DETAILS
No funding has been received for this research.
REFERENCES
- Alamgir ANM. Phytoconstituents—active and inert constituents, metabolic pathways, chemistry and application of phytoconstituents, primary metabolic products, and bioactive compounds of primary metabolic origin. In: Therapeutic use of medicinal plants and their extracts: volume 2: phytochemistry and bioactive compounds. Cham: Springer; 2018:25–164. https://doi.org/10.1007/978-3-319-92387-1_2
- Rehman SU, Arshad L, Saman A, Massey S, Khan S, Samad A. Unlocking the medicinal potential of Sarcococca saligna: green synthesis of silver and gold nanoparticles for enhanced antibacterial and antifungal applications. Pak J Agric Res. 2023;36(4):327–334. https://doi.org/10.17582/journal.pjar/2023/36.4.327.334
- Rehman SU, Anwar K, Saqib QNU, Khan S, Ahmad S, Samad A. In-vitro antimicrobial analysis of aqueous methanolic extracts and crude saponins isolated from leaves and roots of Sarcococca saligna. Pak J Agric Res. 2019;32(2):268–274. https://doi.org/10.17582/journal.pjar/2019/32.2.268.274
- Gami B, Parabia M. Pharmacognostic evaluation of bark and seeds of Mimusops elengi L. Int J Pharm Pharm Sci. 2010;2(Suppl 4):110–113. https://www.ijpps.com/index.php/IJPPS/article/view/346
- Kunle OF, Egharevba HO, Ahmadu PO. Standardization of herbal medicines-a review. Int J Biodivers Conserv. 2012;4(3):101–112. https://doi.org/10.5897/IJBC11.163
- Josa E, Barril G, Ruperto M. Potential effects of bioactive compounds of plant-based foods and medicinal plants in chronic kidney disease and dialysis: a systematic review. Nutrients. 2024;16(24):4321. https://doi.org/10.3390/nu16244321
- Ozsoy N, Can A, Yanardag R, Akev N. Antioxidant activity of Smilax excelsa L. leaf extracts. Food Chem. 2008;110(3):571–583. https://doi.org/10.1016/j.foodchem.2008.02.037
- Zahra SA, Iqbal J, Abbasi BA, Aslam S, Ahmad S, Khan S, Mirza B. Phylogenetic analysis of selected species of Asteraceae on the basis of RPS 11 gene. Sci Rep. 2024;14:24808. https://doi.org/10.1038/s41598-024-75991-0
- Mueller MS, Karhagomba IB, Hirt HM, Wemakor E. The potential of Artemisia annua L. as a locally produced remedy for malaria in the tropics: agricultural, chemical and clinical aspects. J Ethnopharmacol. 2000;73(3):487–493. https://doi.org/10.1016/S0378-8741(00)00289-0
- Ain QT, Saleem N, Munawar N, Nawaz R, Naseer F, Ahmed S. Quest for malaria management using natural remedies. Front Pharmacol. 2024;15:1359890. https://doi.org/10.3389/fphar.2024.1359890
- Haddad PS, Azar GA, Groom S, Boivin M. Natural health products, modulation of immune function and prevention of chronic diseases. Evid Based Complement Alternat Med. 2005;2(4):513–520. https://doi.org/10.1093/ecam/neh125
- Kokate C, Purohit A, Gokhale S. Text book of pharmacognosy. Pune: Pragati Books Private Limited; 2008.
- Inylieieva M, Karpiuk U. Determination of the swelling index for the promising plant raw materials as the sources of pectin substances. Kyiv: Ministry of Health of Ukraine; 2023.
- Aryan S, Mortazavian AM, Mohammadi F, Mahdavi V, Moazami N, Jazaeri S. Physicochemical properties of saponin containing Acanthophyllum laxiusculum extract: example application in foam stability and qualitative parameters for malt beverage industry. J Food Sci Technol. 2021;59:1577–1587. https://doi.org/10.1007/s13197-021-05169-3
- Brain KR, Turner TD. The practical evaluation of phytopharmaceuticals. Bristol: Wright-Scientechnica; 1975.
- Bhandary SK, Bhat VS, Sharmila K, Bekal MP. Preliminary phytochemical screening of various extracts of Punica granatum peel, whole fruit and seeds. J Health Allied Sci NU. 2012;2(4):34–38. https://doi.org/10.1055/s-0040-1703609
- Metscher BD. MicroCT for comparative morphology: simple staining methods allow high-contrast 3D imaging of diverse non-mineralized animal tissues. BMC Physiol. 2009;9:11. https://doi.org/10.1186/1472-6793-9-11
- Alam F, Saqib QN. Pharmacognostic standardization and preliminary phytochemical studies of Gaultheria trichophylla. Pharm Biol. 2015;53(12):1711–1718. https://doi.org/10.3109/13880209.2014.1003355
- Sevgi K, Tepe B, Sarikurkcu C. Antioxidant and DNA damage protection potentials of selected phenolic acids. Food Chem Toxicol. 2015;77:12–21. https://doi.org/10.1016/j.fct.2014.12.006
- Golla U, Bhimathati SSR. Evaluation of antioxidant and DNA damage protection activity of the hydroalcoholic extract of Desmostachya bipinnata L. Stapf. Sci World J. 2014;2014:215084. https://doi.org/10.1155/2014/215084
- Kala S, Johnson M, Janakiraman N, Arockiaraj AA, Raj SI, Bosco DBD. Pharmacognostic and phytochemical studies on some selected ethnomedicinal plants of Tamilnadu, South India. Int J Med Aromat Plants. 2011;1(2):89–94. http://www.openaccessscience.com/pdf-files/vol1_2/IJMAP_1(2)2011_89-94.pdf
- Nivedithadevi D, Somasundaram R. Pharmacognostical and qualitative phytochemical studies on the aerial parts of Tephrosia purpurea (L). Int J Res Biol Sci. 2012;2(2):48–53. http://urpjournals.com/tocjnls/5_12v2i2_2.pdf
- Roopashree TS, Dang R. Standardization and phytochemical investigation of Calendula officinalis, Cassia tora and Momordica charantia seed extract. J Pharm Res. 2017;16(1):80–85. https://doi.org/10.18579/jpcrkc/2017/16/1/112481
- Brewer M. Natural antioxidants: sources, compounds, mechanisms of action, and potential applications. Compr Rev Food Sci Food Saf. 2011;10(4):221–247. https://doi.org/10.1111/j.1541-4337.2011.00156.x
- Donga S, Moteriya P, Pande J, Chanda S. Development of quality control parameters for the standardization of Pterocarpus santalinus Linn. F. leaf and stem. J Pharmacogn Phytochem. 2017;6(4):242–252. https://www.phytojournal.com/archives/2017/vol6issue4/PartE/6-3-264-819.pdf
- Aschenbrenner AK, Horakh S, Spring O. Linear glandular trichomes of Helianthus (Asteraceae): morphology, localization, metabolite activity and occurrence. AoB Plants. 2013;5:plt028. https://doi.org/10.1093/aobpla/plt028