
| Review | Open Access |
|---|
Physicochemical Evaluation of Streptomycin Sulphate using Simple and Newly Developed Spectrophotometric Methods |
 |
|---|
![]() Ubed-Ur-Rehman Mughal1, Madan Lal Maheshwari2, Abdul Rehman Uzaid Mughal2, Fozia Rustamani1,3, Muhammad Akram Khatri4, Sara Aftab5, and Saeed Ahmed Lakho2*
Ubed-Ur-Rehman Mughal1, Madan Lal Maheshwari2, Abdul Rehman Uzaid Mughal2, Fozia Rustamani1,3, Muhammad Akram Khatri4, Sara Aftab5, and Saeed Ahmed Lakho2*
1Department of Pharmaceutics, Faculty of Pharmacy, University of Sindh, Jamshoro, Pakistan.
2Department of Pharmaceutical Chemistry, Faculty of Pharmacy, University of Sindh, Jamshoro, Pakistan.
3Pharmaceutical Sciences and Technology Program, Faculty of Pharmaceutical Sciences, Chulalongkorn University, Bangkok, Thailand.
4Department of Pharmacology, Faculty of Pharmacy, University of Sindh, Jamshoro, Sindh, Pakistan.
5Institute of Biochemistry, Faculty of Natural Sciences University of Sindh, Jamshoro, Sindh, Pakistan.
Streptomycin sulphate (STP), an antibiotic that belongs to the aminoglycoside class, works by blocking the protein synthesis of the bacteria. This research presents a simple, fast, and cost-effective method for the analysis of the physicochemical parameters of STP used by three brands. The current study was conducted in two stages. In the first stage, physical properties such as color, pH, and weight variations of brands containing STP were evaluated using simple aesthetic procedures. In the second stage, chemical analysis was carried out using derivatization approach, followed by analysis with spectrophotometer. The derivatization of STP was carried out using vanillin as derivatizing agent. Beer’s law was followed in the range of 10-50 µg/ml, while calibration curve was obtained in the same range with R2 value of 0.9993, which shows the linearity of the method. The analysis was carried out using the recovery method. There was 99-101% recovery of the drug using the new method with relative standard deviation ranging between 0.19-0.22%. The results showed that the new method is accurate and precise.
1. INTRODUCTION
Streptomycin sulphate (STP) is chemically called 5-(2,4- diguanidino-3,5,6-trihydroxycyclohexoxy)-4-[4,5-dihydroxy-6-(hydroxymethyl)-3-methylamino tetra hydropyran -2-yl]oxy-3-hydroxy-2- methyl tetra hydrofuran-3-carbaldehyde [Figure 1] [1]. The molecular weight and chemical formula of streptomycin are 1457.376 g/mol and C21H39N7O12, respectively. STP belongs to the aminoglycosides class of antibiotics used against bacterial infections [2, 3]. There are two main ways to classify antibiotics, that is, their mode of action and chemistry. By mode of action, aminoglycosides are antibiotics which inhibit the protein synthesis of bacterial species. There are different species of bacteria for which aminoglycosides are bactericidal, namely gram-negative aerobes and certain anaerobic bacilli [4, 5]. By chemical method of classification, aminoglycosides are classified based on the linkage between amino sugars and aminocyclitol [6, 7]. When given IM, the peak plasma serum concentrations are obtained in 30-120 minutes [8]. It has been found from experiments that STP has a protein binding of 10% and presumably remains dominant in the renal tissue. Kidney is the main organ of the human body which excretes most of the aminoglycosides that remain unaltered via glomerular filtration. They can also be excreted via bile but in a very small quantity. The serum half-life of aminoglycosides inside a healthy human body is about 2-3 hours [6].
The chemical assay of STP is presumably important for checking its quality. Most pharmacopeias recommend microbiological assays for STP analysis [9, 10] and bio-assay determination using different analytical tools, including chromatography, ultra-performance liquid chromatography-mass spectrometry (UPLC–ESI–MS/MS), liquid chromatography-mass spectrometry (LC-MS) [11, 12], and spectrophotometer [13–16]. The chromatographic methods for the analysis of STP are sensitive enough but needed when there are a huge number of samples. For the analysis of a few samples, there is no need to use chromatographic techniques. For different reasons, the use of high price columns, the use of a huge amount of solvents (in mobile phase), and all other operations need considerable time for the cleaning of machines and columns in order to obtain accurate results. The spectrophotometric methods need a lesser amount of solvents, less number of samples, and easily washable accessories. This makes spectrophotometer cost-effective and the most accurate machine for small number of samples. Problems in the detection of STP using spectrophotometer arise because of its absorption in visible range, which has a direct influence on the perceived sample [17]. To make it absorptive in the ultraviolet region, the derivative is synthesized using chromophore. The derivative of drug, in turn, is absorbed in the ultraviolet region which can help avoid fluctuation [18–20]. Different methods of analysis are given for STP using derivative spectrophotometry [13–16]. In these methods, different derivative agents are employed, such as phenol and hypochlorite [13], 2,4,6-trinitrophenol (picric acid; PA) or 2,4-dinitrophenol (2,4-DNP) [14], potassium iodide and potassium iodate [15], and ninhydrin [16].
In this paper, the authors present the physicochemical methods for the evaluation of three different brands present in the market containing STP as an active ingredient. The aim is to devise a simple and easy method for the evaluation of different brands of STP and their comparison with each other to find out the best brand.
2. MATERIALS AND METHODS
2.1. Materials and ReagentsAll the chemicals used to carry out the experiments were of analytical grade. Streptomycin sulphate or STP was gifted by Sanofi Aventis Pharmaceuticals Private Limited, Karachi. Acetic acid and standard vanillin were purchased from Merck Pvt. Ltd. Germany, while ethanol and sodium acetate were purchased from BDH. A Perkin Elmer’s spectrophotometer Lambda 25 having 1 cm silica cells was used to carry out colorimetric analysis. Methanol and acetic acid were purchased from Sigma-Aldrich.
2.2. Reference MethodThe streptomycin drug aqueous solution (1-5 ml) with a concentration range of 10-50 µg/ml was prepared in 10 ml quantity. Absorbance (λ max) was taken for this solution at 275 nm using spectrophotometer. The calculated molar absorptivity of the drug solution was 7.719 x 10 l mole–1 cm–1.
2.2.1. Analytical Method for the Synthesis of Derivative. This method was performed using derivative spectroscopy. In the first stage, the derivative of streptomycin-vanillin was synthesized. Vanillin (2%), with the volume of 1.5 ml, was mixed with the drug solution (10 µg/ml), followed by the addition of buffer solution (pH 9). The mixture was then heated for 15 minutes at a pre-set temperature of 95±05°C. After preparing the derivative, maximum absorbance (λ max) was obtained at 393 nm, while molar absorptivity was 7.719x10. l mole–1 cm–1. The wavelength was selected by checking the response of the drug solution against different wavelengths of 200-800 nm. Afterwards, the λ max was found to be on 393 nm.
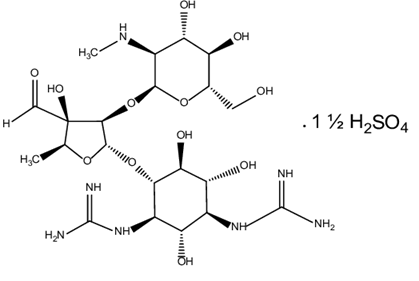
Figure 1. Chemical Structure of STP
3. RESULTS
3.1. Part I: Physical EvaluationThree different STP brands were purchased from the local market and the physical parameters of STP were checked. The results of physical evaluation are shown in Table 1. The weight variation test is indicative of the quality control specifications of a brand. The weight variation test was conducted for the confirmation of the company’s claimed weight. The pH describes the extent of alkalinity or acidity. It is useful in different fields to ensure a product’s safety and quality, which directly influence its effectiveness. The color of a product is indicative of its quality control parameters. The color of a product directly influences its physical nature.
Table 1. Qualitative Analysis of STP Dry Powder BP
|
Brand |
Specifications |
Color |
pH |
Filled Weight |
|---|---|---|---|---|
|
1. |
White powder with 1 g concentration |
White |
6.03 |
1 gram |
|
2. |
White powder with 1 g concentration |
White |
6.01 |
1 gram |
|
3. |
White powder with 1 g concentration |
White |
5.99 |
1 gram |
3.2. Part II: Analytical Method Development using Spectrophotometer
3.2.1 Volume of Reagent (Derivatizing Agent). In this step, different volumes of the reagent were taken, that is, 0.5 ml to 2 ml and mixed with STP. It was observed that 1.5 ml reagent gave maximum absorbance. Figure 2A illustrates the effect of the volume of reagent on the synthesis of the derivative.
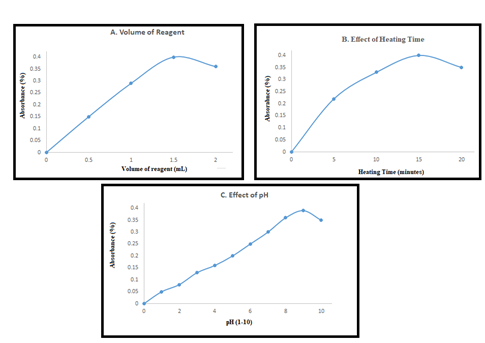
Figure 2. A) Effect of Reagent Volume (ml) B) Effect of Heating Time, and C) Effect of pH of Buffer against Absorbance (%) at 393 nm Wavelength.
3.2.2 Optimization of Heating Time and Temperature. The synthesis time of drug derivative was optimized to obtain the best results. The drug and its derivative were heated for different time periods, that is, 0-20 minutes with an interval of at least 5 minutes. Maximum absorbance was obtained for the solution which was heated up to 15 minutes at a temperature of 95±05°C. This time is considered to be the optimal time for the synthesis of the derivative (Figure 2B).
3.2.3 Optimization of the pH of Buffer. The pH of the buffer solution has a significant impact on the synthesis of the drug derivative. Buffer solutions with different pH were prepared, that is, with 1-10 pH. Maximum absorbance was obtained for the buffer solution with pH 9 at optimized conditions of time and temperature. This pH value is considered as optimal for the synthesis of the derivative (Figure 2C).
3.3.4 Interference Study. To check the effect of the presence of STP, different additives were calculated with respect to their absorbance. There were different concentrations of these additives, namely same, two-times, and ten-times to that of drug concentration. No additives were shown to interfere with this method, that is, relative standard deviations were not more than 6%. The results of interference studies are given in Table 2.
Table 2. Interference Studies using Different Chemicals
|
Sr. No. |
Chemical Added |
%age Error |
|---|---|---|
|
1. |
Water |
0.394 |
|
2. |
Lactose |
0.380 |
|
3. |
Methyl Paraben |
0.386 |
|
4. |
Propyl Paraben |
0.385 |
|
5. |
Sodium Metabisulfite |
0.39 |
|
6. |
Sodium Citrate |
0.39 |
3.3.5 Stability of the Derivative. The STP derivative (50 µg/ml) was synthesized using vanillin (2%). The stability of this derivative was checked for up to 72 hours. It was observed that no variation in the results was obtained which was more than 5%.
3.3.6 Calibration Plots (Beer’s Law). To develop the calibration curve, different concentrations of STP were prepared and its plot was obtained. A linear curve of STP was plotted that obeyed the Beer’s law in 10-50µg/ml STP concentration with a coefficient of determination R2 = 0.9993 (Figure 3). The respective derivatives of the selected aminoglycosides absorbed maximally (with bathochromic shifts) to 393 nm, with molar absorptivity of 1.141x10⁴. L. mole-1 cm-1. In the range of 0.2-0.5μg /ml, Sandell’s sensitivity (0.004) was obtained. The method was validated using the analysis of STP products and the percentage relative error was found to be ±1-2%.
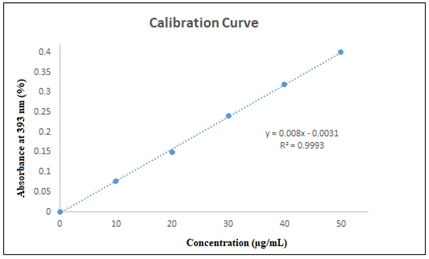
Figure 3. Calibration Curve of STP Derivative using Spectrophotometer at 393 nm (10-50 μg /ml)
3.2.8 Day to Day Reproducibility / Repeatability. For the determination of intraday and interday reproducibility of the methods, aqueous standard solution of STP (30μg/ml) in three different calibrated volumetric flasks (05 ml) was taken and the procedures for derivatization were followed, as described previously. The above procedures were repeated for three days (n=3). The mean absorbance of intraday and interday reproducibility was observed as 0.145 and 0.148, with (RSD) values 0.36% and 0.15%, respectively.
3.2.9 Applicability of the New Method for the Analysis of STP. Three different brands of streptomycin BP dry powder were selected for recovery studies. The percentage recovery was 103% with a relative standard deviation of 0.19-0.22% (Table 3). The sample was prepared from the powdered drug present in different brands in the same way as elaborated in Section 2.2.1.
Table 3. Analysis of STP for Pharmaceutical Preparations
Sr. # |
Drug Brand Name |
Amount Labeled (g)/sample |
Amount Found (g)/sample |
Relative Standard Deviations ±(%) |
% Recovery (90-115) |
|---|---|---|---|---|---|
|
1 |
Streptomycin Sulphate Inj 1g 10 vials (Multnational) |
01 |
1.01 |
(0.21) |
101 |
|
2 |
Streptomycin Inj 1g 1 Vial (National) |
01 |
0.99 |
(0.19) |
99 |
|
3 |
Streptomycin Inj 1g 25 vial (National) |
01 |
1.02 |
(0.22) |
100.2 |
4. DISCUSSION
Checking the physicochemical parameters of a drug is crucial to determine dosage form stability, since they have a direct impact on the potency and efficacy of the drug. Every pharmaceutical dosage form has its own procedure used to check its quality parameters, including weight variation, color, and pH. The testing procedures are performed not only during the production process but also after the product is finished. This study is based on checking the physicochemical parameters of the STP drug. These parameters can be checked by simple aesthetic methods and available lab equipment. In the first stage, physical properties were determined by the methods provided by [21].
It was observed that the sterile powder of STP was white in color, which proved the claim of the manufacturer. Color has a direct impact on the quality of the product. After determining the color of the powder, pH was tested using Orion pH meter. It was tested first by dissolving the powder in the solvent. The results proved that all three products had almost the same pH with very minor differences in the range of 5.99-6.03. The pH was in acceptable limits as per the guidelines of British pharmacopeia [9]. After both the tests, the weight variation test was performed to check whether the powder color claimed by the manufacturer was correct or not. The claimed amount of the dosage form was 1 g. The weight of the powder was checked with a pre-calibrated analytical balance having a high accuracy and precision by using the tarring method. The results showed that the powder was in allowable limit, that is, 1.0001 g. The percentage error was only 0.667%, which is in allowable limit. STP was analyzed using UPLC–ESI–MS/MS [11], liquid chromatography-mass spectrometry [12], and spectrophotometric methods [13–16]. The chromatographic methods for the analysis of STP are sensitive enough but are needed only when there are a large number of samples. For the analysis of a few samples, there is no need to use chromatographic techniques for different reasons, such as the use of high price columns, as well as the use of a huge amount of solvents in the mobile phase. All these operations need considerable time for the cleaning of machine and columns to gain accurate results. The only machine which solves all these problems is spectrophotometer. There is no need for high price columns or a huge amount of solvents. The procedure to use spectrophotometer is a simple one. Only cuvette is washed with 5-30 ml of solvents.
There are two regions of light in spectrophotometer, namely ultraviolet and visible. When light interacts with matter (drugs), absorption or transmittance happens. On the basis of absorbance, drugs are determined based on Beer’s law. In the visible range, a direct influence on the samples under observation was achieved [16]. In visible regions, the samples were not seen to possess photometric activity, nor an interference/fluctuation was observed. Due to this reason, the derivatization approach is mostly used by the scientists [22–24]. The drug was also analyzed by using other chromatographic techniques [25–29]. Aminoglycosides or other drugs with similar problems are determined after attachment with chromophore [13] by using the derivatization approach. This leads to the absorption of the derivative in the UV region, which ultimately avoids fluctuation. In these methods, different derivative agents are employed, such as phenol and hypochlorite [15]. There are different derivatizing reagents utilized for the analysis of STP including 2,4,6-trinitrophenol/2,4-DNP, potassium iodide, potassium iodate, and ninhydrin.
The reaction for the synthesis of derivative is crucial for analysis. After reaction, the drug should not change its structure nor can it be destroyed. Its only aim is to attach the derivative on the side of the drug, so that it can help it to absorb UV light. The reaction starts with the selection of derivatizing agent (and its concentration), buffer solution to resist any change in pH, drug solution (different concentrations), order of mixing of these chemicals, calibration curve, and interference of different materials in the developed method. Different amounts of reagents were tested to check the optimum amount for the completion of reaction. Amounts of 0.5 ml to 2 ml were used separately and it was observed that 1.5 ml of reagent was sufficient. After using this parameter, the time and temperature for the completion of reaction were optimized. After considering many time intervals and temperature differences, 15 minutes and 95±05°C were selected as the optimized time and temperature respectively for the completion of reaction. Calibration curve was calculated in the range of 10-50 µg/ml of STP, with the coefficient of determination R2 = 0.9993. The limit of detection (LOD) and the limit of quantification (LOQ) were calculated by using (3 Ϭ /slope) and (10 Ϭ /slope) respectively, as given by [29, 30]. It was found that the newly developed method has an LOD of 0.942 µg/ml and LOQ of 3.139 µg/ml, respectively.
After developing the method, its specificity was determined using the observations of different interferents. The drug analysis was carried out using the same parameters, namely wavelength, concentrations, and others. Also, some chemicals were added to the drug solution with 2-to-10 times concentration. It was observed that the method was specific with no interference from any chemicals. The relative standard deviation (RSD) of the method was not more than 6%. In the very last step, the stability of the newly synthesized derivative was checked. It was calculated using the synthesis of the derivative and by storing the derivative up to 72 hours at low temperature. The drug did not show any fluctuation (more than 5%) up to this period. Moreover, it was concluded that the synthesized derivative remained stable for 3 days without losing its characteristic absorbance.
4.1. Conclusion
STP is a drug of choice prepared from aminoglycoside antibiotics and used in the treatment of different bacterial infections. The current study was conducted in two stages. The first stage involved the evaluation of the physical properties of STP, namely color, pH, and weight variation, as well as its chemical properties by using derivative spectroscopy for the analysis of STP for pharmaceutical formulations. In the second stage, the synthesis of streptomycin-vanillin derivative was carried out, followed by analysis using spectrophotometer. Beer’s law was followed and calibration curve was obtained in range of 10-50 µg/ml with an R2 value of 0.9995, respectively. The newly developed spectrophotometric method was checked using recovery method for the available brands. There was 103% recovery with relative standard deviation and relative deviation of 0.24% and 3%. All three products which were tested gave satisfactory results with allowable limits.
CONFLICT OF INTEREST
The authors of the manuscript have no financial or non-financial conflict of interest in the subject matter or materials discussed in this manuscript.
DATA AVAILABILITY STATEMENT
Data associated with this study is presented within the manuscript.
FUNDING DETAILS
This study did not receive any funding from any sources.
REFERENCES
- Arshad H, Waseem H, Khaliq R. Simple and rapid method on high performance liquid chromatography (HPLC) for estimation of streptomycin sulphate. J World Appl Sci. 2012;19(5):645–649. https://doi.org/10.5829/idosi.wasj.2012.19.05.6421
- Jian W, James DM, Jack FK. Chemical analysis of antibiotics residues in food. John Wiley & Sons, Inc; 2012.
- Finberg RW, Moellering RC, Tally FP, Craig WA, Pankey GA, Dellinger EP. The importance of bactericidal drugs: future directions in infectious disease. Clin Infect Dis. 2004;39(9):1314–1320. https://doi.org/10.1086/425009
- Munita JM, Arias CA. Mechanisms of antibiotic resistance. In: Kudva IT, Cornick NA, Plummer PJ, et al, editors. Virulence mechanisms of bacterial pathogens. Wiley Publishers; 2016:481–511. https://doi.org/10.1128/9781555819286.ch17
- Bharadwaj A, Rastogi A, Pandey S, Gupta S, Sohal JS. Multidrug-resistant bacteria: their mechanism of action and prophylaxis. Biomed Res Int. 2022;2022:5419874. https://doi.org/10.1155/2022/5419874
- Mingeot-Leclercq MP, Glupczynski Y, Tulkens PM. Aminoglycosides: activity and resistance. Antimicrob Agents Chemother. 1999;43(4):727–737. https://doi.org/10.1128/AAC.43.4.727
- Krause KM, Serio AW, Kane TR, Connolly LE. Aminoglycosides: an overview. Cold Spring Harb Perspect Med. 2016;6(6):027029. https://doi.org/10.1101/cshperspect.a027029
- Durante-Mangoni E, Grammatikos A, Utili R, Falagas ME. Do we still need the aminoglycosides? Int J Antimicrob Agents. 2009;33(3):201–205. https://doi.org/10.1016/j.ijantimicag.2008.09.001
- British Pharmacopoeia. Her Majesty’s Stationery Office; 1998.
- Hanes SD, Herring VL. Gentamicin enzyme-linked immunosorbent assay for microdialysis samples. Ther Drug Monit. 2001;23(6):689–693. https://doi.org/10.1097/00007691-200112000-00016
- Murali P, Jos H, Ann VS, Erwin A. LC-MS of streptomycin following desalting of a nonvolatile mobile phase and pH gradient. J Sep Sci. 2009;32(20):3418–3424. https://doi.org/10.1002/jssc.200900238
- Bagade SB, Sanjay KP. Spectrophotometric estimation of torsemide in tablet dosage form using chemical derivatization technique. Int J Pharm Qual Assur. 2010;2(1):52–55. https://doi.org/10.25258/ijpqa.v2i1.8034
- Rowe WF. Chemical methods in firearms analysis. In: Siegel JA, editor. Forensic chemistry: fundamentals and applications. Wiley Publishers; 2015:1–19. https://doi.org/10.1002/9781118897768.ch10
- Mitic SS, Miletic GZ, Kostic DA, Rasic ID. A spectrophotometric study of streptomycin effect on the clinical urea determination. Chin J Chem. 2011;29(1):135–142. https://doi.org/10.1002/cjoc.201190041
- Omar MA, Nagy DM, Hammad MA, Aly AA. Validated spectrophotometric methods for determination of certain aminoglycosides in pharmaceutical formulations. J Appl Pharm Sci. 2013;3(3):151–161. https://doi.org/10.7324/JAPS.2013.30329
- Skoog DA, Holler FJ, Crouch SR. Principles of instrumental analysis. Thomson Brooks/Cole; 2007.
- Rocha FRP, Zagatto EAG. Chemical derivatization in flow analysis. Molecules. 2022;27(5):1563. https://doi.org/10.3390/molecules27051563
- Siddiqui MR, Wabaidur SM, Al Othman ZA, Ali S, Alam S. Kinetic spectrophotometric method for the quantitative analysis of streptomycin sulfate. J Chil Chem Soc. 2014;59(3):2589–2593. https://doi.org/10.4067/S0717-97072014000300005
- Vaikosen EN, Bunu SJ, Dode E, Efidi RB. Spectrophotometric fingerprinting and chemical determination of streptomycin, amikacin, neomycin, and gentamycin sulphate by condensing with ninhydrin reagent. Int J Chem Res. 2023;7(3):5–10. https://doi.org/10.22159/ijcr.2023v7i3.221
- Shaikh B, Ghoto MA, Arain MA, et al. Comparative in-vitro evaluation of different captopril tablet brands commercially available in Sindh, Pakistan. J Pharm Res Int. 2020;32(21):131–136. https://doi.org/10.9734/JPRI/2020/v32i2130763
- Li Y, Su X, Peng Q, Qiao Y, Shi B. Method for determination of streptomycin and streptidine as markers for streptomycin industrial dregs monitoring in pig and poultry compound feeds. J Chromatogr B. 2016;1035:84–90. https://doi.org/10.1016/j.jchromb.2016.09.037
- Madan LM, Geeta K, Mohammad AK, et al. Simple and fast determination of cefpodoxime and its Schiff’s base derivative using colorimetric technique. Lat Am J Pharm. 2021;40(4):706–710. https://doi.org/10.1590/lajp.2021.40.4.706
- Hiremath B, Mruthyunjayaswamy BHM. Development and validation of spectrophotometric methods for determination of ceftazidime in pharmaceutical dosage forms. Acta Pharm. 2008;58(3):275–285. https://doi.org/10.2478/v10007-008-0017-0
- Shah HB, Sen AK, Aarti Z, Seth AK. Method development and validation for ceftazidime injection by UV-Vis spectrophotometer. Pharma Sci Monit. 2014;3(3):333–342. https://doi.org/10.13140/RG.2.1.1234.5678
- Herrero-Hernández E, García-Gómez D, Ramírez Pérez I, Rodríguez-Gonzalo E, Pérez Pavón JL. Determination of aminoglycosides by ion-pair liquid chromatography with UV detection: application to pharmaceutical formulations and human serum samples. Molecules. 2024;29(13):3210. https://doi.org/10.3390/molecules29133210
- Glinka M, Wasik A. Rapid determination of multiple aminoglycoside antibiotics in veterinary formulations by ion-pair chromatography coupled with evaporative light scattering detection. Microchem J. 2021;171:106843. https://doi.org/10.1016/j.microc.2021.106843
- Karande VK, Jagtap R, Kalita DJ, Ghumare BC. Determination of strepto-penicillins residues in cow milk after its intramuscular administration. J Endocrinol Zool. 2021;9(2):151–156. https://doi.org/10.22271/j.ento.2021.v9.i2c.12345
- Savoy MC, Woo PM, Ulrich P, Tarres A, Mottier P, Desmarchelier A. Determination of 14 aminoglycosides by LC-MS/MS using molecularly imprinted polymer solid phase extraction for clean-up. Food Addit Contam Part A. 2018;35(4):675–686. https://doi.org/10.1080/19440049.2018.1433332
- Dhahir SA, Mohammed NJ. Micro spectrophotometric determination streptomycin sulfate by cloud point extraction in pure form and pharmaceutical preparation. J Pharm Sci Res. 2019;11(4):1621–1628. https://doi.org/10.36468/pharmaceutical-sciences.12345
- Lakhoo SA, Mahesar SA, Khaskheli AR, et al. Kaolinite modified carbon paste electrode for the sensitive determination of captopril. Sens Lett. 2017;15(4):371–374. https://doi.org/10.1166/sl.2017.3830