Pathogenicity Prediction of Potential Variants in TULP1 Gene causing Hereditary RP: An In-silico Approach
Faryal Sadiq*
Department of Life Sciences, University of Management & Technology, Lahore, Pakistan
Abstract
Retinitis Pigmentosa (RP) is a term used to describe a group of eye disorders related to retina damage. Due to the formation of bone spicules inside the retina of the affected individuals, patients suffer from poor eye vision or complete blindness, rarely. The reason of the disease could be genetic defects or environmental factors, for instance comorbidity, light exposure, and ethnicity. Tubby-like protein (TULP1) is expressed in the retina of the eye, specifically inside rod and cone cells, and mutations inside the gene can cause changes in structure and function of photoreceptor cells. The current study may provide new insights to understand the genetic variations found in TULP1 gene from the genomic to proteomic level, thus predicting the highly pathogenic variations causing RP. Different bioinformatic tools employing different algorithms were used to score the pathogenic variants, hence cross validating the results. Twenty (20) pathogenic missense variants which can destroy the protein structure as discussed in the study, thirteen (13) splice site variants, and lastly, nine (9) frameshift, seven (7) stop-gained variants were concluded as highly pathogenic for the candidate gene.
Introduction
Eye is the main organ associated with vision and is a major part of the sensory nervous system. Poor eye vision or blindness can directly affect the quality of life. Several retinal damaging conditions including glaucoma, retinal vascular disease, and macular degeneration associated with aging, are known to affect approximately 60 million people worldwide. Some eye disorders occur due to certain environmental factors, for instance aging and poor health conditions. While, some are heredity traits where RP is among the most prominent. Approximately, one hundred (100) genes have been observed to cause hereditary RP. RP is a vast terminology used to group eye disorders with retinal damages leading to poor vision and in rare cases complete night blindness [1]. The prevalence ratio of RP is 1/3500 around the world [2].
There are two types of RP stated as non-syndromic RP and syndromic RP. Non-syndromic RP is related to poor vision and has been found to affect 70-80% of the people and is a more common type of RP. The incidence rate for non-syndromic RP is 1/5000, while carrier ratio observed is 1/1000. The other type of RP is syndromic RP where the retinal damage combines with some other systemic dysfunction. Usher syndrome is the typical example of syndromic RP in which vision loss conjugates with hearing disabilities [3].
The risk factor to transfer the hereditary disorders including hereditary RP as well as spastic paraplegia is high in South Asian region. As reported by statistical data, the autosomal recessive RP with the number of 60 genes is known to be involved [4].
TULP1 gene is an important member of TULP (Tubby-like protein) family and is found in retinal epithelial cells. TULP1, as a transmembrane protein, mainly functions in protein trafficking and has the tendency to bind with lipids forming phosphatidylserine, phosphatidylinositol, 3,4,5-bisphosphate, phosphatidic acid, 4,5-bisphosphate, 3,4-bisphosphate, phosphatidylinositol 5-phosphate, phosphatidylinositol 4-phosphate, and phosphatidylinositol 3-phosphate. TULP1 also functions in the cleaning of dead cells inside the retina and is involved in cell apoptosis/phagocytosis [5].
TULP1 gene with genomic size 14997 base pairs (15 exome count) is located on human chromosome 6, on the antisense strand of DNA (Deoxyribonucleic Acid) double helix. TULP1 gene encodes protein with 542 amino acids (Figure 1).
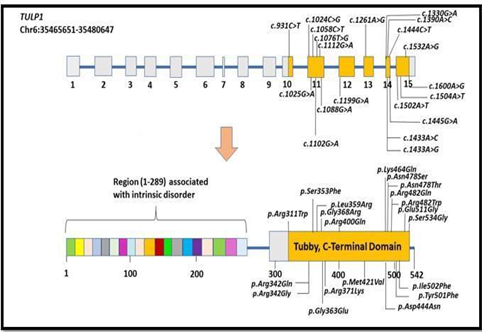
Figure 1. Pathogenic variants observed from cDNA (SNV) to protein. (An illustration of TULP1 gene (containing 15 exons, locates at 6p21.32) to protein translation (encoding 542 amino acid residues, region ranges between 298-542 covers a conserved C-Terminal domain and region between 1-289 linked with intrinsic disorder))
In the analysis of the current study, results were crossmatched using different tools and databases with different algorithms. The importance of algorithm designing was reflected upon for any biologist or healthcare expert. Not all the tools or software are 100% error free, however, still can be a helping hand for the scientists to make authentic predictions. Presently, scientists prefer dry lab practices before proceeding to wet lab experiments. This is because it is a more helpful approach in a limited time span for the scientists to predict the structure of any biological molecule even if it has not been discovered yet via using these tools or databases [6].
2. MATERIALS AND METHODS
TULP1 genomic variants were retrieved through gnomAD. Missense variants, splice site variants, frameshift, and stop-gained variants were analyzed for their pathogenicity grading using multiple tools. Protein functioning was observed through visualization tool. Streamline followed for the insilico approach is shown in Figure 2.
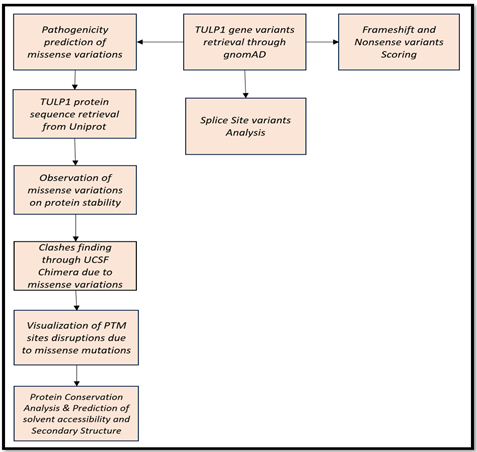
Figure 2. Flowchart to carry out TULP1 Gene Variants Analysis
2.1. Variants Retrieval
To study the effect of SNPs reported for TULP1 gene, these were retrieved from gnomAD gnomAD - Broad Institute, containing millions of SNVs (Single Nucleotide Variants) data available for human genome in both genome assemblies (GRCh37 and GRCh38) [7]. The number of variants obtained for TULP1 is shown in Figure 3.
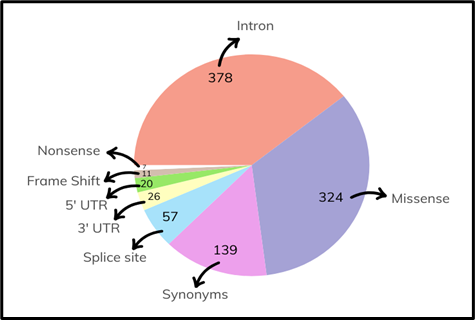
Figure 3. Distribution of SNPs in TULP1 Gene
2.2. Analyzing Missense Variants
TULP1 missense variants were scored with a very low allelic frequency. Combined Annotation Dependent Depletion (CADD) tool was designed on machine learning (ML) algorithm combining more than 63 annotations. Variants with CADD C-Score range between 10-20 are considered highly pathogenic [8]. Variants with CADD C-score ≥ 10 were further analyzed using multiple tools, for instance CAPICE [9], REVEL, PMut, UMD-Predictor, and Predict SNP2.0 Mutation Assessor. Quality control of missense variants was verified using different parameters which included checking the protein stability using stability tools, (CUPSAT, iStable [10], DynaMut [11], MAESTRO, YASARA [12]) and Clashes finding inside the protein structure as well as PTM sites analysis through UCSF Chimera [13]. To observe the candidate gene functioning caused by variations, conservation ratio and secondary structures were also observed via ConSurf and NetSurfP-2.0 [14].
2.3. Splice Site, Frameshift, and Nonsense Variants Analysis
Scoring of TULP1 splice site variants was performed to screen out the highly pathogenic variants for disrupting the splicing mechanism. SPiCEv2.15 [15], Spliceman, Mutation T@ster [16] tools were used for variant analysis.
Frameshift and nonsense variants scoring was performed using CADD.
3. RESULTS
3.1. Analyzing Missense Variations
Through gnomAD, total number of 324 missense variants for candidate gene (TULP1) (allelic frequency <0.001 and allelic count < 50) were obtained. CADD scored 274 variants as pathogenic variants with C score ≥ 10. Most of the tools set a threshold value of 0.5, while variants score above 0.5 are considered pathogenic. To filter out the highly pathogenic variants, multiple tools were used, that is, CAPICE [9], REVEL, PMut, UMD-Predictor [17], Predict-SNP2.0, and Mutation Assessor. Lastly, only 20 missense variants with CAPICE score ≥ 0.5 were filtered out as "highly pathogenic" (Table 1). These twenty missense variants were further analyzed for candidate protein functioning. Graphical representation of CADD and CAPICE scoring of missense variants can be seen in Figure 4 (a).
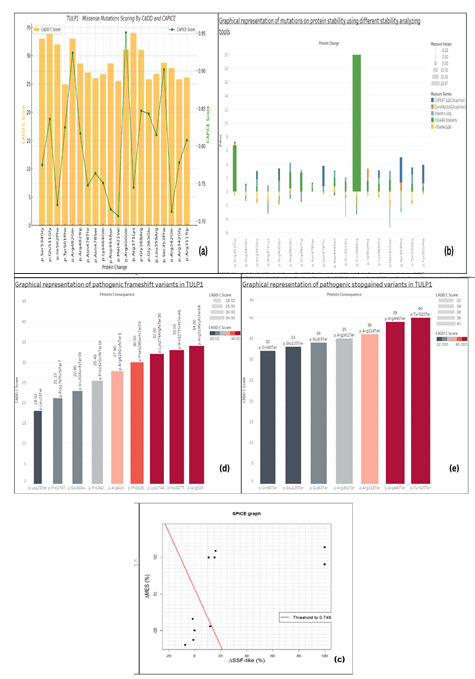
Figure 4. Graphical Representation of pathogenic TULP1 genomic variants scoring (a) highly pathogenic missense variants using (CADD & CAPICE scoring). (b) protein Stability tools scoring vs missense variants (c) Splice site variants through SPiCE (Considering the Red line as threshold and dots above the threshold are variants affecting splicing while dots below threshold are less deleterious variants for splicing disturbance) (d) Pathogenic frameshift variants scoring by CADD (e) Stopgained variants by CADD
Table 1. TULP1 Pathogenic Missense Pathogenic Variants Scoring Obtained using Different Tools
|
Nucleotide Change |
Protein Change |
CADD C Score |
CAPICE Score |
REVEL Score |
PMut Predicted Score |
UMD-Predictor Prediction |
Predict-SNP2.0 Prediction |
Mutation Assessor Prediction |
|
6:35466133T>C |
p.Ser534Gly |
33 |
Deleterious 0.775 |
Deleterious 0.917 |
Deleterious 0.91 |
Pathogenic 0.84 |
Pathogenic 1 |
High 3.865 |
|
6:35466201T>C |
p.Glu511Gly |
34 |
Deleterious 0.836 |
Deleterious 0.71 |
Deleterious 0.68 |
Pathogenic 0.84 |
Pathogenic 1 |
High 3.02 |
|
6:35466229T>A |
p.Ile502Phe |
32 |
Deleterious 0.722 |
Deleterious 0.914 |
Deleterious 0.79 |
Pathogenic 0.78 |
Pathogenic 0.076 |
High 3.06 |
|
6:35466231T>A |
p.Tyr501Phe |
24.9 |
Deleterious 0.825 |
Deleterious 0.858 |
Deleterious 0.87 |
Probably Pathogenic 0.69 |
Pathogenic 0.076 |
Medium 2.945 |
|
6:35467808C>T |
p.Arg482Gln* |
33 |
Deleterious 0.924 |
Deleterious 0.942 |
Deleterious 0.92 |
Pathogenic 0.84 |
Pathogenic 1 |
High 3.955 |
|
6:35467809G>A |
p.Arg482Trp* |
28.6 |
Deleterious 0.817 |
Deleterious 0.966 |
Deleterious 0.92 |
Pathogenic 0.93 |
Pathogenic 0.122 |
High 3.955 |
|
6:35467820T>G |
p.Asn478Thr |
27 |
Deleterious 0.748 |
Deleterious 0.952 |
Deleterious 0.87 |
Pathogenic 0.81 |
Pathogenic 1 |
High 3.905 |
|
6:35467820T>C |
p.Asn478Ser |
26 |
Deleterious 0.764 |
Deleterious 0.949 |
Deleterious 0.92 |
Pathogenic 0.84 |
Pathogenic 1 |
High 3.905 |
|
6:35467863T>G |
p.Lys464Gln |
26.7 |
Deleterious 0.751 |
Deleterious 0.93 |
Deleterious 0.92 |
Pathogenic 0.84 |
Pathogenic 1 |
High 3.345 |
|
6:35467923C>T |
p.Asp444Asn* |
28.6 |
Deleterious 0.716 |
Deleterious 0.541 |
Neutral 0.44 |
Probably Pathogenic 0.69 |
Pathogenic 1 |
Medium 2.945 |
|
6:35471398T>C |
p.Met421Val |
25.5 |
Deleterious 0.707 |
Deleterious 0.949 |
Deleterious 0.9 |
Probably Pathogenic 0.72 |
Pathogenic 1 |
High 3.935 |
|
6:35471539C>T |
p.Arg400Gln* |
31 |
Deleterious 0.951 |
Deleterious 0.964 |
Deleterious 0.8 |
Probably Pathogenic 0.72 |
Pathogenic 1 |
High 3.455 |
|
6:35473518C>T |
p.Arg371Lys |
34 |
Deleterious 0.745 |
Deleterious 0.897 |
Deleterious 0.71 |
Pathogenic 1 |
Pathogenic 1 |
Medium 2.945 |
|
6:35473528C>T |
p.Gly368Arg |
31 |
Deleterious 0.847 |
Deleterious 0.965 |
Deleterious 0.91 |
Pathogenic 1 |
Pathogenic 1 |
High 3.89 |
|
6:35473542C>T |
p.Gly363Glu |
25.8 |
Deleterious 0.843 |
Deleterious 0.948 |
Deleterious 0.79 |
Pathogenic 0.99 |
Pathogenic 1 |
High 3.42 |
|
6:35473554A>C |
p.Leu359Arg |
26.8 |
Deleterious 0.815 |
Deleterious 0.993 |
Deleterious 0.83 |
Pathogenic 0.93 |
Pathogenic 1 |
High 3.64 |
|
6:35473572G>A |
p.Ser353Phe |
28.7 |
Deleterious 0.902 |
Deleterious 0.981 |
Deleterious 0.77 |
Pathogenic 0.96 |
Pathogenic 1 |
High 3.205 |
|
6:35473605C>T |
p.Arg342Gln* |
27.8 |
Deleterious 0.713 |
Deleterious 0.855 |
Deleterious 0.89 |
Pathogenic 0.84 |
Pathogenic 1 |
High 3.32 |
|
6:35473606G>C |
p.Arg342Gly |
25.8 |
Deleterious 0.778 |
Deleterious 0.724 |
Deleterious 0.89 |
Pathogenic 1 |
Pathogenic 1 |
High 3.665 |
|
6:35473848G>A |
p.Arg311Trp* |
26.1 |
Deleterious 0.808 |
Deleterious 0.885 |
Deleterious 0.89 |
Pathogenic 0.93 |
Pathogenic 1 |
High 3.12 |
(UMD predictor score predictions were divided by 100 to homogenize the data.)
Mutations with Asterisk (*) sign have already been reported in ClinVar and the rest are novel.
3.3.1. Effect of Missense Variations on Protein Stability. Highly pathogenic missense variants were analyzed by CUPSAT, i-Stable, DynaMut, MAESTRO, and YASARA scoring methods for stability check against each variant. Negative scores indicate the destabilizing effect of mutations on protein structure and vice versa for positive scores. In YASARA, variants with positive scores show decreasing protein energy due to the variant (Table 2).
Graphical representation of stability scores by tools used can be seen in Figure 4(b).
3D structure was modeled for TULP1 protein with missense variations through UCSF Chimera (Figure 5).
Table 2. Stability Score using Stability Tools to Analyze the Effect of Missense Mutations on Protein
|
Protein Change |
CUPSAT Predicted ΔΔG (kcal/mol) |
iStable Predicted ΔΔG (kcal/mol) |
DynaMut Predicted ΔΔG (kcal/mol) |
MAESTRO Predicted ΔΔG (kcal/mol) |
YASARA Stability Prediction (kcal/mol) |
|
p.Arg400Gln |
Stabilizing 1.73 |
Decrease -0.640 |
Destabilizing -0.519 |
Increase 1.645 |
Increasing -0.718972 |
|
p.Arg482Gln |
Destabilizing -0.69 |
Increase 0.458 |
Destabilizing -0.404 |
Increase 1.424 |
Decreasing 2.3409 |
|
p.Ser353Phe |
Stabilizing 3.73 |
Increase 0.071 |
Stabilizing 1.217 |
Decrease -0.896 |
Increasing -2.1339 |
|
p.Gly368Arg |
Destabilizing -1.42 |
Decrease -0.639 |
Destabilizing -0.933 |
Decrease -0.393 |
Decreasing 19.9686 |
|
p.Glu511Gly |
Destabilizing -2.9 |
Decrease -0.535 |
Destabilizing -0.328 |
Increase 0.645 |
Decreasing 1.43369 |
|
p.Tyr501Phe |
Stabilizing 2.68 |
Decrease -0.230 |
Destabilizing -0.161 |
Increase 0.529 |
Decreasing 0.67915 |
|
p.Arg482Trp |
Destabilizing -1.56 |
Decrease -0.009 |
Stabilizing 0.051 |
Increase 0.385 |
Decreasing 2.77073 |
|
p.Arg311Trp |
Stabilizing 0.22 |
Decrease -0.345 |
Stabilizing 0.29 |
Decrease -0.183 |
Decreasing 6.73481 |
|
p.Arg342Gly |
Stabilizing 1.22 |
Decrease -1.052 |
Destabilizing -0.655 |
Increase 1.054 |
Decreasing 0.735874 |
|
p.Ser534Gly |
Stabilizing 1.02 |
Decrease -1.283 |
Destabilizing -0.47 |
Increase 1.401 |
Decreasing 1.09835 |
|
p.Asn478Thr |
Stabilizing 2.95 |
Decrease -0.230 |
Destabilizing -0.125 |
Increase 0.632 |
Decreasing 0.1565 |
|
p.Lys464Gln |
Stabilizing 1.11 |
Decrease -0.592 |
Destabilizing -0.233 |
Increase 0.911 |
Decreasing 1.09376 |
|
p.Asn478Ser |
Stabilizing 0.22 |
Decrease -0.054 |
Stabilizing 0.114 |
Increase 0.553 |
Decreasing 0.424982 |
|
p.Arg371Lys |
Destabilizing -1.62 |
Decrease -0.911 |
Destabilizing -0.721 |
Increase 0.831 |
Decreasing 0.071761 |
|
p.Ile502Phe |
Destabilizing -0.07 |
Decrease -0.545 |
Stabilizing 1.305 |
Increase 0.510 |
Decreasing 1.53253 |
|
p.Asp444Asn |
Destabilizing -0.39 |
Increase 0.752 |
Destabilizing -0.176 |
Increase 1.108 |
Decreasing 1.22898 |
|
p.Arg342Gln |
Stabilizing 0.33 |
Decrease -0.639 |
Destabilizing -0.48 |
Increase 0.810 |
Increasing -0.285053 |
|
p.Met421Val |
Destabilizing -3.23 |
Decrease -1.213 |
Destabilizing -0.816 |
Increase 1.324 |
Decreasing 1.67459 |
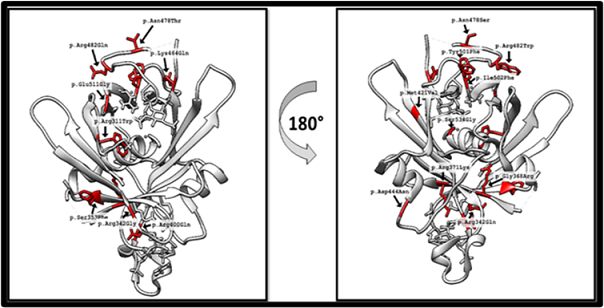
Figure 5. TULP1 3D Structure Visualization by Angle Rotation of 180 Degrees (red area marked the mutated sites)
3.3.2. Clashes Finding due to Missense Variations. Clashes can be simply termed as unnecessary/unwanted contacts due to mutations,thereby changing the confirmation. Clashes were observed using UCSF Chimera.
Clashes were determined in mutations reported; p.Gly368Arg in which no clashes/contacts were found in wild type structure, while for mutated type 46, contacts were found.
p.Glu511Gly: no clashes were found for both wild type and mutant type, p.Tyr501Phe: no clashes were found for wild type. Whereas, 9 contacts including interaction with water molecule were observed for mutant type (Yellow color indicating the wild type of residue and purple color showing the mutant residue whereas red lines showing the contacts found, blue colored balls showing the water molecules) (Figure 6).
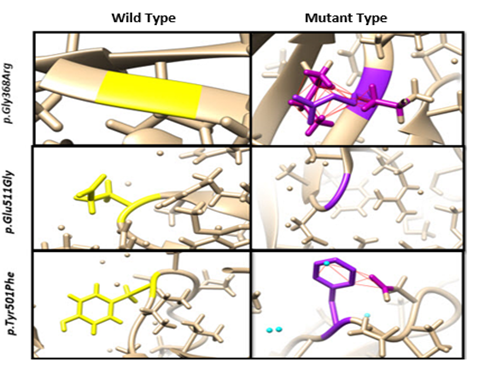
Figure 6. Clashes Findings due to Missense Mutations in Candidate Protein Structure using UCSF Chimera
3.3.3. PTM Site Disruption by Missense Variants. PTM sites inside candidate protein were confirmed using PROSITE database.
Phosphorylation sites with different protein kinase were observed and visualized in protein structure using UCSF Chimera. Some of the missense variations were found to disturb some phosphorylation sites, hence hindering the cellular processes (Figure 7).
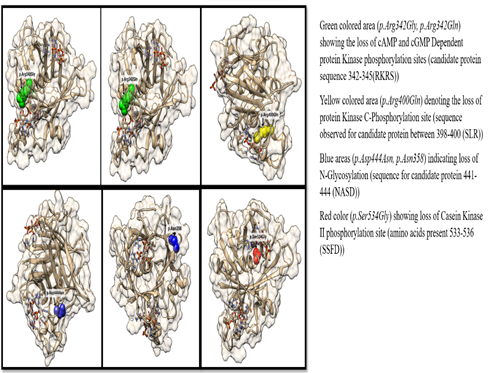
Figure 7. PTM sites Disruptions Visualization through UCSF Chimera
3.3.4. Protein Conservation and Secondary Structure Prediction. Candidate protein (TULP1) has a single C-Terminal domain. To observe the conservation, ConSurf was used for analysis. ConSurf prediction scoring is done in terms of color grading (1-9) in which 1-4 grades are variables, grade 5 as average, and 6-9 color grade indicates highly conserved amino acid residues inside protein sequence.
NetSurfP-2.0 predicts surface accessibility as RSA (Relative Surface Accessibility), ASA (Absolute Surface Accessibility) and also provides information for secondary structures (coil, helix, strand) present in a protein. For secondary structures (loops or coils) inside TULP1 protein and to observe that amino acids are buried/exposed to the surface in sequence, NetSurfP-2 was used. Table 3, visuals seen in Figure 8.
Table 3. TULP1 Protein Conservation Prediction due to Missense Mutations using ConSurf and Solvent Accessibility, Secondary Structure Prediction by NetSurfP-2.0
|
ConSurf |
NetSurfP-2.0 |
||||
|
Protein Change |
Score |
Grade |
RSA |
ASA (Å) |
Sec. Structure/exposed/Buried |
|
p.Arg400Gln* |
-0.905 |
8 |
51% |
116 |
Coil/Exposed |
|
p.Arg482Gln* |
-1.199 |
9 |
52% |
119 |
Coil/Exposed |
|
p.Ser353Phe |
-0.962 |
9 |
4% |
4 |
Strand/Buried |
|
p.Gly368Arg |
-0.866 |
8 |
3% |
2 |
Strand/Buried |
|
p.Glu511Gly |
0.225 |
4 |
82% |
144 |
Coil/Exposed |
|
p.Tyr501Phe |
0.338 |
4 |
34% |
73 |
Coil/Exposed |
|
p.Arg482Trp* |
-1.199 |
9 |
52% |
119 |
Coil/Exposed |
|
p.Arg311Trp* |
-1.102 |
9 |
26% |
59 |
Strand/Exposed |
|
p.Arg342Gly |
-0.577 |
7 |
32% |
73 |
Strand/Exposed |
|
p.Ser534Gly |
-1.115 |
9 |
10% |
12 |
Helix/Buried |
|
p.Asn478Thr |
-0.932 |
8 |
39% |
57 |
Strand/Exposed |
|
p.Lys464Gln |
-0.9 |
8 |
36% |
74 |
Coil/Exposed |
|
p.Asn478Ser |
-0.932 |
8 |
39% |
57 |
Strand/Exposed |
|
p.Arg371Lys |
-0.881 |
8 |
30% |
68 |
Strand/Exposed |
|
p.Ile502Phe |
-0.467 |
7 |
8% |
16 |
Strand/Buried |
|
p.Asp444Asn* |
0.225 |
4 |
52% |
74 |
Coil/Exposed |
|
p.Arg342Gln* |
-0.577 |
7 |
32% |
73 |
Strand/Exposed |
|
p.Met421Val |
-1.063 |
9 |
3% |
6 |
Strand/Buried |
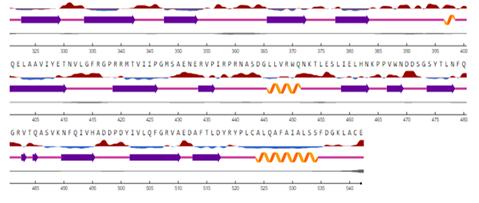
Figure 8. TULP1 Protein Secondary Structure Prediction by NetSurfP-2.0. Surface Accessibility=Red high ground indicating exposed amino acids while sky blue downward high areas showing the buried residue in protein, considering threshold as 25%. Secondary Structure= straight pink line depicting coil, orange spirals are helix, colored arrow (indigo) indicating strand. Disorder= just under the secondary structure prediction line is thick black line showing the chances of disordered residues, the thicker the line, the higher the risk of disordered residues there. (as shown in figure 1)
3.2. Splice Site Variants Analysis
By gnomAD, 57 splice site variants were obtained for candidate gene (TULP1). Seven (7) variants were canonical splice site variants (splice site donor=4, splice site acceptor=3). The remaining 50 variants were scored using CADD. Thirteen (13) variants with CADD score ≥ 15 were scored by splicing tools (SPiCE v2.1.5, Spliceman, Mutation T@ster) (Table 4 & Figure 4 (c)).
Table 4. TULP1 Pathogenic Splice Site Variants Score
|
Nucleotide Change |
Transcript Consequence |
CADD C Score |
Mutation T@ster Prediction |
Spliceman Prediction |
SPiCE Prediction |
||||
|
Score |
L1 distance |
Rank (L1) |
delta_MES |
delta_SSF |
probability |
inter_thrRes |
|||
|
6:35466243G>T |
c.1496-6C>A* |
17.15 |
(Polymorphism) 0.999 |
32669 |
55% |
-0.16 |
0.014 |
0.06131 |
low |
|
6:35467757C>T |
c.1495+1G>A* |
35 |
(deleterious) 1 |
33807 |
61% |
-0.905 |
-1 |
1 |
high |
|
6:35471626C>G |
c.1113-1G>C |
33 |
0 |
36693 |
76% |
0 |
0 |
0.02686 |
low |
|
6:35477091T>C |
c.719-2A>G |
33 |
(Deleterious) 1 |
36552 |
75% |
-1.139 |
-1 |
1 |
high |
|
6:35477096G>T |
c.719-7C>A |
21.4 |
(Polymorphism) 0.999 |
34935 |
67% |
0.133 |
0.009 |
0.00688 |
low |
|
6:35477534G>C |
c.602-7C>G* |
15.05 |
(Polymorphism) 0.999 |
32943 |
57% |
0 |
0 |
0.02686 |
low |
|
6:35477600T>C |
c.601+4A>G |
17.8 |
(Deleterious) 0.999 |
35062 |
68% |
-0.057 |
-0.12 |
0.68004 |
low |
|
6:35477602A>C |
c.601+2T>G |
32 |
(Deleterious) 1 |
36446 |
75% |
-1 |
-0.108 |
0.9997 |
high |
|
6:35478633C>G |
c.499+5G>C |
22.9 |
(Deleterious) 0.538 |
34706 |
66% |
0 |
0 |
0.02686 |
low |
|
6:35478636A>C |
c.499+1dupG |
26.6 |
(Deleterious) 0.997 |
36014 |
72% |
-1 |
-0.154 |
0.99993 |
high |
|
6:35479590C>T |
c.191-7G>A |
21.6 |
(Polymorphism) 0.999 |
35880 |
72% |
0.626 |
0.072 |
2.00E-05 |
low |
|
6:35479952C>T |
c.190+5G>A |
21.1 |
(Polymorphism) 0.999 |
35427 |
69% |
-1.091 |
-0.162 |
0.99998 |
high |
|
6:35480415C>T |
c.99+1G>A* |
33 |
(Deleterious) 1 |
34481 |
65% |
-0.908 |
-1 |
1 |
high |
Asterisk (*) marked protein substitutions have already been reported in ClinVar, while the rest of mutations are novel.
3.3. Frameshift and Nonsense Variants Scoring
Nine (9) frameshift variants and seven (7) nonsense variants with the Allelic frequency filter (≤0.002) were retrieved for TULP1 and scored using CADD. Nine (9) frameshift variations were filtered as highly pathogenic (Table 5). While, stop-gained variations were scored high as compared to frameshift variants. (Table 6) Figure 4(d) and Figure 4(e) show the CADD scoring for frameshift and nonsense variants, respectively.
Table 5. Pathogenic Frameshift Variants in TULP1 Gene
|
Nucleotide Change |
Protein Consequence |
Transcript Consequence |
CADD C Score |
|
6:35466151AG>A |
p.Phe528SerfsTer55 |
c.1581delC |
30 |
|
6:35466177CG>C |
p.Arg519GlyfsTer64 |
c.1555delC |
34 |
|
6:35471403CG>C |
p.Arg419GlyfsTer3 |
c.1255delC |
27.8 |
|
6:35473799TG>T |
p.His327ThrfsTer44 |
c.979delC |
33 |
|
6:35476986CT>C |
p.Lys274ArgfsTer36 |
c.821delA |
32 |
|
6:35477079TTTGG>T |
p.Pro242GlnfsTer16 |
c.725_728delCCAA |
25.4 |
|
6:35477680T>TG |
p.Pro176ThrfsTer7 |
c.524dupC |
21.1 |
|
6:35479998TC>T |
p.Glu50AsnfsTer59 |
c.148delG |
22.9 |
|
6:35480447AG>A |
p.Leu23Ter |
c.67delC |
18.02 |
Table 6. Pathogenic Stop-gained Variants in TULP1 Gene
|
Nucleotide Change |
Protein Consequence |
Transcript Consequence |
CADD C Score |
|
6:35466173G>T |
p.Tyr520Ter* |
c.1560C>A |
40 |
|
6:35471341G>A |
p.Arg440Ter* |
c.1318C>T |
39 |
|
6:35473549G>A |
p.Arg361Ter |
c.1081C>T |
35 |
|
6:35473827G>A |
p.Arg318Ter |
c.952C>T |
36 |
|
6:35478764C>A |
p.Glu125Ter |
c.373G>T |
33 |
|
6:35479536G>A |
p.Gln80Ter* |
c.238C>T |
32 |
|
6:35479960C>A |
p.Gly63Ter |
c.187G>T |
34 |
Asterisk (*) marked protein substitutions have already been reported in ClinVar, while the rest of mutations are novel.
4. DISCUSSION
TULP1 gene variants are very rare and could be responsible for causing autosomal recessive RP. Protein native structure is important for proper functioning. If any sudden change or mutation occurs inside the amino acid sequence of protein, it directly affects its function. The wild structure type is more stable and mutation inside a protein structure can destabilize it. Stability is important for proteins" proper functioning [18].
TULP1 gene variants (missense, frameshift, nonsense, splice site) were scored according to their degree of pathogenicity using CADD. CADD scores the variants on three different ranks, that is, highly pathogenic, moderate, and lower pathogenic, referring to the main score PHRED (C Score). Variants with C score range between 10-20 are considered highly pathogenic [8]. CAPICE (Consequence Agnostic Pathogenicity Interpretation of Clinical Exome) based on ML algorithm outperformed compared to other tools, due to a low false positive rate [9].
After selecting highly pathogenic missense TULP1 variants, the amino acid substitutions were tested for stability. DynaMut predicts scores in two-step algorithms. The first step is utilizing "Holdout Random Sampler" which calculates the energy change represented as Cumulative distribution function. While in the second step, there comes the authentic stability score using cumulative distribution function which trains the final algorithm-"Neural network model" [11]. istable works on "Support Vector machine algorithm". Due to its uniquely designed algorithm, this tool proved a better option as compared to other tools" output for stability check. Both structural or sequential information of protein can be used as input methods [10] (Figure 4 (b)).
Protein with its native folds is crucial for its proper functioning. Mutations change its structure and, hence function. TULP1 encodes 542 amino acids contained protein structure which was visualized using Chimera. 3D structure with pathogenic missense mutations was modeled [13] (figure 5). Variants predicted as pathogenic for TULP1 were also visualized, disturbing PTM sites by 3D modeling (Figure 7).
TULP1 protein is a transmembrane protein involved in cellular trafficking. Therefore, its nearby interactions, cellular contents, and surface accessibility were observed using NetSurfP-2.0 [14]. In ConSurf, MSA is performed followed by constructing a phylogenetic tree and it also shows the conserved regions inside protein structure with colors [19] (Figure 8).
To find out about variants which can directly affect the splicing mechanisms, splicing variants retrieved through gnomAD were analyzed by Spliceman, SPiCE, and Mutation T@ster.
Spliceman based on "distance matrix calculation methods" provides the output as L1 distance. If position vectors are close enough, it denotes high ranks (high L1 distance). The higher the rank, the higher the chances of disturbing splicing sites [20]. SPiCE (Splicing Prediction in the Consensus Elements) tool designed on ML classifier "Logistic Regression" predicting two scores MaxEntScan(MES) and Splice-Site Finder-Like(SSF-Like) also provides output in a graphical form. In graphical representation (Figure 4c), variants above threshold line are considered as highly pathogenic. While, dots denoting the variants below the threshold line are considered neutral. Geneticists can easily apply this in diagnostics for the analysis of NGS results [20].
Probably, more than 100 genes have been found to be involved in causing RP. In the sub-continent, the custom of consanguineous marriages raises the risk of hereditary autosomal recessive RP. ABCA4, RHO, SPATA7, CRB1, and TULP1 gene families are important in Pakistan and Indian populations. This is because they can be the carrier to cause autosomal recessive RP [21].
Some novel genes, for instance ENSA, DDR1, CCDC188, and DACT2 were found to have an important role in vision cycle and ion channeling in photoreceptor cells. In 2020, a study was conducted to highlight the correlation of these four genes (ENSA, DDR1, CCDC188, DACT2) and the study concluded that the two genes (ENSA, DDR1) co-express and correlate in causing RP [22].
Recently, research was conducted to determine the pathogenic variants in TULP1. The results concluded two heterozygous mutations p. Arg482Trp and p. Leu504fs* as highly pathogenic and can cause autosomal recessive RP [23].
Finding the cure for hereditary disorders has always been a challenging task for the scientists. However, the options which have captured the attention of scientists include, cell therapy, retinal prostheses, and gene therapy. Gene therapy involves removing the genetic errors using viral or non-viral vectors followed by gene silencing pathways. Gene therapy implemented using phase3 voretigene neparvovec vector showed a better efficacy rate against inherited RPE65 mediated retinal dystrophy [24].
In 2020, a finding based on statistical data revealed that probably, 2.7 billion people around the globe (about 36% population) may be the healthy carriers for having at least one of the gene variants which may cause RP in future generations [25]. If scientists consider the cases of visual impairment/inherited blindness for detailed experiments, then this could be the road map in discovering new loci and genes causing RP [26].
4.1. Conclusion
RP is generically referred to as a group of heterogeneous eye disorders, where its complicated genetic patterns make it a complex class to study. TULP1 gene is expressed in rod and cone cells of the retina and contributes to 1% autosomal recessive RP. TULP1 gene variants were analyzed through an insilico approach to study the molecular basis of RP and highly pathogenic TULP1 variants were predicted. Predicted pathogenic variants for TULP1 can provide new insights for the scientists to design a treatment line for RP if caused by TULP1 gene variants. Candidate gene variants were cross-checked with different pathogenicity, predicting algorithms using different tools or databases to make predicted pathogenic scoring more authentic and reliable. Predicted pathogenic variants can be confirmed following wet lab experiments from blood sampling to sequencing.
Conflict of Interest
The author of the manuscript has no financial or non-financial conflict of interest in the subject matter or materials discussed in this manuscript.
Data Availability Statement
The data associated with this study will be provided by the corresponding author upon request.
Funding details
This research did not receive grant from any funding source or agency.
Bibliography
- Yang S, Zhou J, Li D. Functions and diseases of the retinal pigment. Front Pharmacol. 2021;12:e727870. https://doi.org/10.3389/fphar.2021.727870
- Cross N, van Steen C, Zegaoui Y, Satherley A, Angelillo L. Retinitis pigmentosa: burden of disease and current unmet needs. Clin Ophthalmol. 2022;16:1993–2010. https://doi.org/10.2147/OPTH.S365486
- Peng JJ, Song WT, Yao F, et al. Involvement of regulated necrosis in blinding diseases: focus on necroptosis and ferroptosis. Exp Eye Res. 2020;191:e107922. https://doi.org/10.1016/j.exer.2020.107922
- Fry LE, McClements ME, MacLaren RE. Analysis of pathogenic variants correctable with CRISPR base editing among patients with recessive inherited retinal degeneration. JAMA Ophthalmol. 2021;139(3):319–328. https://doi.org/10.1001/jamaophthalmol.2020.6418
- Hong JJ, Kim KE, Park SY, et al. Differential roles of Tubby family proteins in ciliary formation and trafficking. Mol Cells. 2021;44(8):591–601. https://doi.org/10.14348/molcells.2021.0082
- Brogi S, Ramalho TC, Kuca K, Medina-Franco JL, Valko M. Editorial: in silico methods for drug design and discovery. Front Chem. 2020;8:e612. https://doi.org/10.3389/fchem.2020.00612
- Koch L. Exploring human genomic diversity with gnomAD. Nat Rev Genet. 2020;21:e448. https://doi.org/10.1038/s41576-020-0255-7
- Schubach M, Maass T, Nazaretyan L, Roner S, Kircher M. CADD v1.7: using protein language models, regulatory CNNs, and other nucleotide-level scores to improve genome-wide variant prediction. Nucleic Acids Res. 2024;52(D1):D1143–D1154. https://doi.org/10.1093/nar/gkad989
- Li S, van de Velde J, de Ridder D, et al. CAPICE: a computational method for consequence-agnostic pathogenicity interpretation of clinical exome variations. Genome Med. 2020;12:e75. https://doi.org/10.1186/s13073-020-00775-w
- Chen CW, Lin MH, Liao CC, Chang HP, Chu YW. iStable 2.0: predicting protein thermal stability changes by integrating various characteristic modules. Comput Struct Biotechnol J. 2020;18:622–630. https://doi.org/10.1016/j.csbj.2020.02.021
- Rodrigues CHM, Pires DEV, Ascher DB. DynaMut2: assessing changes in stability and flexibility upon single and multiple point missense mutations. Protein Sci. 2020;30(1):60–69. https://doi.org/10.1002/pro.3942
- Ozvoldik K, Stockner T, Krieger E. YASARA model: interactive molecular modeling from two dimensions to virtual realities. J Chem Inf Model. 2023;63(20):6177–6182. https://doi.org/10.1021/acs.jcim.3c01136
- Meng EC, Goddard TD, Pettersen EF, et al. UCSF ChimeraX: tools for structure building and analysis. Protein Sci. 2023;32(11):e4792. https://doi.org/10.1002/pro.4792
- Hoie MH, Kiehl EN, Peterson B, et al. NatSurfP-3.0: accurate and fast prediction of protein structural features by protein language models and deep learning. Nucleic Acids Res. 2022;50(W1):W510–W515. https://doi.org/10.1093/nar/gkac439
- Riolo G, Cantara S, Ricci C. What's wrong in a jump? prediction and validation of splice site variants. Methods Protoc. 2021;4(3):e62. https://doi.org/10.3390/mps4030062
- Steinhaus R, Proft S, Schuelke M, et al. MutationTaster2021. Nucleic Acids Res. 2021;49(W1):W446–W451. https://doi.org/10.1093/nar/gkab266
- Suybeng V, Keoppel F, Harle A, Rouleau E. Comparison of pathogenicity prediction tools on somatic variants. J Mol Diagn. 2020;22(12):1383–1392. https://doi.org/10.1016/j.jmoldx.2020.08.007
- Fang J. A critical review of five machine learning-based algorithms for predicting protein stability changes upon mutation. Brief Bioinform. 2020;21(4):1285–1292. https://doi.org/10.1093/bib/bbz071
- Rubin M, Tal NB. Using ConSurf to detect functionality important regions in RNA. Curr Protoc. 2021;1: https://doi.org/10.1002/cpz1.270
- Riolo G, Cantara S, Ricci C. What"s wrong in a jump? Prediction and validation of splice site variants. Methods Proto. 2021;4(3):e62. https://doi.org/10.3390/mps4030062
- Zafar S, Ahmad K, Ali A, Baig R. Retinitis pigmentosa genes implicated in South Asian populations: a systematic review. J Pak Med Assoc. 2018;67(11):1734–1739.
- Yi Z, Ouyang J, Sun W, Xiao X, Zhang Q. Comparative exome sequencing reveals novel candidate genes for retinitis pigmentosa. 2020;56:e102792. https://doi.org/10.1016/j.ebiom.2020.102792
- den Hollander AI, van Lith-Verhoeven JJC, Arends ML, et al. Novel compound heterozygous TULP1 mutations in a family with severe early-onset retinitis pigmentosa. Arch Ophthalmol. 2007;125(7):932–935. https://doi.org/10.1001/archopht.125.7.932
- Dias MF, Joo K, Kemp JA, et al. Molecular genetics and emerging therapies for retinitis pigmentosa: basic research and clinical perspectives. Prog Retin Eye Res. 2018;63:107–131. https://doi.org/10.1016/j.preteyeres.2017.10.004
- Hanay M, Rivolta C, Sharon D. Worldwide carrier frequency and genetic prevalence of autosomal recessive inherited retinal diseases. Proc Natl Acad Sci U S A. 2020;117(5):2710–2716. https://doi.org/10.1073/pnas.1913179117
- Chan S, Freund P, MacDonald I. Advances in the genetics of eye diseases. Curr Opin Pediatr. 2013;25(6):645–652. https://doi.org/10.1097/MOP.0000000000000026