Morphological and Genetic Identification of Fish Species of River Ravi, Pakistan
Ayesha Eeman1, Saima Naz1*, Ahmad Manan Mustafa Chatha2, and Syeda Saira Iqbal3
1Department of Zoology, Government Sadiq College Women University, Bahawalpur, Pakistan
2Department of Entomology, The Islamia University of Bahawalpur, Pakistan
3Sustainable Development Study Centre, Government College University, Lahore, Pakistan
Abstract
DNA barcoding is a method that examines a specific part of the mitochondrial genome known as the cytochrome c oxidase subunit I (COI) gene, for species identification and biodiversity studies. The current study assessed the effectiveness of using the COI gene for the identification of fish species by constructing a phylogenetic tree with the help of a reference database of fish from the Head Balloki, River Ravi, Pakistan. A total of 15 fish species were analyzed with a 685-base pair (bp) segment of the mitochondrial COI gene sequenced (or "barcoded") for each species. These species represented 15 genera, 10 families, and 6 orders. On average, the sequences were 630 base pairs long. In terms of base composition, the average T content was the highest, while the average G content was the lowest. The AT content (54.1%) was higher than the GC content (45.9%). An analysis of nucleotide pair frequencies across the dataset revealed that out of 685 sites, 385 (56.20%) were conserved within the sequence. Of the 685 sites, 294 sites (42.92%) were variable and 226 (33%) were parsimony informative, while 66 of 685 sites (9.64%) were singletons. In the dataset, transitional pairings (si= 64) were more common than trans-versional pairings (sv = 57), with a si/sv (R) ratio of 1.1. On average, there were 483 pairs where the nucleotides were the same (ii). The average frequencies of nucleotide bases in these sequences were as follows: T (28.8%), C (28.1%), A (25.3%), and G (17.8%). The average Kimura two-parameter (K2P) distances within species, families, and orders were 0.24±0.01%, 0.24±0.02%, and 0.24±0.01%, respectively. Although, each species has a distinct cox1 sequence, various species might occasionally have similar haplotypes. In order to investigate evolutionary links, the maximum likelihood analysis approach was merged with the barcode-based method. In line with the taxonomy categories, the phylogenetic tree generated various groupings that were verified. The current study showed that cox1 sequencing, or DNA barcoding, is a useful method to accurately identify fish species based on both genetic and morphological characteristics.
Introduction
Fish constitute around half of all vertebrate species globally, inhabiting a wide range of aquatic environments. Of roughly 39,900 known vertebrate species, approximately 21,723 are fish, with freshwater and marine species numbering 8,411 and 11,650, respectively [1]. Pakistan is known for its abundant fish species found in its natural water bodies including rivers, lakes, and wetlands. These aquatic environments play a crucial role in supporting a diverse range of fish which, in turn, contribute significantly to the country's biodiversity and serve as vital resources for livelihoods and sustenance [2]. In Pakistan, the number of freshwater fish species is estimated to range from 171 to 193 [3]. River Ravi, a tributary of Indus River, is home to a variety of fish that contribute significantly to Pakistan's aquatic biodiversity. Despite facing multiple challenges, such as pollution and habitat degradation, River Ravi continues to support an abundant body of fish population. Several studies have been conducted to document the fish species found in Head Balloki, River Ravi, indicating the presence of both introduced species. Indigenous fish species, such as mahseer (Tor spp.), catla (Catla catla), and rohu (Labeo rohita) thrive in River Ravi [4].
The fish stock in River Ravi is important as it supports local livelihoods including artisanal and commercial fishing. Together, these fish species also perform essential functions for the stability of this busy river ecosystem. They reflect the environmental health, play an important role in nutrient cycling, and form a part of complex food webs within rivers. A comprehensive review of studies was conducted on aquatic fish diversity in different habitats across the historical periods and locations, where Pakistan is located. These studies provided basic information about species diversity and distribution, however, failed to address the genetic investigations which are specific to varieties of fish found in River Ravi. Therefore, the current study presented an analysis of some gene fragments within the COI. Hebert et al. proposed DNA barcoding technology which uses the sequence of mitochondrial cytochrome c oxidase subunit I (COI) gene as a barcode for species identification [5]. The idea behind this technique was to barcode every species in order to facilitate species identification and categorization. Vertebrates and invertebrates may be identified and classified using the COI gene as a barcode. Moreover, the COI gene is also used in many biological groups extensively. It was discovered that the intraspecific diversity of the COI gene in animals was significantly lower than the interspecific diversity [6]. Therefore, this gene segment was opted to illuminate molecular taxonomy, phylogenetic relationships, and genetic association of genes among Pakistani fish fauna; inhabiting River Ravi.
The correct identification of fish species is essential to understand their ecological roles in aquatic ecosystems. Each species possesses unique feeding habits, habitat preferences, and reproductive strategies, all of which significantly influence the ecosystem dynamics. The fish industry requires fish identification, ecological assessments, and evaluations of environmental impacts, prohibitions on illegal trade, the establishment of well-organized fish resources, and the creation of protected areas for fish [7]. Without proper identification, the evaluation of interactions between fish species and their environment would become challenging.
The delimitation and verification of fish species play an essential role to manage fisheries, ensure food authenticity, define components used in complementary and alternative medicines, and maintain the taxonomic and logical order of fish species [8]. Species identification is crucial to determine the priority of conservation activities. In order to evaluate population trends, distribution patterns, and habitat requirements, conservation efforts frequently depend on species-specific data [9]. Moreover, fish identification is important to maintain biodiversity in an aquatic environment [10].
In Pakistan, fish identification traditionally relies on a morphological approach. This approach involves the identification of specific morphological features, primarily observable in mature specimens. Taxonomy including fish identification, typically employs this method, utilizing morphological keys for the identification purposes [11]. However, accurate fish identification may become challenging in certain scenarios. These challenges include dealing with fish in fillet form during trade practices or during the early developmental stages when morphological characteristics are incomplete [12].
Therefore, fish identification is urgent and alternative methods than visual must be deployed in these situations. The technique of DNA barcoding has been used to replace identification [13]. Limitations due to the staggering complexity of traditional scientific classification using morphological traits have fueled considerable expansion with DNA barcoding. This universal technique is based on the nucleotide levels of cytochrome c oxidase I for bio-identification tools in living organisms [8].
This method uses a molecular technique known as DNA barcoding by analyzing short DNA sequences from well-established positions in the genome for species identification of fishes. This approach relies on the idea that all species come with distinct genetic fingerprints which may be used to differentiate one species from another in a finer resolution. Generally, only a small piece of DNA from that particular fish species is amplified by polymerase chain reaction (PCR), most often targeted for amplification being taken from the mitochondrial COI gene [14]. The amplified DNA sequences are compared with the known DNA barcodes of different species of fish and stored in a reference database. Scientists can accurately determine which species of fish sample was processed by comparing the newly obtained sequences with those present in the database [15].
There are several benefits of fish species identification using the DNA barcoding method including rapidness, accuracy, and independency to the morphological traits that may be difficult in their own right with cryptic or juvenile species [16]. Furthermore, DNA barcoding acts as a valuable instrument in uncovering mislabeled or counterfeit seafood items within the market, thereby enhancing food safety standards and safeguarding consumer interests [17].
The current study aimed to identify fish species in River Ravi by applying both morphological and genomic methods. Through the use of DNA barcoding method, the study intended to improve the accuracy of species identification and confirmed the usefulness of genetic markers in differentiating fish species. Moreover, it also offered a trustworthy point of reference for biodiversity assessments and conservation initiatives in this freshwater environment.
2. MATERIALS AND METHODS
2.1. Sampling Site
The samples were collected using the techniques designed and approved by the university's ethics committee. The site of collection was the Head Balloki, River Ravi in Punjab, Pakistan (Figure 1). River Ravi, situated in the northwestern region of the Indian subcontinent, predominantly flows through Pakistan. Its total length within Pakistan is approximately 720 kilometers (447 miles). Originating in the Himalayas, in the Indian state of Himachal Pradesh, the river enters Pakistan near the city of Lahore. From there, it flows southwestward through the Punjab province, eventually joining the River Chenab near the city of Ahmadpur Sial. Head Balloki is located on the River Ravi in Punjab, Pakistan. Specifically, it is located near the town of Balloki in District Kasur, Punjab. This site is crucial to manage and regulate the water flow from River Ravi for irrigation purposes in the region. This head consists of various freshwater fish species adapted to the river's ecosystem.
2.2. Sampling
Fish samples (100g each) were collected randomly during the daytime (October-February) from the Head Balloki of River Ravi. These samples were collected using various types of nets including common fish trapping nets, hand nets, cast nets, drag nets, and bait hooks. No special approvals were needed since these collections were made only in offshore areas, outside of national parks, protected regions and private domains.
All the collected samples of fish were appropriately labeled and stored at -20°C. Local fish vendors and catchers assisted in the initial identification and naming of fish species. Samples were then carefully moved to the Government Sadiq College Woman University Bahawalpur in the zoological laboratory for additional analysis. All specimens were recognized and categorized by knowledgeable taxonomists, who mostly used the identification keys of Liu et al.
Morphological identifications were carried out based on morphological characteristics using established keys [18]. Subsequently, fish specimens were individually dissected in the laboratory for further analysis. The samples of muscle tissues were collected following morphological examination and kept in 95% ethanol at -20°C.
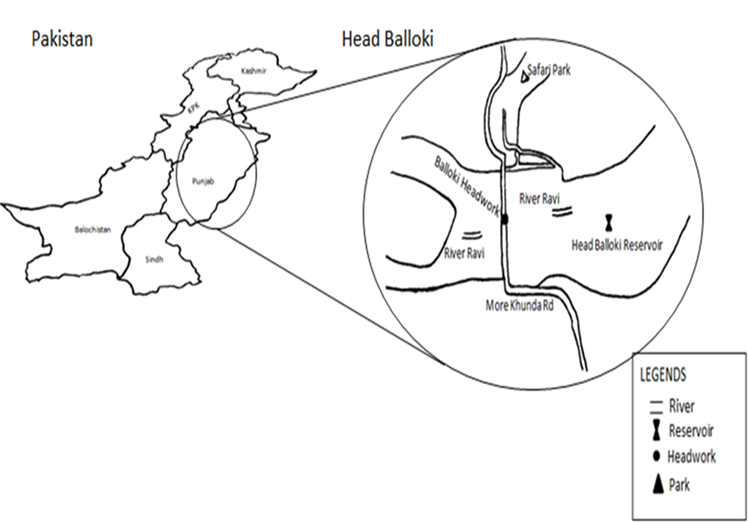
Figure 1. Map of Study Area and Location of Sampling Sites at the Head Balloki River Ravi, Punjab, Pakistan
2.3. DNA Isolation
The genome's DNA was isolated from fish muscle tissue utilizing a standard procedure that followed the PCI (Phenol-Chloroform Isoamyl) alcohol method. Approximately, a 1% agarose gel electrophoresis was used to confirm the DNA extraction process [8].
PCR Amplification and Sequencing
Afterwards, PCR was carried out utilizing different combinations of four newly designed primers:
FishF1-50 TCAACCAACCACAAAGACATTGGCAC30,
FishF2-50 TCGACTAATCATAAAGATATCGGCAC30,
FishR1-50 TAGACTTCTGGGTGGCCAAAGAATCA30,
FishR2-50 ACTTCAGGGTGACCGAAGAATCAGAA30
The target gene was the COI gene from the mitochondrial DNA with a length of roughly 685 base pairs. Using the PCR, a specific portion of fish DNA, particularly the mitochondrial cytochrome c oxidase subunit I (COI) gene, was amplified to identify the species of fish. The amplified area, referred to as the DNA barcode, is essential to identify a species.
A Mastercycle Eppendorf gradient thermal cycler (Brinkmann Instruments, Inc.) was used for PCR amplification. The thermal cycling program comprises three steps. The first step was the initial denaturation phase for two minutes at 95°C. The second step was denaturation, done for 30 seconds at 94°C. The third step was annealing at a temperature of 54°C for 30 seconds and the extension of one minute at 72°C. The reaction was maintained at 4°C during the last extension phase which lasted for 10 minutes at a temperature of 72°C.
About 2% agarose gel electrophoresis was used to visualize the results of PCR amplification. PCR was used to sequence particular DNA fragments in order to identify the raw, frozen, and processed fish, which is recognized as the most accurate technique for this purpose. Furthermore, after the completion of sample amplification and DNA separation, the purified PCR products were sequenced.
2.4. Sequence Analysis
BLAST (Basic Local Alignment Search Tool) was used to align nucleotide sequences. MEGA X (Molecular Evolutionary Genetics Analysis) software was utilized to perform the sequencing procedures. The average pairwise comparisons of sequence variation among all individuals were computed to evaluate the degree of sequence differences between species. A final alignment, comprising 685 base pairs, was achieved by aligning COI gene sequences from 15 individuals. Afterwards, pairwise evolutionary distances were determined between the haplotypes using the K2P (Kimura 2-Parameter) method within Mega X software. Numerous parameters were identified including the number of transitions and transversions within species, the maximum likelihood estimation (MLE) of the substitution matrix, the divergence in evolution calculated according to nucleotide composition, and the diversity of nucleotide (pi).
Subsequently, MEGA 11 software was employed to construct a maximum likelihood method phylogenetic tree. The maximum likelihood method tree's internal nodes were tested for reliability using a bootstrap study that comprised 1,000 pseudo-replicates. Mitochondrial COI barcode series were obtained. The length of all the barcoded sequences with content cut was determined following lien excision. Afterwards, the nucleotide pair frequencies were used to calculate the average base frequency of these sequences. Sequences were aligned using ClustalW in MEGA 11. After that, the numbers of parsimony informative sites and polymorphic loci for each parameter were computed together with sequence length and GC content.
2.5. Evolutionary Pathway and Phylogeny Determination
Phylogenetic trees are used in the fields of evolutionary biology and genetics as tools to show how closely-related different organisms are. These relationships are mapped out based on genetic data. Using these trees, researchers can understand the history and relationships of species or populations. The maximum likelihood method was used for the construction of phylogenetic trees and non-coding regions were left out; care was taken to provide the most accurate sequences. Furthermore, a maximum composite likelihood method was also applied to estimate the nucleotide substitution rate between pyrimidine and purine bases. Trees were redrawn 500 times following the resampling process. Additionally, tree reconstruction was achieved from these using the maximum likelihood method to evaluate the reliability of each constructed tree. Afterwards, it was used to calculate the bootstrap probability from each tree based on this frequency.
Within the phylum Chordata, class Actinopterygii, and six orders (Siluriformes, Osteoglossiformes, Anabantiformes, Cypriniformes, Beloniformes, and Perciformes), a total of fifteen species were identified in this study. Nine families were also identified: Ambassidae, Sisoridae, Horabagridae, Clariidae, Osteoglossidae, Anabantidae, Channidae, Hemiramphidae, and Cyprinidae.
3. RESULTS
The sampling procedure was performed with the help of local fishers and vendors in the market for morphological identification. Thereafter, the fish species were classified taxonomically using the standard keys and all possible body measurements, such as minimum total length. These tasks were carried out by taxonomists - trained experts who can identify species and often specialize in particular groups. Taxonomists are particularly helpful when working with freshly collected or preserved samples [19].
3.1. Tor tor
Tor tor, commonly known as Mahseer, is a type of fish species which belongs to the genus Tor. It is native to South Asia and can be found in River Ravi (Pakistan). Furthermore, Mahseer is famous worldwide among anglers for its huge size, strength, and fighting height. Tor tor also enters in River Ravi. They prefer clear and fast flowing water which manages their growth. It preys upon small fish as well as the aquatic invertebrates. However, just like many other freshwater fish species, Mahseer is facing threats, such as habitat degradation, over-fishing, and water pollution which has caused a decline in localized population.
3.2. Catla catla
Catla catla is a freshwater fish found in the rivers of Pakistan, such as River Ravi. The role it occupies as a native fish species to the river include various activities within its aquatic ecosystem. Catla catla has a laterally compressed and deep elongated body. It has an elegant appearance and is a fast swimmer. Moreover, it can glide quickly through water. Catla catla can grow to more than two meters in length. They are large in size, measuring several feet long and weigh several pounds. The body of Catla catla is almost entirely covered with large cycloid scales that are smooth and overlapping. These scales provide protection to fish and help make it look smooth.
3.3. Labeo rohita
The Labeo rohita, often known as Rohu, is a freshwater fish species found in River Ravi. Since it is a native species of the river, it is significant from an ecological and economic perspective. As a member of the carp family, Rohu is prized for both its food and commercial uses. It is highly valued for its mild flavor and soft flesh which makes it a popular fish meal in South Asia. As an omnivore, Rohu consumes a wide range of foods including plankton, aquatic plants, insects, and detritus.
3.4. Hypophthalmichthys molitrix
Eastern Asia is the natural home of Hypophthalmichthys molitrix, often known as silver carp. Silver carp is usually found in numerous Asian rivers and other water bodies. The silver-colored scales and sleek and streamlined body are its distinguishing features. Filter-feeding fish mostly eat algae and phytoplankton by removing them from water using unique gill rakers.
Silver carp is a highly sought-after species for fisheries and aquaculture worldwide due to their large size and rapid development rates. They live in rivers with notable water-level swings in their native environment. Furthermore, they frequently inhabit the middle and lower sections of these rivers throughout the winter season, swimming close below the surface.
3.5. Cirrhinus cirrhosis
The mrigal carp (Cirrhinus cirrhosus), also known as the white carp, belongs to the carp family and is a species of ray-finned fish. Mrigal fish is native to Southeast Asia. It is a freshwater species found in River Ravi. Adults inhabit fast-flowing streams and rivers. The Mrigal typically has an elongated and moderately compressed body. It may appear slightly cylindrical, with a broad head and a tapering rear portion.
3.6. Barbonymus gonionotus
Barbonymus gonionotus is commonly known as the Java Barb. The Java barb can be found in rivers, streams, floodplains, and occasionally in reservoirs from the middle of the water column to the bottom. Barbonymus gonionotus is an herbivorous specie that mainly feeds on aquatic plants, however, it also eats invertebrates. Its streamlined body shape makes it an excellent moving target in freshwater habitats, such as rivers, streams, and ponds. Additionally, it can navigate through a variety of aquatic environments while searching for food and avoiding predators.
3.7. Bagarius bagarius
Bagarius bagarius, commonly referred to as the giant devil catfish or goonch, is a species of catfish that is found in large and medium rivers in South Asia. It is thought to be synonymous with B. yarrelli. The body of this fish is cylindrical and robust which makes it well-suited to live in freshwater environments. Its strength and stability allow it to swim through strong currents and turbulent waters.
3.8. Horabagrus brachysoma
H. brachysoma is usually found in regions with a plenty of flora and smooth, flowing water. This species is found in lowland locations along rivers and backwaters with mud or sand substrate. It has also been seen in deep ponds and mountain streams. The body of Horabagrus brachysoma is disc-shaped and flat, like a pancake or saucer. Among all catfish species, this body form is distinct and ideal to live in freshwater environments with muddy or sandy soils.
3.9. Clarias batrachus
Asia is the natural home of the walking catfish, or Clarias batrachus, which is commonly seen in freshwater ponds and fish farms in Afghanistan and the Philippines. Due to its amazing capacity to thrive in stagnant water, it is a vital food source, particularly in Southeast Asia. The body of Clarias batrachus is well-suited when it comes to its bottom-dwelling lifestyle in freshwater environments, such as River Ravi. It can move across a variety of aquatic settings with ease and forage for food due to its streamlined shape and specific adaptations, such as barbels and fins.
3.10. Scleropages formosus
The Asian Arowana, or Dragon Fish, or Scleropages formosus, is not indigenous to Pakistan's River Ravi. Freshwater areas in Southeast Asia are home to this species. Due to its striking colors, unique scales, and graceful body form, the Asian Arowana is highly valued in the aquarium trade. However, neither the River Ravi nor any other Pakistani river system contains it naturally. Scleropages formosus is a species that lives in slow-moving and heavily vegetated waterways which is its natural habitat. It feeds on insects, crustaceans, and small fish.
3.11. Anabas testudineus
Anababas testudineus, often known as the Climbing Perch, lives in brackish and freshwater environments. Rivers, lakes, ponds, ditches, marshes, estuaries, and other low-lying water bodies are examples of these habitats. Its body form is usually elongated and laterally compressed. This streamlined shape facilitates swimming and mobility by allowing for effective movement across the water.
3.12. Channa punctatea
This species is found in freshwater, mostly in ponds, marshes, and brackish water. It feeds on insects, worms, and small fish. Since Channa punctata's body is usually covered in black patches or blotches, it is commonly referred to as "Spotted Snakehead". These patches, which are erratically spaced throughout the body, help species blend in with the underwater plants and aquatic detritus of its native environment.
3.13. Xenentodon cancila
Xenentodon cancila, sometimes known as the freshwater garfish, is a species of needlefish that is indigenous to freshwater and brackish environments in South and Southeast Asia. Xenentodon cancila usually has a body form that is elongated and narrow, similar to that of a gar or a needle. Its sleek shape facilitates swimming and hunting by enabling effective movement across the water. The long, thin jaws of Xenentodon cancila, which are packed with many sharp teeth are one of its most remarkable characteristics. These teeth are designed to take in and cling to tiny fish and other pieces of its prey.
3.14. Parambassis ranga
The GlassFish inhabits a wide range of lowland, thickly vegetated, sluggish or standing environments, primarily freshwater but occasionally weakly brackish, such as inner estuaries, marshes, impoundments, lakes, rivers, and streams. The body form of Parambassis ranga is usually elongated and thin, similar to that of a tiny darter or perch. Its streamlined shape makes it easier to move through water, which helps in swimming and avoiding predators.
3.15. Oreochromis niloticus
Tilapia inhabits a wide range of habitats including swamps, tidal creeks, rivers, lakes, ponds, creeks, drains, and estuaries. They typically prefer muddy bottoms with abundant vegetation and are frequently observed in loose groups or small schools. Oreochromis niloticus typically has an oval-shaped body that is laterally compressed. This body shape allows for efficient movement through water and aids in stability as well.
3.16. Data Analysis
A total of fifteen fish species, representing ten families and six orders, had mitochondrial COI barcode sequences available (GenBank accession codes and the taxonomic information are given in Table 1). All barcode sequences were standardized to 685 bp after excision. No stop codons, deletions, and insertions were found. There were 685 bp sequences in the overall dataset. A review of the nucleotide pair frequencies of the dataset showed that 385 (56.20%) out of the 685 locations were being conserved. Out of the remaining sites, 294 (42.92%) were found variable, 226 (33%) were considered informative in terms of parsimony, and 66 (9.64%) were identified as singletons.
The directional pair frequency analysis showed an average of 483 identical pairs (ii). This is because transitional pairs (si = 64) are more common than trans-versional pairs (sv = 57), the si/sv (R) ratio of the dataset was 1.1.
Nucleotide base pair frequencies were analyzed using MEGA 11 software and the outcomes are shown in Table 2. The analysis revealed that the average frequencies of nucleotide bases in the sequences were the following; T (28.8%), C (28.1%), A (25.3%), and G (17.8%). Specifically, the analysis of the COI sequence demonstrated that the average T content was the highest, while the average G content was the lowest. Moreover, the AT content (54.1%) surpassed the GC content (45.9%) (Table 2).
Furthermore, the largest GC content was discovered in the first codon position, showing an uneven distribution in the base utilization of three codon regions. The frequencies of the remaining three bases varied significantly, while the utilization frequency of T remained consistent across all three codon positions. Except for the two fish species, that is, Tor tor and Oreochromis niloticus, nearly all the sequences of several fish species that were analyzed revealed average nucleotide base frequencies that were higher than 600.
Table 1. List of Species DNA Barcoded along with Genbank Accession Numbers
|
S. No |
Order |
Family |
Genus |
Species |
Common name |
GenBank accession No. |
|
1 |
Cypriniformes |
Cyprinidae |
Tor |
Tor tor |
Mahseer |
MF966245 |
|
Cyprinidae |
Catla |
Catla catla |
Catla |
JQ801755 |
||
|
Cyprinidae |
Labeo |
Labeo rohita |
Rohu |
JX983352 |
||
|
Cyprinidae |
Hypophthalmichthys |
Hypophthalmichthys molitrix |
Silver carp |
JX983319 |
||
|
Cyprinidae |
Cirrhinus |
Cirrhinus cirrhosus |
Mrigal |
KF511575 |
||
|
Cyprinidae |
Barbonymus |
Barbonymus gonionotus |
Silver barb |
MK572052 |
||
|
2 |
Siluriformes |
Sisoridae |
Bagarius |
Bagarius bagarius |
Goonch |
OR148039 |
|
Horabagridae |
Horabagrus |
Horabagrus brachysoma |
Yellow catfish |
KU568861 |
||
|
Clariidae |
Clarias |
Clarias batrachus |
Walking catfish |
MK577976 |
||
|
3 |
Osteoglossiformes |
Osteoglossidae |
Scleropages |
Scleropages formosus |
Asian Arowana |
KY123644 |
|
4 |
Anabantiformes |
Anabantidae |
Anabas |
Anabas testudineus |
Climbing perch |
KF511515 |
|
Channidae |
Channa |
Channa punctata |
Spotted snakehead |
MH156960 |
||
|
5 |
Beloniformes |
Hemiramphidae |
Xenentodon |
Xenentodon cancila |
Freshwater garfish |
JX983514 |
|
Ambassidae |
Parambassis |
Parambassis ranga |
Indian glassy fish |
MH918109 |
||
|
6 |
Perciformes |
Cichlidae |
Oreochromis |
Oreochromis niloticus |
Tilapia |
MG428624 |
Table 2. Nucleotide Pair Frequency Analysis
|
Fish Species |
T(U) |
C |
A |
G |
Total |
|
Tor tor |
29.9 |
26.9 |
26.9 |
16.4 |
536 |
|
Catla catla |
28.6 |
27.2 |
27.2 |
17.0 |
629 |
|
Labeo rohita |
28.6 |
26.9 |
26.9 |
17.5 |
646 |
|
Hypophthalmichthys molitrix |
29.4 |
26.9 |
25.7 |
18.0 |
635 |
|
Cirrhinus cirrhosus |
27.9 |
28.5 |
25.5 |
18.1 |
620 |
|
Barbonymus gonionotus |
27.8 |
28.7 |
26.9 |
16.6 |
655 |
|
Bagarius bagarius |
28.4 |
27.5 |
25.3 |
18.8 |
665 |
|
Horabagrus brachysoma |
29.6 |
25.5 |
25.6 |
19.3 |
652 |
|
Clarias batrachus |
28.4 |
26.3 |
28.4 |
16.8 |
654 |
|
Scleropages formosus |
28.0 |
29.7 |
24.0 |
18.3 |
654 |
|
Anabas testudineus |
30.0 |
29.1 |
24.3 |
16.5 |
629 |
|
Channa punctata |
28.7 |
30.5 |
23.3 |
17.5 |
645 |
|
Xenentodon cancila |
29.0 |
26.5 |
23.9 |
20.6 |
652 |
|
Parambassis ranga |
27.9 |
31.4 |
21.5 |
18.8 |
634 |
|
Oreochromis niloticus |
30.0 |
29.7 |
24.4 |
15.9 |
546 |
|
Average |
28.8 |
28.1 |
25.3 |
17.8 |
630.1 |
3.17. Genetic Variations among Different Taxonomic Levels
The current study employed the Kimura-2-parameter model. This method is recommended by the Consortium for the Barcode of Life (CBOL) [20] to measure genetic differences within and between various fish species. According to the findings presented in Table 3, the K2P distance within species ranged from 0.0646% to 0.3122%. The species' average genetic distance was 0.24±0.01%. The genetic distance ranged from 0.194% to 0.312%, with an average of 0.24±0.02% between the families. The mean distance of variation among the orders was 0.24±0.01% with a maximum value of 0.312% and minimum value of 0.226%. The values of all the genetic distances among the families, orders, and species were less than 1%. According to the results, the average values of K2P distances remained almost the same among all taxonomic levels. The value for standard error was slightly higher in families than among the orders and species.
Table 3. Genetic Variations at Different Taxonomic Levels
|
Comparison within |
Taxa |
Mean±SE % |
Minimum % |
Maximum % |
|
|
Species |
15 |
0.24±0.01 |
0.0646 |
0.3122 |
|
|
Family |
10 |
0.24±0.02 |
0.194 |
0.312 |
|
|
Order |
7 |
0.24±0.01 |
0.226 |
0.312 |
|
3.18. Evolutionary Relationships of Taxonomy
Maximum likelihood was used to infer the evolutionary history. When represented to scale, the ideal tree displays branch lengths using the same units as the evolutionary distances to construct the phylogenetic tree. Gamma distribution (shape parameter = 1) was used to simulate rate variation among sites and variations in sequence composition bias were taken into account in evolutionary comparisons. In the current study, 15 nucleotide sequences from the NCBI were used. After removing any positions with gaps or missing data, 501 positions made up the final dataset.
MEGA11, evolutionary analyses were carried out, and the phylogenetic tree was constructed using the maximum likelihood methods. This method is widely used for statistical estimations. Bootstrapping was used to evaluate the clade believability in the tree produced by the maximum likelihood technique. This required 1000 repetitions of the sampling test to get the clade nodes' support values. Species with similar background belong to the same order. Different colors in species names represent different families of the studied fish species. In the phylogenetic tree, Catla catla and Labeo rohita were clustered under the same node (Figure 2). Catla catla and Labeo rohita belong to the Cypriniformes order and Cyprinidae family. Labeo rohita, Catla catla, and Cirrhinus cirrhosis all belong to order Cyproniformes. They are narrowly related to evolutionary tree. Bagarius bagarius and Clarias batrachus are sister species belonging to the order Siluriformes, family Sisoridae, and Clariidae, respectively. Parambassis ranga, belonging to order Beloniformes, is closely related to Channa punctate, belonging to the order Anabantiformes.
Similarly, Anabas testudineus is closely related to Channa punctate and Parambassis ranga, which are sister species to each other. Channa punctate lies in the order Anabantiformes and the Channidae family. While Parambassis ranga fits in the order Beloniformes and Ambassidae family. Species that are distantly related are grouped under separate nodes, whereas closely related species are clustered together under the same node. A total of six orders were identified consisting of Cypriniformes, Siluriformes, Osteoglossiformes, Anabantiformes, Beloniformes, and Perciformes. Most of the specimens from the same species formed different clusters, which was in line with their previous taxonomic designation based on morphological characteristics. At the species level, no taxonomic differences were found, indicating that most of the species under investigation were successfully validated using the barcode approach.
Figure 2. Phylogenetic Tree (Maximum Likelihood Method) of COI Sequences using K2P Distances
4. DISCUSSION
DNA barcoding technology uses a DNA sequence segment that shows significant species differences to help identify different species. This method overcomes the limitations of depending solely on the expertise and professional judgment of taxonomists in traditional morphological classification. This allows for the standardization and use of technology in species identification processes [6]. Due to its remarkable conservation within species and low genetic diversity between species, the mitochondrial COI gene is frequently utilized as a species barcode. Its effectiveness to identify species has been demonstrated by several studies focused on different fish populations [21–24]. In the current study, COI barcode sequences were successfully obtained for fifteen species of freshwater fish. One possible method to ensure that DNA barcoding is widely used for fish species classification is to select primer pairs that efficiently amplify the target region without causing deletions or insertions.
Specimens can be taxonomically identified using the DNA barcoding approach. The accuracy of this identification relies on whether the species are monophyletic based on differences in COI gene sequence. If a species' members have deeper ties with one another than they have with members of other species, the species is considered monophyletic [25]. DNA barcodes were generated for a total of 15 species, representing 10 families (Cyprinidae, Sisoridae, Horabagridae, Clariidae, Osteoglossidae, Anabantidae, Channidae, Hemiramphidae, Ambassidae, and Cichlidae), six orders (Cypriniformes, Siluriformes, Osteoglossiformes, Anabantiformes, Beloniformes, Perciformes), and 10 families (Cyprinidae, Sisoridae, Horabagridae, Anabantidae, Channidae, Ambassidae, and Cichlidae). None of these sequences contained stop codons, insertions, or deletions, indicating that the amplified sequences likely originate from functional mitochondrial COI sequences. Consistent with prior studies, the absence of stop codons and the 685 base pair lengths of the amplified sequences suggest that Nuclear Mitochondrial DNA (NUMTs) were not sequenced [14].
There were 385 conserved sites in the sequence, according to an analysis of the nucleotide pair frequencies over the whole dataset in this study. Out of the 685 locations, 294 were found to be variable, 226 to be parsimony informative, and 66 to be singletons. In the directional pair frequency analysis, it was noted that the average count of identical pairs (ii) was 483, with fewer occurrences of trans-versional pairs (sv = 57) as compared to transitional pairs (si = 64). The ratio of transitional pairs to trans-versional pairs (si/sv, denoted as R) was calculated to be 1.1 for the dataset. Variations in mitochondrial DNA diversity may lead to shifts in fish population demographics. The base composition analysis of the COI sequences revealed a higher AT content (54.5%) as compared to GC content (45.6%), consistent with the findings in Australian, Canadian, and Cuban fish species genomes [14, 15, 26].
At the outset, this study employed the maximum likelihood method for species identification, with additional insights drawn from the dendrogram. The phylogenetic tree revealed that more than 98% of specimens fell into distinct families, without displaying polyphyly or paraphyly (Figure 2). However, it is crucial to note that DNA barcoding operates independently of the existing taxonomy structure and should not be interpreted as a definitive "taxonomic" label. The entire phylogenetic tree generated by the current study is shown in Figure 2. DNA barcoding is highly effective to distinguish between species, as evidenced by the phylogenetic tree, where most species were grouped into monophyletic clusters. Misidentification based on morphology could potentially affect the conclusions drawn from the maximum likelihood method tree.
The evolutionary relationships among species were consistent across the phylogenetic tree, clearly establishing their relationships. Nodes with higher bootstrap values (90–100%) provided strong support to cluster similar species together. Conversely, nodes with lower bootstrap values indicated weaker support to cluster different species separately. Bagarius bagarius and Clarias batrachus are shown closely related under the same node. Catla catla, Labeo rohita, and Cirrhinus cirrhosis all belong to the order Cypriniformes and are closely related within the evolutionary tree. In contrast, Bagarius bagarius and Clarias batrachus, which belong to the orders Siluriformes and families Sisoridae and Clariidae, respectively, are sister species. Parambassis ranga, classified under the order Beloniformes, is closely related to Channa punctata, which belongs to the order Anabantiformes.
Similarly, Anabas testudineus shows a close evolutionary relationship with both Channa punctata and Parambassis ranga, which are sister species to each other. Channa punctata is classified in the Anabantiformes order and Channidae family, while Parambassis ranga is categorized in the Beloniformes order and Ambassidae family. In the tree, it was noticed that species with more distant relationships gather under separate nodes, whereas those closely-related are grouped. Six orders were identified in total: Perciformes, Beloniformes, Anabantiformes, Osteoglossiformes, Siluriformes, and Cypriniformes. Most specimens from the same species were found near one another, consistent with their previous taxonomic classification based on morphology. Even though, barcode research focuses to recognize different species, the DNA data from COI sequencing also reveals some insights into how species have evolved. Interestingly, it has been often determined that closely-related species tend to cluster together, showing that familial ties are reflected in genetic similarities.
Both intraspecific and interspecific divergence are necessary for DNA barcoding to be an effective method of species identification. By comparing the genetic differences between the most closely-related members of a group, barcode analysis identifies the thresholds that differentiate species [5]. Nevertheless, there is not presently a standard criterion that has been agreed upon by all parties to differentiate between species. Researchers have recently found that comparing how much individuals within a species differ to how much closely related species differ can help define something called the "barcoding gap." This approach has proven more helpful than just averaging out the differences within and between species [27, 28].
In this study, genetic differences were measured using a model called the Kimura-2-parameter (K2P), recommended by the CBOL. This model was used to figure out how much genes vary within and between different fish species. On average, the genetic difference between species was about 0.24%, and within species, it ranged from 0.0646% to 0.3122%. When different fish families were looked at, the average genetic difference was found to be around 0.24%, with a range from 0.194% to 0.312%. The mean distance of variation among orders was 0.24±0.01%, with a maximum value of 0.312% and a minimum of 0.226%. These results show that although the increase in genetic distance (K2P) is relatively less and less noticeable at higher taxonomic levels, it tends to be higher at broader taxonomic levels and beyond the species level. These findings show a high degree of consistency since they closely match earlier findings [5].
Future studies aiming to examine DNA barcoding of fish species should take cues from the recommendations outlined in this research. DNA barcoding of fish brings numerous scientific and practical benefits, especially once there is a comprehensive database of fish DNA barcodes in place. With DNA barcoding, it becomes possible to identify not just adult fish, however, also their eggs, larvae, and even small bits of their bodies. These discoveries offer fisheries managers and ecologists’ valuable insights into fish diversity, aiding them in crafting strategies for the conservation and responsible use of fishery resources.
4.1. Conclusion
The current study successfully proved that COI is a reliable method to identify different species of fish. Integration of DNA barcoding with traditional classification methods offers a robust approach for species identification, leading to numerous taxonomic revisions and promising further advancements with its broader application. However, the availability of high-quality reference sequences in open databases, such as BOLD or GenBank is a major factor influencing how effective barcoding is. DNA barcoding works well since DNA sequences from the same species are more alike than those from different species. The findings are significant to manage and conserve River Ravi. This is because they suggest that COI barcoding is an effective technique to identify the fish species present in the river.
Conflict of Interest
The author of the manuscript has no financial or non-financial conflict of interest in the subject matter or materials discussed in this manuscript.
Data Availability Statement
The data associated with this study will be provided by the corresponding author upon request.
Funding details
This research did not receive grant from any funding source or agency.
Bibliography
- Naz S, Chatha AMM, Khan RU, et al. Current status of fish diversity and abundance at Panjnad headworks Bahawalpur, Punjab, Pakistan. Pak J Zool. 2023;55(6):2651–2659.
- Food and Agriculture Organization. The State of the World's Fisheries and Aquaculture 2018 - Meeting the Sustainable Development Goals. Food and Agriculture Organization of the United Nations; 2019.
- Ashraf S, Altaf M, Khan AM, et al. Freshwater fish species diversity at Chacma Barrage, Pakistan. J Anim Plant Sci. 2022;32(3):855–860. https://doi.org/10.36899/JAPS.2022.3.0486
- Javed M, Abbas K. Inland fisheries and aquaculture in Pakistan. In: Khan IA, Khan MS, eds. Developing Sustainable Agriculture in Pakistan. CRC Press; 2018:543–559. https://doi.org/10.1201/9781351208239-25
- Hebert PD, Cywinska A, Ball SL, deWaard JR. Biological identifications through DNA barcodes. Proc R Soc Lond B Biol Sci. 2003;270(1512):313–321. https://doi.org/10.1098/rspb.2002.2218
- Bingpeng X, Heshan L, Zhilan Z, Chunguang W, Yanguo W, Jianjun W. DNA barcoding for identification of fish species in the Taiwan Strait. PLoS One. 2018;13(6):e0198109. https://doi.org/10.1371/journal.pone.0198109
- Naz S, Chatha AMM, Nazir U, Iqbal SS, Danabas D. Morphological and genetic identification of Head Taunsa Barrage fish species. Curr Trends OMICS. 2023;3(1):39–59. https://doi.org/10.32350/cto.31.03
- Naz S, Chatha AMM, Danabas D, Iqbal S. Fish diversity at Head Panjnad and its genetic identification by DNA barcoding technology. BioSci Rev. 2022;4(4):73–88. https://doi.org/10.32350/BSR.44.04
- Frankham R. Where are we in conservation genetics and where do we need to go? Conserv Genet. 2010;11:661–663. https://doi.org/10.1007/s10592-009-0010-2
- Ward RD, Hanner R, Hebert PD. The campaign to DNA barcode all fishes, FISH-BOL. J Fish Biol. 2009;74(2):329–356. https://doi.org/10.1111/j.1095-8649.2008.02080.x
- Karim A, Saif R, Gill Z, Ali FS, Fatima R, Razzaq A. CO1 gene-based identification analysis of two freshwater fish species Labeogonius cirrhinusmrigala (family: Cyprinidae) from R Ravi, Punjab, Pakistan. Merit Res J Agric Sci Soil Sci. 2018;6(3):24–31.
- Fischer J. Fish identification tools for biodiversity and fisheries assessments: review and guidance for decision-makers. FAO Fisher Aquacul Tech Paper. 2014;(585):9–11.
- Bhattacharya M, Sharma AR, Patra BC, et al. DNA barcoding to fishes: current status and future directions. Mitochondrial DNA A. 2016;27(4):2744–2752. https://doi.org/10.3109/19401736.2015.1046175
- Ward RD, Zemlak TS, Innes BH, Last PR, Hebert PD. DNA barcoding Australia's fish species. Philos Trans R Soc Lond B Biol Sci. 2005;360(1462):1847–1857. https://doi.org/10.1098/rstb.2005.1716
- Hubert N, Hanner R, Holm E, et al. Identifying Canadian freshwater fishes through DNA barcodes. PLoS One. 2008;3(6):e2490. https://doi.org/10.1371/journal.pone.0002490
- Tsoupas A, Papavasileiou S, Minoudi S, et al. DNA barcoding identification of Greek freshwater fishes. PLoS One. 2022;17(1):e0263118. https://doi.org/10.1371/journal.pone.0263118
- Rafique M, Khan NUH. Distribution and status of significant freshwater fishes of Pakistan. Rec Zool Surv Pak. 2012;21:90–95.
- Yue GH, Orban L. A simple and affordable method for high-throughput DNA extraction from animal tissues for polymerase chain reaction. Electrophoresis. 2005;26(16):3081–3083. https://doi.org/10.1002/elps.200410411
- White WT, Last PR. A review of the taxonomy of chondrichthyan fishes: a modern perspective. J Fish Biol. 2012;80(5):901–917. https://doi.org/10.1111/j.1095-8649.2011.03192.x
- Ward RD, Holmes BH, Yearsley GK. DNA barcoding reveals a likely second species of Asian sea bass (barramundi) (Lates calcarifer). J Fish Biol. 2008;72(2):458–463. https://doi.org/10.1111/j.1095-8649.2007.01703.x
- Zhang JB, Hanner R. DNA barcoding is a useful tool for the identification of marine fishes from Japan. Biochem Syst Ecol. 2011;39(1):31–42. https://doi.org/10.1016/j.bse.2010.12.017
- Chakraborty M, Ghosh SK. An assessment of the DNA barcodes of Indian freshwater fishes. Gene. 2014;537(1):20–28. https://doi.org/10.1016/j.gene.2013.12.047
- Chang CH, Shao KT, Lin HY, et al. DNA barcodes of the native ray-finned fishes in Taiwan. Mol Ecol Resour. 2017;17(4):796–805. https://doi.org/10.1111/1755-0998.12601
- Karahan A, Douek J, Paz G, et al. Employing DNA barcoding as taxonomy and conservation tools for fish species censuses at the southeastern Mediterranean, a hotspot area for biological invasion. J Nat Conserv. 2017;36:1–9. https://doi.org/10.1016/j.jnc.2017.01.004
- Zhang J. Species identification of marine fishes in China with DNA barcoding. Evid Based Complement Alternat Med. 2011;2011:e978253. https://doi.org/10.1155/2011/978253
- Zara A, de Leon JLP, Rodriguez R, et al. DNA barcoding of Cuban freshwater fishes: Evidence for cryptic species and taxonomic conflicts. Mol Ecol Resour. 2010;10(3):421–430. https://doi.org/10.1111/j.1755-0998.2009.02785.x
- Bhattacharjee MJ, Laskar BA, Dhar B, Ghosh SK. Identification and re-evaluation of freshwater catfishes through DNA barcoding. PLoS One. 2012;7(11):e49950. https://doi.org/10.1371/journal.pone.0049950
- Meier R, Zhang GY, Ali F. The use of mean instead of smallest interspecific distances exaggerates the size of the "barcoding gap" and leads to misidentification. Syst Biol. 2008;57(5):809–813. https://doi.org/10.1080/10635150802406343