
| Review | Open Access |
|---|
Heart-related Clinical Biomarker Classification through Machine Learning Algorithms |
 |
|---|
![]() Sahar Safdar1, Abdur Rauf2, Areeba Bint Tariq1, Shawana Qazi1, and Syeda Marriam Bakhtiar1*
Sahar Safdar1, Abdur Rauf2, Areeba Bint Tariq1, Shawana Qazi1, and Syeda Marriam Bakhtiar1*
1Department of Bioinformatics & Biosciences, Genetic & Molecular Epidemiology Research Group, Capital University of Science and Technology, Islamabad, Pakistan
2National University of Science & Technology, Islamabad, Pakistan
Heart diseases continue to be a major global cause of morbidity and death. Their timely and accurate diagnosis for improved patient outcomes is direly needed. Clinical biomarkers for the timely diagnosis of heart diseases are known but underutilized due to the use of conventional analytical methods that lower the efficiency to handle large datasets. Furthermore, conventional methods also fail to incorporate demographic biomarkers such as age and hemodynamic biomarkers such as heart rate and diastolic blood pressure. This significantly influences heart diseases. Using cutting edge machine learning (ML) techniques including Lasso regularization, support vector machine (SVM), and gradient boosting (GB), this study investigated the importance of clinical biomarkers for heart disease prediction. Troponin and Creatinine Kinase - MB (CK-MB) were found to be the most significant predictors among the examined characteristics in every model, underscoring their crucial importance in the diagnosis of myocardial ischemia and damage. Diastolic blood pressure was also found to be an adequate predictor, highlighting its role in increasing cardiovascular risk because of autonomous dysfunction. While SVM and GB performed strongly in managing intricate data relationships, Lasso regularization successfully decreased feature redundancy. The results support the use of clinically applicable biomarkers in conjunction with machine learning to improve the accuracy of diagnosis and also opens the door to the personalized treatment of heart disease. Validating these findings in a variety of populations and adding more biomarkers for a thorough risk assessment should be the main goals of future studies.
Graphical Abstract
1. INTRODUCTION
For the past few decades, heart diseases (HDs), often referred to as cardiovascular diseases (CVDs), have been the leading cause of mortality all around the globe. These diseases encompass a variety of conditions that affect the heart. Every year, over 17.9 million deaths are reported due to CVDs, as estimated by WHO (World Health Organization) [1]. The European Society of Cardiology estimates that 3.6 million people are diagnosed with heart diseases each year, out of an overall population of 26 million. Common symptoms of heart diseases include swollen feet, muscular weakness, and shortness of breath [2].
Clinical biomarkers are essential for diagnosing and managing heart diseases. They provide valuable insights into the physiological and pathological processes associated with cardiovascular risks. These biomarkers include troponin, CK-MB, and blood pressure, all of which are widely used in clinical practices due to their high specificity and sensitivity [3]. The integration of these biomarkers in diagnostics significantly enhances clinical decision-making by enabling early detection, reducing uncertainty, and increasing precision. The important biomarkers associated with heart diseases are shown below in Table 1.
Table 1. Clinical Biomarkers and their Significance in Heart Diseases
|
Biomarkers |
Significance |
|---|---|
|
Age |
Aging causes arterial stiffening, endothelial dysfunction, and increased prevalence of some conditions, such as hypertension [4]. |
|
Gender |
Men have a higher risk of developing heart diseases at a younger age than women, which could be elevated due to hormonal changes [5]. |
|
Systolic Blood Pressure |
Its elevated level predicts a strong cardiovascular event [6]. |
|
Diastolic Blood Pressure |
It indicates elevated peripheral resistance, especially in younger individuals [6]. |
|
CK-MB |
It indicates myocardial necrosis and also detects reinfarction [7]. |
|
Troponin |
It specifies myocardial injury and also assesses the severity of cardiac damage [8]. |
In the current global scenario, diagnosing CVDs at an early stage through their symptoms remains significantly difficult. If not detected timely, CVDs may cause mortality [9]. Without access to modern technologies and trained medical personnel, diagnosing and treating heart diseases is highly challenging. This is due to the fact that the assessment of the patient’s medical background and physical examination, including detecting CVDs is based on critical symptoms [10]. However, the findings of this diagnostic procedure do not accurately identify the heart patient. Additionally, the analysis is costly and computationally challenging2. Clinically useful methods to predict and detect CVDs would involve machine learning and data mining [11].
The expanding availability of healthcare records and the rapid advancement of analytical tools is revolutionizing the healthcare industry. Within artificial intelligence, machine learning (ML) is a developing field. Its main goal is to build systems, give them the ability to learn, and use that learning to generate predictions. To create models, it looks for hidden trends in the input dataset and produces highly accurate predictions for fresh datasets. After cleaning the dataset, any values that are missing are filled in. The new input is used to predict the risk associated with heart diseases, followed by an accuracy assessment [1].
Recent research confirms that ML algorithms can be used in clinical contexts. Internal validation requires the integration of biomarkers with demographic information in order to obtain high accuracy in predicting cardiovascular events via gradient boosting (GB) [12]. A recent study revealed that support vector machine (SVM) is easily adapted to different cardiac situations and is also useful in predicting heart failure. In the current study, CVDs are predicted using various ML methods, such as SVM, random forest (RF), and logistic regression (LR). These methods were chosen because they work effectively in solving non-linear classification problems. Based on the results, SVM performed better than both LR and RF, averaging an area under the ROC curve value of 78.84%, while giving 78.41% for LR and 77.50% for RF. The above results indicate that SVM is more suitable as a method to predict CVDs, as compared to other methods [13].
The suggested hybrid framework bridges the gap between clinical practice and ML by utilizing interpretability and feature selection. The model identifies the strongest predictive variables, while keeping things transparent for physicians by fusing ML with healthcare. This is crucial in the medical field, as doctors need precise and useful information to determine that AI-driven predictions meet the accepted diagnostic standards. By ensuring the model’s accuracy and interpretability, this method faciliates real-time diagnostic decision-making and individualized treatment planning [14].
Although considerable progress has been made, almost all efforts focus on either biological validation or computational techniques, rarely bridging the gap between the two. Datasets often lack adequate demographic and heamodynamic variety to draw generalizable conclusions. Hence, this study employs the use of ML models to classify clinical biomarkers comprising demographic and heamodynamic factors for early and timely diagnosis of heart diseases. By bridging this gap in clinical diagnostics and incorporating ML, the study anticipates significant advancement in the cardiology precision medicine.
2. METHOD
ML is gaining popularity in the field of cardiovascular medicine. Finding the most practical ML algorithm for CVD datasets is still difficult, even with the abundance of available techniques [15].
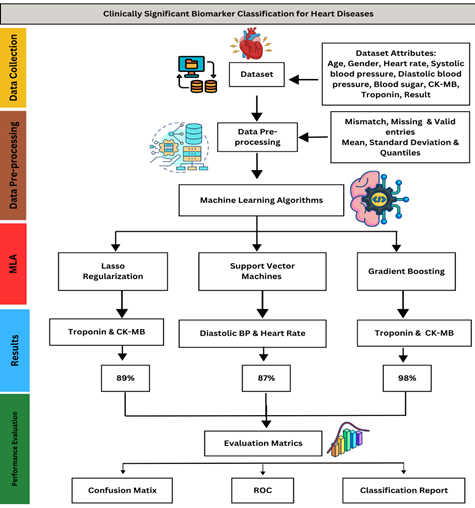
The approach employed in this research aims to achieve this challenging objective by applying a wide range of ML algorithms to a well-selected dataset. For this purpose, the proposed methodology comprises data collection and preprocessing, application of ML algorithms, and performance evaluation, as shown in Fig. 1 below.
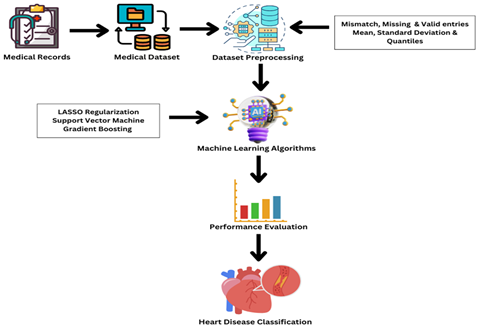
Figure 1. Heart Disease Classification Framework
2.1. Dataset and PreprocessingDataset related to heart diseases was extracted from the online repository [16] and organized for the purpose of this research. The properties of a dataset are its features that are essential to analyze and predict the concerned problem. Many factors are considered to predict diseases, such as gender, chest discomfort, and blood pressure. Conversely, one method for dataset attribute selection is to use the matrix of correlation. The dataset used in the study comprised 1,319 entries with the following 9 attributes, as shown in Table 2.
Table 2. Description and Classification of Attributes Used in the Dataset for Heart Diseases [16]
|
Attribute |
Description |
Data Type |
|---|---|---|
|
Age |
Patient’s age |
Integer |
|
Gender |
Patient’s gender (1 = Male, 0 = Female) |
Integer |
|
Heart Rate |
Heart rate of the patient (beats per minute) |
Integer |
|
Systolic Blood Pressure |
Patient’s systolic blood pressure (mmHg) |
Integer |
|
Diastolic Blood Pressure |
Patient’s diastolic blood pressure (mmHg) |
Integer |
|
Blood Sugar |
Patient’s blood sugar level (mg/dL) |
Float |
|
CK-MB |
Creatine Kinase-MB level |
Float |
|
Troponin |
Troponin level |
Float |
|
Result |
Diagnosis result (positive or negative) |
Categorical (Object) |
The graphical distribution of the individual attributes of the dataset reveals crucial trends, patterns, and variability. The representation provides a robust foundation for the application of ML models to predict heart diseases effectively. The pie charts shown in Fig. 2 allow an intuitive understanding of individual variables.

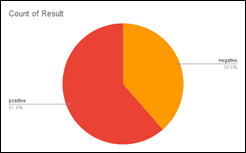
Figure 2. Distribution of Attributes in the Dataset (a) Age (b) Gender (c) Heart Rate (d) Systolic Blood Pressure (e) Diastolic Blood Pressure (f) Blood Sugar (g) CK-MB (h) Troponin (i) Results
Initially, the preprocessing of dataset involves removing noises or missing values to obtain accurate and authentic results. This was carried out by the addition of new variables with a strong predictive value and the removal of any features deemed unnecessary for analysis. The missing values were imputed, features were chosen and scaled, and classes were balanced to improve the accuracy of results. It was ensured that each feature had a standard deviation of one and a mean of zero.
Table 3. Data Quality of Dataset
|
Data Quality |
Count |
Percentage |
|---|---|---|
|
Valid |
1319 |
100% |
|
Mismatched |
0 |
0% |
|
Missing |
0 |
0% |
As shown in Table 3, dataset was preprocessed with 1319 valid entries. There were no mismatched or missing values. According to the table, the mean value is 56.2, while the standard deviation is 13.6. The distribution of data is shown by quantiles; the minimum quantile is 14 and the maximum quantile is 103. This characterizes the data as having central tendency and variability. Data distribution and the quantiles of dataset are shown below in Table 4.
Table 4. Data Distribution and Quantiles of Dataset
|
Data Distribution |
Value |
|---|---|
|
Mean |
56.2 |
|
Standard Deviation |
13.6 |
|
Quantiles |
|
|
Minimum |
14 |
|
25% |
47 |
|
50% (Median) |
58 |
|
75% |
65 |
|
Maximum |
103 |
The use of ML is on the increase in the field of cardiovascular medicine. Despite the availability of ML techniques, it still remains difficult to find the most practical ML algorithm for cardiovascular disease datasets [15]. The models used in this study are discussed below.
2.2.1. LASSO Regularization. Regression models are often applied in statistical analyses. They are commonly used to calculate the probability (often the expected risk) of some future occurrences or expected results [17].
LASSO regression is a common variable screening technique. The coefficient is always compressed by the addition of a penalty term to the model estimation term. The goal for it is to be simple enough, but still be able to solve the problems of overfitting and multiple correlations [18]. LASSO regression strives to find the variables and hence matches regression coefficients that lead to the lowest prediction error in a model. To do this, a constraint is applied to the model parameters, so that the sum of regression coefficients’ absolute values is less than the specified value (λ) [17].
The λ with the smallest deviation is what the cross-validation curve shows. This value results in the best fitting effect of the LASSO regression model [18].
Equation (1) eleborates the least squares method for linear regression, where is model parameter, is the input feature, is label, is the training sample number, is input data matrix, is the target outputs, and arg minis the minimum sum of squared errors for wWhereas,is the optimal analytical solution forw [18].
2.2.2. Support Vector Machine. SVM is a very powerful and frequently used ML technique for classification and regression. Its job is to separate different classes in a dataset by attempting to find a hyperplane maximizing the margin between the classes. Shipping means that it looks for the best boundary with which to distinguish between different categories of data points. SVM identifies the subsets of data points, the so-called support vectors, during the training process. As these points define the decision boundary, they are critical. In fact, only a small fraction of the whole dataset is recycled as support vectors which makes SVM efficient [19].
To measure how closely predictions and actual outcomes match, mean absolute error or MAE is used, as shown below in equation (2).
The definition of an estimator with respect to the determined parameter θ' is the root squared of the mean square error or RMSE. It may be computed using equation (3) which predicts that lower the RMSE, the better the performace of the model [20].<
In SVM, average distance can be calculated as in equation (4) which tells us how well the classes are separate [20].
Recursive Feature Elimination (RFE) method is particlulary used with SVM, where some features might be irrelvent or redundent which hurts the accuracy. It is an iterative method which trains the model, as well as measures and ranks the features’ importance based on the magnitude of model coefficient For linear SVM, coefficient directly indicates the feature importance, as shown in equation (5) below.
2.2.3. Gradient Boosting Classifier. Gradient boosting (GB) is one of the most powerful ML techniques used for regression and classification tasks. The method ensembles learning, also known as boosting, by combining multiple weak learners (models that perform slightly better than random guess) into a strong learner [21, 22].
It operates in a step-by-step fashion, whereby the successor reduces the error by learning from the mistakes of the predecessor. Weights are updated at each stage of this process. The iterations keep going until the loss function is minimized. The additive model, the loss function, and weak learners are the three primary components of GB. The loss function is used to calculate the accuracy of heart disease prediction using the existing data. The additive model adds one weak learner at a time, working sequentially and iteratively. Weak learners are the ones that categorize the data poorly [21].
The aim of GB is to estimate a target function F∗(x), which associates a value y with each input instance x. To minimize a loss function L(y,F(x)), it measures how well do predictions by the model fit to the real values of y. Moreover, it includes ways to prevent overfitting. This applies shrinkage (decreasing the contribution of each model) and reducing model complexity [22].
2.3. Performance Evaluation2.3.1. Accuracy. Accuracy is the ratio of accurately predicted observation to the total observation [1]. Two performance metrics, namely accuracy and false alarm rate computed as equation 5, are used to assess the performance [23].
Here, true positive is TP, true negative is TN, false negative is FN, and false positive is FP. False alarm rate (FAR) can be calculated as shown in equation 6 below [23].
2.3.2. Precision. It is the ratio of true positive observations to the sum of true positives and false positive observations. It is computed below as shown in equation 7.
Here, true positive is TP while false positive is FP.
2.3.3. Recall. It is the ratio of true positive predictions to the sum of true positive and false negative predictions. By definition, it is calculated as
2.3.4. F1 Score. It is the average of recall and precision. So, it can be calculated as [1]
3. RESULTS
The dataset was split into training (70%), validation (15%), and testing (15%) subsets. This sort of splitting prevents overfitting and ensures fair evaluation. Out of 1319 samples in the dataset, 923 samples were trained, while 198 samples were validated and tested on models. The process of determining which hyperparameter combinations enable the model to optimize its accuracy is known as hyperparameter tuning [24]. The parameters employed for classification are shown below in Table 5.
Table 5. Hypertuning Parameters
|
Support Vector Machine |
|
|---|---|
|
Different Regularization Strengths C |
[0.01, 0.1, 1, 10] |
|
Kernal |
Linear |
|
Gamma |
Scale |
|
Top Feature Selection |
5 |
|
Gradient Boosting |
|
|
n_estimators |
10, 50, 100 |
|
learning_rate |
0.1 |
|
max_depth |
3 |
|
Subsample |
1.0 |
|
Lasso Regularization |
|
|
Alpha |
1.0 |
|
max_iter |
1000 |
|
Tolerance |
1e-4 |
3.1. LASSO Regularization
Lasso (L1) regularization was applied to logistic regression in order to predict the most significant feature by shrinking the irrelevant features towards zero, as shown in Table 6.
Table6. Significant Clinical Biomarkers and their Respective Coefficient Value Predicted by Lasso Regularization
|
Clinical Biomarker |
Coefficient Value |
|---|---|
|
Troponin |
78.9295 |
|
CK-MB |
19.0294 |
|
Age |
0.5598 |
|
Gender |
0.1626 |
|
Heart Rate |
0.0059 |
|
Systolic Blood Pressure |
-0.0754 |
|
Diastolic Blood Pressure |
0.0322 |
|
Blood Sugar |
-0.1193 |
According to the table, troponin has the highest coefficient valuemaking it the most influential biomarker, probably because it is linked to heart-related diseases. CK-MB also plays a significant role but much lower than troponin. Even though it has less of an impact, age still influences prediction. Lasso shrinks the value of less important features to zero which helps in feature selection.
Through Lasso regularization, the bar graph classifies the significant biomarkers for heart disease prediction, showing their respective coefficients on y-axis and biomarkers as features on x-axis. The significance of these characteristics in predicting the target variable is shown by their respective Lasso regression coefficient. The stronger the correlation with the result, the higher the coefficient.
3.2. Classical Gradient BoostingThe total number of samples were 1319. The samples used for training, validation, and testing were 923, 198 and 193, respectively. Validation accuracy, checked with 50, 100, and 200 number of estimators was 0.9697, where test samples were evaluated through confusion matrix. The most effective biomarkers found by using the GB model, ordered according to how significant they were in predicting the results, are shown in Table 7 below.
Table 7. Top Biomarkers Identified via GB
|
Rank |
Feature |
Importance |
|---|---|---|
|
7 |
Troponin |
0.609001 |
|
6 |
CK-MB |
0.376480 |
|
3 |
Systolic blood pressure |
0.005626 |
|
5 |
Blood sugar |
0.004981 |
|
1 |
Gender |
0.001960 |
Based on the above table, troponin stands out as the most significant predictor with the highest significance score (~0.6) in the graph, which displays feature importance ratings determined via GB. With a significant contribution (~0.3) CK-MB comes next, emphasizing its value in the diagnosis of cardiac disorders. On the other hand, characteristics like blood sugar, systolic and diastolic blood pressure, age, gender, and heart rate remain insignificant and play only a small part in the model’s predictions. According to these findings, troponin and CK-MB are the most important biomarkers for predicting cardiac-related outcomes, whereas other characteristics have a minimal bearing on the final prognosis.
3.3. Support Vector MachineSVM was used to classify biomarkers through bar graph, as shown in Fig. 5, using recursive feature elimination (RFE). Based on the impact of biomarkers on classification, the model prioritizes diastolic blood pressure, heart rate, and blood sugar as key predictors, signifying their higher contribution to the prediction of heart diseases, as shown in Figure 5. It shows how efficiently these features separate heart disease patients from normal individuals.
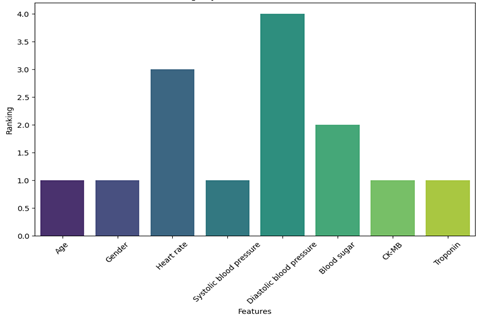
Figure 3. Biomarker Identification via SVM
After training the model, hypertuning parameters with different values of regularization were set. The best performance was achieved at C = 10, with a validation accuracy of 86.87%, showing the model’s robustness in classifying heart diseases, as shown in Table 9.
Table 9 . Grid Search for the Regularization Parameter
|
Regularization Parameter Values |
Accuracy |
|
0.01 |
67.68% |
|
0.1 |
73.23% |
|
1 |
76.77% |
|
10 |
86.87% |
These algorithms were evaluated by using confusion matrix. It is a valuable tool to measure the performance of classification models. It provides the breakdown of correct and incorrect predictions across various classes.

Figure 4. Confusion Matrix for Performance Evaluation (a) LASSO Regularization (b) SVM (c) GB
The confusion matrix of Lasso regularization, shown in Fig. 5 (a), revealed that 66 healthy individuals were classified correctly. On the other hand, 119 individuals with heart disease were identifed correctly. The model is robust as the rate of false negative and false positive remains low, that is, 8 and 5 misclassifications, respectively.
SVM classified 65 cases accurately as healthy individuals and 109 as diseased. On the contrary, it mistakenly identified 9 healthy individuals as diseased and failed to detect 15 cases of affected patients, as shown in Fig. 5 (b). The GB classifier obtained a high accuracy of 95% according to the confusion matrix, as shown in Fig. 5 (c). Moreover, it accurately detected 161 positive cases (true positives) and 97 negative cases (true negatives). Nevertheless, it incorrectly identified two positive cases as negative (false negatives) and four negative cases as positive (false positives). These findings show that the GB model performs an effective task of classifying attributes into appropriate classes.

Figure 5. Receiver Operating Characteristics (ROC) Curve (a) LASSO Regularization (b) SVM (c) GB
These models were also evaluated based on the receiver operating characteristics (ROC) curve. It shows the graphical representation of the diagnostic ability of a classification model. As the classification threshold changes, this plot illustrates the trade-off between the true positive rate (sensitivity) and the false positive rate (specificity). The performance of LASSO regularization is shown in Fig. 6 (a) graphically by using the ROC curve. The model can differentiate between positive and negative classes with 75% probability, as indicated by its modest performance area under graph (AUC) of 0.75.
The ROC curve of SVM, shown in Fig. 6 (b), has an AUC of 0.96 which is close to 1. This shows the excellent performance of the model in distinguishing between positive and negative classes. The model achieves a high true positive rate (sensitivity) and a low false positives rate (specificity) as the curve moves upwards and comes close to the top-left corner of the plot. With an AUC of 1.0, the ROC curve shows that GB, as shown in Fig. 6 (c), performs exceptionally well and comes close to being a perfect classifier. This model shows specificity through a true positive rate nearly equal to 100% and a false positive rate close to 0%.
Table 10. Classification Report
|
Model |
Class |
Precision |
Recall |
F1-score |
Support |
Accuracy |
|---|---|---|---|---|---|---|
|
Lasso Regularization |
0 |
0.93 |
0.94 |
0.93 |
74 |
0.89 |
|
1 |
0.89 |
0.96 |
0.93 |
124 |
||
|
Support Vector Machine |
0 |
0.81 |
0.88 |
0.84 |
74 |
0.87 |
|
1 |
0.92 |
0.88 |
0.90 |
124 |
||
|
Gradient Boosting |
0 |
0.98 |
0.96 |
0.97 |
74 |
0.98 |
|
1 |
0.98 |
0.99 |
0.98 |
124 |
Comprehensive performance evaluation was conducted to assess the effectiveness of the models for feature selection. Metrics including accuracy, precision, recall, and F1-score were used to assess each model’s performance. In Lasso regularization, hyperparameter tunning was performed by using different values of alpha to optimize regularization strength. The validated accuracy of 89.39% is shown by 0.001. It ensures a fine balance between feature selection and predictive performance. In the final model evaluation, the test dataset showed 93.43% accuracy, ensuring a high reliability of the model in biomarker classification for heart diseases. After the training model, hypertuning parameter with different values of the regularization parameter were performed for SVM. The best performance was achieved at C = 10, with a validation accuracy of 86.87%, which shows its robustness in classifying heart diseases. This model achieves a precision of 92% and a recall of 88%. GB correctly classified the major cases with an overall accuracy of 98%. With a precision rate of 98%, it actually classified negative cases with 98% recall.
The classification report is displayed in Table 9. Performance metrics revealed that GB outperforms both Lasso regularization and SVM with the highest accuracy of 98% and balanced precision, recall, and F1-scores across both classes, making it a reliable model for classification.
4. DISCUSSION
A key element of preventive healthcare is the early detection of cardiac disease, since it enables efficient interventions that significantly improve patient diagnosis. Numerous conditions, such as hypertension, coronary artery disease, valvular heart disorders, and cardiomyopathy contribute to heart illness, which is categorized as a complicated clinical syndrome. The heart’s ability to sufficiently pump blood to meet the body’s needs is severely hampered by the reduced cardiac function caused by the aforementioned disorders [25].
The global disease burden of ischemic heart disease (IHD) is huge, that is, approximately 125 million individuals are affected world wide, presenting 1.72% of the global population. There were about 9 million deaths alone in 2017 due to IHD, making it a major cause of mortality. By 2030, an increase is expected in its prevalence, which is forecasted to be 1,845 per 100,000 persons due to aging and worsening lifestyle risk factors [26]. This escalating burden signifies the critical need for effective and early diagnostics.
This study found that troponin and CK-MB are consistently significant biomarkers to predict heart disease using both GB and Lasso regularization. Diastolic blood pressure and heart rate are also significant determinants of heart disease, as suggested by SVM. The difference is created by clinical biomarker identification through important feature selection across these algorithms due to their underlying feature selection mechanisms and functional framework.
Lasso regularization linearly builds the correlation between the predictor and outcomes and shrinks the value of non-important features to zero, while the dominant becomes more prominent [27]. In GB, the relationship is built non-linearly among features and weak points are boosted to equally distribute their potential and rank them according to their importance [12]. On the other hand, SVM makes feature classification by using hyperplane with nonlinear interaction [28]. Acute cardiac biomarkers, such as troponin and CK-MB, because of their strong correlation with heart disease, are classified by Lasso regularization and GB. While, hemodynamic parameters including diastolic blood pressure and heart rate, which contribute to the risk of long-term heart disease, are prioritized by SVM.
In this study, GB outperformed others with 98% accuracy. This was also demonstrated by the study of Ren et al., which predicted coronary heart index (CHI) as a non-invasive, effective, and trustworthy diagnostic tool based on an XGB-based model. The application of this novel technique may result in more accurate and successful treatment plans, which would ultimately enhance patient outcomes [29]. The Lasso regression model works well with low-dimensional data, is simple to use, and is highly effective with linear data. Nevertheless, when variables have intricate relationships, it fails to achieve high accuracy [30]. The random forest model can suffer from over-fitting if it detects noise in the training data, but it scales well with big datasets, achieves high accuracy with many decision trees, and is robust to noise. In contrast, the SVM model is more robust than the Lasso regression model, performs well in classifying semi-structured or unstructured data, and has a lower risk of overfitting. However, it is not appropriate for large datasets with many features or datasets with missing values, which results in poor generalization on new data and lack of interpretability [31].
Heart diseases comprise complex pathophysiological processes which vary greatly among individuals. Hence, it is difficult to collect all features. Consequently, the attributes employed for the ML model might not be applicable to all individuals. ML algorithms depend on multiple factors. In addition to clinical characteristics, the ultimate performance of a model is determined by its complexity, hyperparameters, and method variations.
One very specific biomarker of myocardial damage is troponin, which is released into the bloodstream during cardiac injury. Studies have repeatedly demonstrated its use as a diagnostic and prognostic tool in heart disease [32]. Myocardial CK-MB or creatine kinase, for many years, has been considered an isoenzyme of creatine kinase and used to identify myocardial necrosis. Though less specific than troponin, CK‐MB remains a useful marker and, in combination with other clinical indicators, may still be useful [33]. Although these biomarkers are used commonly in clinics, research on how they could be incorporated into ML models remains scarce. The performance of various ML models varies greatly. The ideal ML model should be determined based on the the quantity and quality of the data, as well as the optimized algorithms with the best hyperparameters.
Troponin is an important component of contractile apparatus in cardiac myocytes and results in the formation of troponin-tropomyosin complex. This complex is significant for the interaction between actin and myosin during muscle contraction through calcium signaling. Ischemia and necrosis lead to myocardial injury that affects cardiac sarcolemma. This causes the release of cardiac specific Troponin T and Troponin I into the bloodstream. This is a direct indicator of cardiomyocyte damage. Troponin is widely used as a gold standard biomarker for the diagnosis of acute myocardial infarction, since elevated levels of Troponin I and Troponin T have high sensitivity and specify to cardiomyocyte damage. During myocardial injury, troponin is present in 99% high concentration for days, acting as a diagnostic window [8]. In addition to its diagnostic role, troponin level is also associated with cardiac damage and highlights risk stratification and long-term prognosis in patients with heart disease [34].
Creatine Kinase-MB (CK-MB) is an isoenzyme of creatine kinase that acts as a valuable biomarker for myocardial injury, particularly working with troponin. CK-MB level rises in blood rapidly after myocardial damage. It peaks within 18 to 24 hours and normalizes in 2 to 3 days, making it useful in the diagnosis of recurrent ischemic event and reinfarction. It is also used in monitoring perioperative cardiac infarction and differentiating cardiac injury from skeletal muscle injury [33].
Diastolic blood pressure (DBP) and heart rate are chronic risk markers that emphasize long-term progression of cardiovascular events due to autonomous cardiac dysfunction. They are associated with coronary perfusion impairment, vascular stiffness, left ventricular hypertrophy, inflammation, and oxidative stress [34].
This study signifies the combined importance of troponin, CK-MB, and age in ML-based predictive models. Advances with computational methods enable the integration of various biomarkers with demographic and clinical data that helps to improve the reliability and accuracy of prediction.
Troponin and CK-MB are biological indicators of myocardial pathophysiology. Their elevated levels signal critical cellular processes, such as apoptosis, necrosis, and inflammation, which are the hallmark of heart diseases. The findings highlight the importance of such models being integrated within diagnostic procedures and show that clinical biomarkers may be combined with machine learning for the prediction of heart disease. The goal of future research should be to validate these results in broader and more varied groups. Finally, predictive accuracy of these models may also be improved by examining imaging data and other clinical characteristics.
4.1. ConclusionThis investigation underscores the significance of troponin and CK-MB as powerful diagnostic markers for heart conditions. A variety of ML approaches were used to consistently find these markers, namely Lasso regularization, SVM, and GB. Their use in clinical cardiology confirmed their biological value as biomarkers of myocardial damage and ischemia. Numerous algorithms showed that machine learning and clinical biomarkers can be joined to increase diagnostic precision. Future studies should attempt to improve their predictive performance by incorporating other biomarkers and validate these findings in larger, more diverse populations. Utilizing cutting edge computational techniques, this strategy offers a mechanism to more efficiently diagnose and treat heart diseases, ultimately improving patient outcomes.
CONFLICT OF INTEREST
The authors of the manuscript have no financial or non-financial conflict of interest in the subject matter or materials discussed in this manuscript.
DATA AVAILABILITY STATEMENT
Data sharing is not applicable to this article as no new data were created or analyzed during this study.
FUNDING DETAILS
The authors did not receive any funding for this article.
REFERENCES
- Shah D, Patel S, Bharti SK. Heart disease prediction using machine learning techniques. SN Comput Sci. 2020;1:e345. https://doi.org/10.1007/s42979-020-00365-y
- Jevin AJ, Jayant H, Sanjay R, Hemasai V, Venkatasrinivas PV. Heart disease identification method using machine learning classification in e-healthcare. Int J Adv Res Arts Sci Eng Manag. 2023;10(3):2322–2327.
- Ruetzler K, Smilowitz NR, Berger JS, et al. Diagnosis and management of patients with myocardial injury after noncardiac surgery: a scientific statement from the American Heart Association. Circulation. 2021;144:e287–e305. https://doi.org/10.1161/CIR.0000000000001024
- Lakatta EG, Levy D. Arterial and cardiac aging: major shareholders in cardiovascular disease enterprises: part II: the aging heart in health: links to heart disease. Circulation. 2003;107(2):346–354. https://doi.org/10.1161/01.CIR.0000048893.62841.F7
- Gheisari F, Emami M, Shahraki HR, Samipour S, Nematollahi P. The role of gender in the importance of risk factors for coronary artery disease. Cardiol Res Pract. 2020;2020:e527820. https://doi.org/10.1155/2020/6527820
- Carey RM, Whelton PK. Prevention, detection, evaluation, and management of high blood pressure in adults: synopsis of the 2017 American College of Cardiology/American Heart Association hypertension guideline. Ann Intern Med. 2018;168(5):351–358. https://doi.org/10.7326/M17-3203
- Yancy CW, Jessup M, Bozkurt B, et al. 2017 ACC/AHA/HFSA focused update of the 2013 ACCF/AHA guideline for the management of heart failure: a report of the American College of Cardiology/American Heart Association task force on clinical practice guidelines and the Heart Failure Society of America. J Am Coll Cardiol. 2017;70(6):776–803. https://doi.org/10.1016/j.jacc.2017.04.025
- Thygesen K, Alpert JS, Jaffe AS, et al. Fourth universal definition of myocardial infarction (2018). J Am Coll Cardiol. 2018;72(18):2231–2264. https://doi.org/10.1016/j.jacc.2018.08.1038
- Rani P, Kumar R, Ahmed NMOS, Jain A. A decision support system for heart disease prediction based upon machine learning. J Reliab Intell Environ. 2021;7:263–275. https://doi.org/10.1007/s40860-021-00133-6
- Saboor A, Usman M, Ali S, Samad A, Abrar MF, Ullah N. A method for improving prediction of human heart disease using machine learning algorithms. Mob Inf Syst. 2022;2022:e410169. https://doi.org/10.1155/2022/1410169
- Ali MM, Paul BK, Ahmed K, Bui FM, Quinn JMW, Moni MA. Heart disease prediction using supervised machine learning algorithms: performance analysis and comparison. Comput Biol Med. 2021;136:e104672. https://doi.org/10.1016/j.compbiomed.2021.104672
- Feng M, Wang X, Zhao Z, Jiang C, Xiong J, Zhang N. Enhanced heart attack prediction using extreme gradient boosting. J Theo Pract Eng Sci. 2024;4(4):9–16. https://doi.org/10.53469/jtpes.2024.04(04).02
- Wang Y. Identification of cardiovascular diseases based on machine learning. Paper presented at: International Symposium on Artificial Intelligence for Medicine Sciences, October 13–15, 2022; Amsterdam, Netherlands. https://doi.org/10.1145/3570773.3570855
- Kumar A, Dhanka S, Sharma A, et al. A hybrid framework for heart disease prediction using classical and quantum-inspired machine learning techniques. Sci Rep. 2025;15:e25040. https://doi.org/10.1038/s41598-025-09957-1
- Nadakinamani RG, Reyana A, Kautish S, et al. Clinical data analysis for prediction of cardiovascular disease using machine learning techniques. Comput Intell Neurosci. 2022;2023:e815067. https://doi.org/10.1155/2022/2973324
- Rashid TA, Hassan B. Heart attack dataset. Menedleey Data Web site. Accessed April 29, 2022. http://dx.doi.org/10.17632/WMHCTCRT5V.1
- Cook JA, Ranstam J. Overfitting. Br J Surg. 2016;103(13):e1814. https://doi.org/10.1002/bjs.10244
- Wang S, Chen Y, Cui Z, Lin L, Zong Y. Diabetes risk analysis based on machine learning LASSO regression model. J Theory Pract Eng Sci. 2024;4(01):58–64. https://doi.org/10.53469/jtpes.2024.04(01).08
- Cervantes J, Garcia-Lamont F, Rodríguez-Mazahua L, Lopez A. A comprehensive survey on support vector machine classification: applications, challenges and trends. Neurocomputing. 2020;408:189–215. https://doi.org/10.1016/j.neucom.2019.10.118
- Rauf A, Ammar M, Azhar M, Noor N, Bakhtiar SM. Unveiling the Secrets of obesity with machine learning (ml) techniques/algorithms. Curr Trend OMICS. 2024;4(1):55–76. https://doi.org/10.32350/cto.41.04
- Sultan SQ, Javaid N, Alrajeh N, Aslam M. Machine learning-based stacking ensemble model for prediction of heart disease with explainable AI and K-Fold cross-validation: a symmetric approach. Symmetry. 2025;17(2):e185. https://doi.org/10.3390/sym17020185
- Bentéjac C, Csörgő A, Martínez-Muñoz G. A comparative analysis of gradient boosting algorithms. Artif Intell Rev. 2021;54:1937–1967. https://doi.org/10.1007/s10462-020-09896-5
- Primartha R, Tama BA. Anomaly detection using random forest: a performance revisited. Paper presented at: 2017 International Conference on Data and Software Engineering (ICoDSE); November 1–2, 2017; Palembang, Indonesia.
- Sharma NK, Chauhan AS, Fatima S, Saxena S. Enhancing heart disease diagnosis: leveraging classification and ensemble machine learning techniques in healthcare decision-making. J Integr Sci Technol. 2024;13(1):e1016. https://doi.org/10.62110/sciencein.jist.2025.v13.1016
- Alsabhan W, Alfadhly A. Effectiveness of machine learning models in diagnosis of heart disease: a comparative study. Sci Rep. 2025;15:e24568. https://doi.org/10.1038/s41598-025-09423-y
- Khera AV, Emdin CA, Drake I, et al. Genetic risk, adherence to a healthy lifestyle, and coronary disease. N Engl J Med. 2016;375(24):2349–2358. https://doi.org/10.1056/nejmoa1605086
- Albahr A, Albahar M, Thanoon M, Binsawad M. Computational learning model for prediction of heart disease using machine learning based on a new regularizer. Comput Intell Neurosci. 2021;2021:e628335. https://doi.org/10.1155/2021/8628335
- Hoque R, Billah M, Debnath A, Hossain SMS, Sharif NB. Heart disease prediction using SVM. Int J Sci Res Arch. 2024;11(2):412–420. https://doi.org/10.30574/ijsra.2024.11.2.0435
- Ren W, Zhang Z, Wang Y, et al. Coronary health index based on immunoglobulin light chains to assess coronary heart disease risk with machine learning: a diagnostic trial. J Transl Med. 2025;23:e22. https://doi.org/10.1186/s12967-024-06043-4
- Uddin S, Khan A, Hossain ME, Moni MA. Comparing different supervised machine learning algorithms for disease prediction. BMC Med Informat Dec Mak 2019;19:e281. https://doi.org/10.1186/s12911-019-1004-8
- Kwiendacz H, Huang B, Chen Y, et al. Predicting major adverse cardiac events in diabetes and chronic kidney disease: a machine learning study from the Silesia Diabetes-Heart Project. Cardiovasc Diabetol. 2025;24:e76. https://doi.org/10.1186/s12933-025-02615-w
- Collet JP, Thiele H, Barbato E, et al. 2020 ESC guidelines for the management of acute coronary syndromes in patients presenting without persistent ST-segment elevation. Eur Heart J. 2021;42(14):1289–1367. https://doi.org/10.1093/eurheartj/ehab285
- Boulet J, Sridhar VS, Bouabdallaoui N, Tardif JC, White M. Inflammation in heart failure: pathophysiology and therapeutic strategies. Inflamm Res. 2024;73:709–723. https://doi.org/10.1007/s00011-023-01845-6
- Potter JM, Hickman PE, Cullen L. Troponins in myocardial infarction and injury. Aust Prescr. 2022;45(2):53–57. https://doi.org/10.18773/austprescr.2022.006