Obaidullah Nadeem1*, Rizwan Hameed1, and Pernia Ayyaub2
1University of Engineering and Technology, Lahore, Pakistan
2The Urban Unit, Government of Punjab, Lahore, Pakistan
*Corresponding Author: [email protected]
Planned gated and non-gated communities have appeared rapidly all over the world due to the public amenities and quality of life they offer. It is generally assumed that gated communities provide better security as compared to non-gated communities. However, population growth and urban sprawl have led to many social and physiological issues including the death of old city traditions, community identity, and lack of the sense of community. Thus, modern urban development faces the challenge of meeting the habitation and social needs of people with lesser face-to-face interaction and more mobile and fluid ways of communication. Lahore is the second largest city of Pakistan. It has experienced the growth of private sector led gated communities over several years. This research aims to compare their physical characteristics, as well as the perception of security, extent of social interaction, and the sense of community among their residents. For this purpose, the data of interviews with the residents of 4 selected gated and non-gated communities of Lahore was collected. The findings revealed that the sense of community is strongly associated with the extent of social interaction in both gated and non-gated communities. Contrary to what the literature generally suggests, this study found a higher sense of security among the residents of non-gated communities than gated communities. Finally, it was concluded that the participation of the residents in community development and management activities would promote more socially cohesive and vibrant communities.
Keywords: community interaction, gated communities, housing societies, residents, sense of community, sense of security
Gated communities are residential areas with surrounding walls or a fence, with limited access and prohibiting trespassing for security and other reasons. The number of gated communities has been increasing rapidly in all parts of the world including USA, Europe, and Asia (RafieManzelat, 2016). To overcome the issues of street crime, gated communities are given special importance by urban planners since they provide a safer environment. Crime rate in non-gated communities is nearly 25% higher than that in gated communities. These communities are economically seen as a good value for money since they provide secure and safe zones with a higher level of services and amenities (Manzi & Smith, 2005). Whereas, for some people, gated communities symbolize a luxurious lifestyle (Kim, 2006; Bint-e-Waheed & Nadeem, 2020). People choose to live in gated communities for various reasons, such as security, exclusivity, or lifestyle preferences. However, the impact of gated communities on the sense of community among residents is not distinct. Sense of community (SoC) is defined as “a feeling of belonging to a place, a feeling that they matter to each other, a mutual faith that all of their rights will be fulfilled with their mutual commitment towards each other” (McMillan & Chavis, 1986). Lu et al. (2018) found that the residents of gated communities feel social attachment with the place, since they are familiar with their neighbours and more actively involved in community level social events. This leads to developing a sense of community among the residents of such neighbourhoods. On the contrary, some authors found that there remains a lack of privacy and social cohesion in gated communities as compared to non-gated communities, arguing that people's relationships with others are influenced by their feelings about the living spaces (Mousavinia, 2022). This raises questions as to how far the socioeconomic status of the residents, physical design characteristics, public facilities, and attachment with the neighbourhood contribute to SoC across gated and non-gated communities (Li et al., 2021). Bandauko et al. (2022) suggested further research to determine the factors that motivate people to reside in different types of communities and help promote social interaction and SoC. In this context, Lahore offers an interesting case to explore different factors that affect how people connect and interact in gated and non-gated communities.
Lahore is the second largest city of Pakistan and its population is growing rapidly. Housing in Lahore has become one of the major needs of the public, thus creating a business opportunity for private developers. In this regard, gated communities have emerged as a new concept for providing a safe habitat and lavish lifestyle to the residents of Lahore. These are the main attraction for status-conscious people, making such communities unaffordable and inaccessible for the middle- and lower-income groups. On the contrary, non-gated communities are said to be more accessible to different income groups and provide relatively greater opportunities for social interaction (Boonjubun, 2019). So far, there has been limited research on gated and non-gated communities in Pakistan. Rahmaan and Anis (2009) studied the dynamics of gated communities with respect to their impact on sustainable development. Their survey revealed that most of the residents moved into gated communities for a better living, social environment, and security reasons. They were satisfied with their neighbours and the management With higher income group people, valuing security more than the middle-income group. Bint-e-Waheed and Nadeem (2020) analysed the linkages between the perception of security risk in gated and non-gated communities of Lahore. They concluded that the residents of non-gated communities felt more insecure due to a very high crime rate than in gated communities. Gul et al. (2018) studied possible association between the perception of crime and walking in gated and non-gated neighbourhoods of Karachi but couldn't find any conclusive evidence of any kind of relationship. However, the nature of and variation in SoC and the factors that may promote social interaction and influence SoC in both the gated and non-gated communities have not been identified yet in case of Lahore through empirical research. This study determines the strength of the relationship between SoC and various attributes of gated and non-gated communities that would help to guide the future planning of socially cohesive and vibrant neighbourhoods in Lahore and across the country.
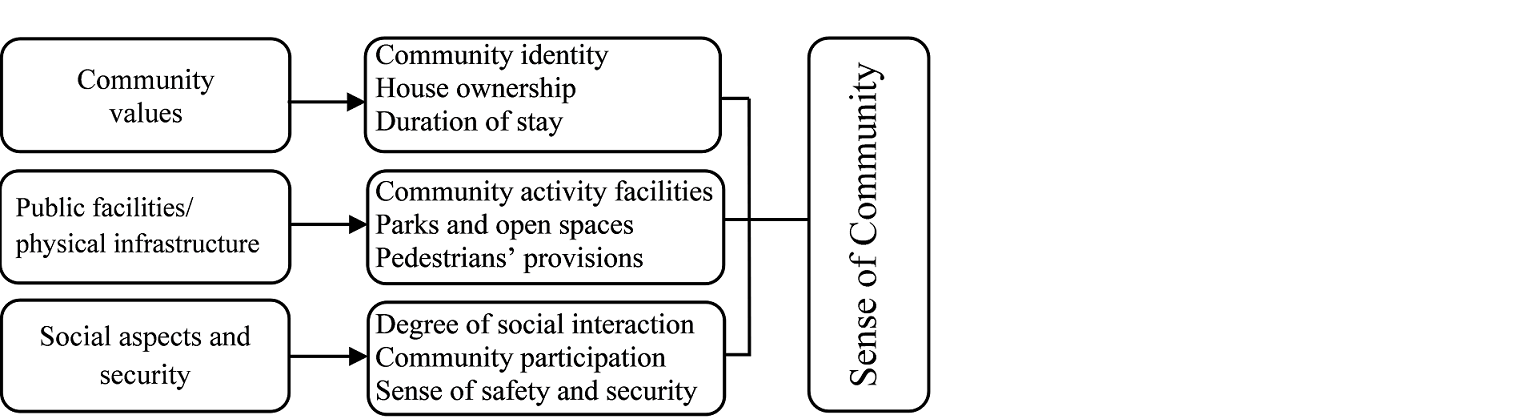
This research is aimed to assess the sense of community or SOC in both gated and non-gated communities of Lahore. To develop a deeper understanding of the relationship among neighbourhood characteristics, gated elements, and SOC, a thorough review of relevant literature was conducted. There is a consensus that communities' culture/core values, neighbourhood ties, sense of security, and availability of facilities/public spaces for the satisfaction of physical and social needs play an important role in promoting SOC (Moustafa, 2009; Link et al., 2021; Li et al., 2021). Hence, a conceptual framework encompassing community values was developed, taking into account the physical and social attributes of neighbourhoods and the residents' mutual interaction (see Fig. 1).
Figure 1
Conceptual Framework of SOC
The conceptual framework hypothesises that community values, physical infrastructure, social aspects, and security are the major factors that shape a community. Note that community values refer to the shared norms, beliefs, and goals that guide the behaviour and decisions of a group of people. Several authors have proposed this kind of conceptual framework, whilst arguing that such factors help to build the community identity, shape household characteristics, public facilities, physical and social activity patterns, and develop a sense of safety. Compared to community values, community identity refers to the sense of belonging and identification that individuals feel with a particular group. All these attributes also contribute toward developing SOC among the residents of a neighbourhood or housing scheme (Farahani & Lozanovska, 2014; Francis et al., 2012). Based on the above premise, the following four hypotheses were developed.
H1: SOC is associated with the perception of security in the community.
H2: SOC is associated with the extent of social interaction in the community.
H3: Neighbourhood satisfaction is associated with the extent of social interaction in the community.
H4: SOC is associated with the duration of stay in the community.
To test the above hypotheses, a questionnaire survey was conducted with the residents of two gated and two non-gated communities located in different parts of Lahore, Pakistan. To select the communities, data of public and private housing societies were obtained from the Lahore Development Authority (LDA). In the year 2022, there were 15 public sector and 282 approved private sector housing societies in Lahore. The public sector housing societies are managed by LDA, whereas many private societies are managed by private developers or function as cooperative housing societies. Notably, most of the private housing societies are underdeveloped with an area of below 500 kanals.
The two selected gated communities from the private sector included WAPDA Town Phase I (a fully developed cooperative housing society spread at an area of 9280 kanals and largely belonging to the high-income group) and Pak Arab Housing Society (a fully developed private housing society spread at an area of 1530 kanals mainly belonging to the middle-income group). The two selected non-gated communities were Johar Town Phase I (8540 kanals) and Taj Pura (912 kanals). Both of these are public sector housing societies, one belongs to the high-income group and the other belongs to the low- and middle-income groups. Thus, the sample represented all income groups. The respondents were selected based on different sizes of plots/dwelling units using stratified random sampling technique. Sample size was calculated using Slovin's formula (Adhikari, 2021):
n=N / (1+Ne2)
where
Total number of households= N
Margin of error =e
Final number of sample size
Sample size of gated communities: 134
Sample size of non-gated communities: 136
Total sample size = 270
The interview data was analysed by using Statistical Package for Social Sciences (SPSS) and MS Excel software. In addition to calculating the frequencies of responses to each question, cross tables were generated and Chi-square test was performed. The aim was to test the hypotheses to determine if there exists any relationship between different attributes of community and SOC among its residents. Chi-square test is a well-recognized inferential statistical method frequently used to test hypotheses. Cross tables are generated to compare the results of categorical independent and dependent variables as part of the Chi-square test. This is useful when it is intended to explore the association between two variables (Ewing & Park, 2020).
The results presented in Table 1 show that most of the respondents from both the gated and non-gated communities were aged between 18-50 years. All of them were well educated and had a bachelor or master degree, while only 31% were either matric or intermediate.
Table 1
Socioeconomic Profile of the Respondents
|
Gated Communities |
Non-Gated Communities |
|
|
Response Percentage |
||
|
Age of Respondent |
|
|
|
18-30 years |
29.6 |
36.5 |
|
Above 30 years |
38.5 |
47.4 |
|
Above 50 years |
31.9 |
16.1 |
|
Education of Respondent |
|
|
|
Matric |
10.4 |
6.6 |
|
Intermediate |
20.7 |
24.1 |
|
Bachelors |
48.9 |
48.9 |
|
Masters |
20 |
20.4 |
|
Monthly Income |
||
|
100,000-150,000 |
34.8 |
51.8 |
|
150,000-200,000 |
43 |
33.6 |
|
More than 250,000 |
22.2 |
14.6 |
|
Ownership of House |
||
|
Rented |
16.3 |
15.3 |
|
Owned |
83.7 |
84.7 |
|
Plot Size |
||
|
1 Kanal |
19.3 |
16.1 |
|
10 Marla |
43 |
25.5 |
|
5 Marla |
37.8 |
27.0 |
|
3 Marla |
None |
31.4 |
|
Duration of Stay |
||
|
More than 5 years |
32.6 |
40.9 |
|
More than 10 years |
49.6 |
44.5 |
|
More than 20 years |
16.3 |
13.9 |
|
More than 30 years |
1.5 |
0.7 |
The reported monthly income of the residents of gated communities ranged between Rs. 100,000-200,000, while that of non-gated communities ranged between Rs.100,000-150,000. Most of the respondents from both types of societies owned their respective houses and only 16% were living on rent. However, the size of plot/dwelling unit varied, as a small proportion of respondents of gated communities were living in 1 Kanal houses, while almost half of them lived in 10 Marla houses, and 38% in 5 Marla houses. Similarly, a very small proportion of the respondents from non-gated communities lived in 1 Kanal houses, 25% of them in 10 Marla houses, and the rest of them in either 5 or 3 Marla houses. This indicates that a majority of the residents of gated communities belong to the high-income group, whilst those living in non-gated communities belong to the middle-income group. The duration of stay in a neighbourhood can play a vital role in developing one's affection and attachment with their neighbours and neighbourhood. Out of the respondents from gated communities, one third had been residing in their respective community for more than 5 years, half of them for more than 10 years, and only a small proportion for 20 years or more. Approximately, 40% respondents of non-gated communities had been residing there for more than 5 years, almost the same proportion for 10 years, and the remaining for 20 years or more. This suggested that the majority of respondents had been living there for the last 10 years or so.
Physical Activity Facilities (PAF)
The respondents were asked about some physical characteristics of their neighbourhoods/societies, as well as the level of their engagement in various physical activities that may influence SOC. Figure 2 shows that 44% of the respondents from gated communities stated that the neighbourhood provided them with PAF, 25% said that PAF were not provided, and 31% said that these were provided to some extent.
Figure 2
Physical Activities Facilities (PAF) in Case Study Areas
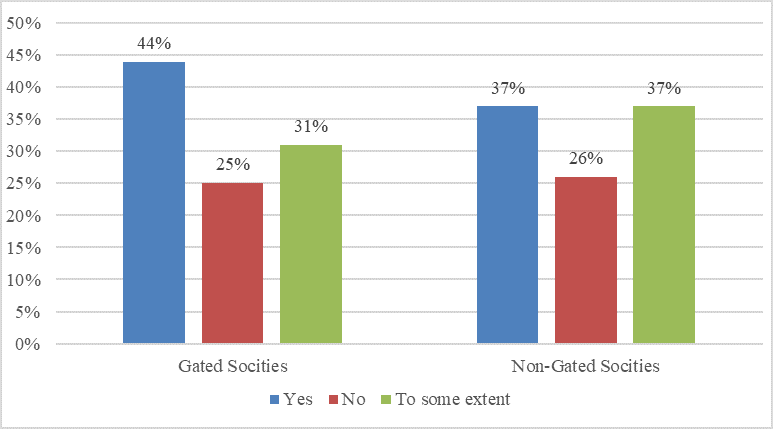
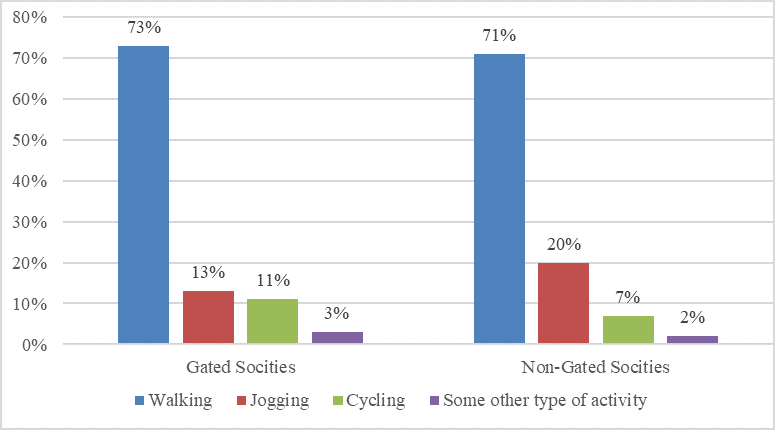
On the other hand, 37% of the respondents from non-gated communities stated that PAF was provided, 26% responded negatively, and 37% responded that these were provided to some extent. Hence, the responses determined that most of the residents of gated communities were engaged in different types of physical activities including walking, jogging, cycling, and some other type of activity. As far as the engagement of the residents of non-gated communities is concerned, most of them were doing walking, whilst other were doing jogging and cycling (Figure 3). These results suggested that whether the residents considered the provision of PAF as adequate or not, they were conscious about their health and remained engaged in physical activities using various means to maintain their physical fitness.
Figure 3
Engagement of Respondents in Physical Activities
Perception of Security
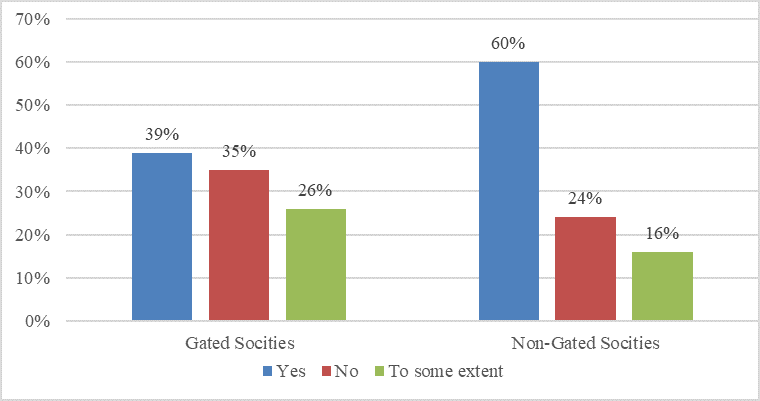
When asked about the perception of security/safety of their neighbourhood, only 39% of respondents from gated communities stated their neighbourhood was safe, 35% said that it was not safe, and 26% said that it was safe to some extent. Surprisingly, most of the respondents from non-gated communities stated that their neighbourhood was safe, 24% said it was not safe, and a small proportion of them said that it was safe to some extent (Figure 4). The relatively high level of the perception of safety among the residents of non-gated communities is because they have installed gates at both ends of their streets. This was also observed during field surveys/interviews with the residents.
Figure 4
Perception of Security/Safety within the Neighbourhood
To determine the relationship of SOC with various attributes of gated and non-gated communities, it was imperative to know the awareness level of the respondents, both about SOC and their respective neighbourhoods. The results revealed that nearly 45% of respondents from gated communities had already heard about SOC, 35% were not aware about it, and 20% thought that they might have heard about it. Similarly, 42% were of the view that SOC existed within their neighbourhood, although a majority (56%) said it was non-existing. A relatively smaller proportion (32%) of the respondents from non-gated communities were aware of SOC, whilst most of them (51%) were not aware at all. When asked if SOC existed in their neighbourhood, 33% responded positively, 60% responded negatively, and 7% responded that it might have existed. In addition, more than 70% of respondents said that they had never been involved in any decision-making regarding the matters related to their community/society.
A small proportion of the respondents (30%) from gated communities were of the view that their neighbourhood enjoyed high social interaction, 48% considered it as low, and 22% considered it as very low. In the case of non-gated communities, 29% of respondents were of the view that their neighbourhood enjoyed high social interaction, 54% considered it as low, and 17% considered it as very low. Hence, no significant difference was found in the extent of social interaction within both types of communities. The results also showed that 25% of respondents from gated communities used to meet or interact with their neighbours twice a week, 32% once a week, 30% fortnightly, and 13% only once a month. From non-gated communities, 19% interacted with their neighbours twice a week, 37% once a week, 31% fortnightly, and 13% only once a month. As far as the role of gated elements (boundary walls and gates) in reducing the opportunities for social interaction is concerned, most of the residents (56%) of gated communities were of the view that these were not responsible for social exclusion. Similarly, only 42% residents of non-gated communities believed that gated elements were responsible for social exclusion.
The respondents gave some good suggestions to increase social interaction within their communities. From Table 2, it is evident that the suggestions are diverse and the proportion of those giving each suggestion remains small. However, four suggestions given by 20% or more respondents may be given due consideration. These include holding more community events, open public meetings for area development, less commercialization, and provision of more public spaces.
Table 2
Suggestions to Increase Social Interaction
|
Sr. No. |
Suggestions |
Gated communities |
Non-gated communities |
|
|
Response Percentage |
||
|
1 |
More community events |
15 |
25 |
|
2 |
Open public meetings for area development |
20 |
17 |
|
3 |
Incorporate social media to highlight issues |
15 |
12 |
|
4 |
Less commercialization and more focus on area planning |
23 |
17 |
|
5 |
More public spaces |
17 |
20 |
|
6 |
More security |
10 |
9 |
|
|
Total |
100% |
100 |
This section presents the results of the four hypotheses developed to determine the relationships between the perception of security, extent of social interaction, neighbourhood satisfaction, and duration of stay in the neighbourhood with SOC among its residents.
Hypothesis 1. SOC is associated with the perception of security in the community.
Table 3 shows that observed values and expected values do not differ from each other, significantly. The calculated value of Chi Square is 3.200 for gated communities and 1.232 for non-gated communities (Table 4). Both the values are lower than the critical value, that is, 9.488 at 4 degrees of freedom and 0.05 level of significance. Thus, the hypothesis “SOC is associated with the perception of security in the community” is false or rejected in case of both gated and non-gated communities. Hence, the null hypothesis “SOC is not associated with the perception of security in the community” is accepted. It indicates that whether people feel safe or not, they may have a good SOC and vice versa. The results presented in Table 3 also demonstrate that most respondents were of the view that there is no relationship between SOC and the perception of security in both gated and non-gated communities. The value of asymptotic significance given in Table 4 depicts that the observed values do not differ significantly from the expected values. Thus, there is no possibility of type II error of wrongly accepting a null hypothesis when it is actually false (George & Mallery, 2019).
Table 3
Relationship between Perception of Security and SOC
|
|
|
|
Sense of Community (Gated) |
Total |
Sense of Community (Non-Gated) |
Total |
||||
|
|
|
|
Yes |
No |
May Be |
Yes |
No |
May Be |
||
|
Perception of Security |
Yes |
Count |
20 |
32 |
1 |
53 |
30 |
47 |
5 |
82 |
|
Expected Count |
22.4 |
29.4 |
1.2 |
53 |
27.5 |
49.1 |
5.4 |
82 |
||
|
No |
Count |
19 |
26 |
2 |
47 |
9 |
22 |
2 |
33 |
|
|
Expected Count |
19.8 |
26.1 |
1 |
47 |
11.1 |
19.8 |
2.2 |
33 |
||
|
To some extent |
Count |
18 |
17 |
0 |
35 |
7 |
13 |
2 |
22 |
|
|
Expected Count |
14.8 |
19.4 |
0.8 |
35 |
7.4 |
13.2 |
1.4 |
22 |
||
Table 4
Chi-Square Test Results for the Relationship between Perception of Security and SOC
|
|
Gated Communities |
Non-Gated Communities |
||||
|
|
Value |
df |
Asymptotic Significance (2-sided) |
Value |
df |
Asymptotic Significance (2-sided) |
|
Pearson Chi-Square |
3.200a |
4 |
0.525 |
1.232a |
4 |
0.873 |
|
Likelihood Ratio |
3.764 |
4 |
0.439 |
1.223 |
4 |
0.874 |
|
Linear-by-Linear Association |
1.567 |
1 |
0.211 |
0.56 |
1 |
0.454 |
|
No. of Valid Cases |
135 |
|
|
137 |
|
|
Hypothesis 2. SOC is associated with the extent of social interaction in the community.
Table 5 shows that the observed values of the relationship between the extent of social interaction and SOC significantly differ from the expected values. The calculated value of Chi Square is 48.814 for gated communities and 20.257 for non-gated communities and the significance value is < .001 (Table 6). Both the values are much higher than the critical value, that is, 9.488 at 4 degrees of freedom and 0.05 level of significance. Thus, the hypothesis “SOC is associated with the extent of social interaction in the community” is accepted. Indeed, SOC is strongly associated with the extent of social interaction in both gated and non-gated communities. This result is also supported by the responses presented in Table 5, since a majority stated that a high extent of social interaction is associated with SOC and vice versa. Studies in other developing countries including India and China also suggest that social interaction is positively correlated with residential satisfaction and SOC (Jacob & Chander, 2020; Li et al., 2021).
Table 5
Relationship between Extent of Social Interaction and SOC
|
|
|
|
Sense of Community (Gated) |
Total |
Sense of Community (Non-Gated) |
Total |
||||
|
|
|
|
Yes |
No |
May Be |
Yes |
No |
May Be |
||
|
Extent of Social Interaction |
High |
Count |
35 |
6 |
0 |
41 |
24 |
14 |
2 |
40 |
|
|
Expected Count |
17.3 |
22.8 |
0.9 |
41 |
13.4 |
23.9 |
2.6 |
40 |
|
|
Low |
Count |
18 |
45 |
1 |
64 |
19 |
50 |
4 |
73 |
|
|
|
Expected Count |
27 |
35.6 |
1.4 |
64 |
24.5 |
43.7 |
4.8 |
73 |
|
|
Very low |
Count |
4 |
24 |
2 |
30 |
3 |
18 |
3 |
24 |
|
|
|
Expected Count |
12.7 |
16.7 |
0.7 |
30 |
8.1 |
14.4 |
1.6 |
24 |
|
Table 6
Chi-Square Test Results for the Relationship between the Extent of Social Interaction and SOC
|
|
Gated Communities |
Non-Gated Communities |
||||
|
|
Value |
df |
Asymptotic Significance (2-sided) |
Value |
df |
Asymptotic Significance (2-sided) |
|
Pearson Chi-Square |
48.814a |
4 |
0.000 |
20.257a |
4 |
0.000 |
|
Likelihood Ratio |
51.818 |
4 |
0.000 |
20.155 |
4 |
0.000 |
|
Linear-by-Linear Association |
40.716 |
1 |
0.000 |
15.2 |
1 |
0.000 |
|
No. of Valid Cases |
135 |
|
|
137 |
|
|
Hypothesis 3. Neighbourhood satisfaction is associated with the extent of social interaction in the community.
Table 7 shows that the observed values of the relationship between neighbourhood satisfaction and SOC significantly differ from the expected values. The calculated value of Chi Square for gated communities is 11.192 (Table 8). This value is higher than the critical value, that is, 9.488 at 4 degrees of freedom and 0.05 level of significance. Thus, the hypothesis “neighbourhood satisfaction is associated with the extent of social interaction in the community” is accepted. It indicates that in the case of gated communities, the residents who indulge into more social interaction are more satisfied with their neighbourhood. However, some variation can also be observed in Table 6, for instance, 36 respondents have low social interaction but still remain satisfied with their neighbourhood. Similarly, a considerable number of respondents either have low or very low social interaction but remain satisfied with their neighbourhood to some extent. These variations in the results suggest that the degree of social interaction may not be the only reason of satisfaction with the neighbourhood. A study of the gated and non-gated communities in USA suggests that the age of respondents and the lack of awareness of crime have an impact on neighbourhood satisfaction (Chapman & Lombard, 2006). Hence, further research is needed in the context of a developing country to identify those factors, which may lead to satisfaction with the neighbourhood despite low social interaction among its residents.
Table 7
Relationship between Neighbourhood Satisfaction and Extent of Social Interaction
|
|
|
|
Gated |
Total |
Non-Gated |
Total |
||||
|
|
|
|
High |
Low |
Very low |
High |
Low |
Very low |
||
|
Neighbourhood Satisfaction |
Yes |
Count |
18 |
36 |
9 |
63 |
28 |
58 |
16 |
102 |
|
Expected Count |
19.1 |
29.9 |
14 |
63 |
29.8 |
54.4 |
17.9 |
102 |
||
|
No |
Count |
10 |
8 |
3 |
21 |
2 |
5 |
0 |
7 |
|
|
Expected Count |
6.4 |
10 |
4.7 |
21 |
2 |
3.7 |
1.2 |
7 |
||
|
To some extent |
Count |
13 |
20 |
18 |
51 |
10 |
10 |
8 |
28 |
|
|
Expected Count |
15.5 |
24.2 |
11.3 |
51 |
8.2 |
14.9 |
4.9 |
28 |
||
Table 8
Chi-Square Test Results for the Relationship between Neighbourhood Satisfaction and Extent of Social Interaction
|
|
Gated Communities |
Non-Gated Communities |
|
||||
|
|
Value |
df |
Asymptotic Significance (2-sided) |
Value |
df |
Asymptotic Significance (2-sided) |
|
|
Pearson Chi-Square |
11.192a |
4 |
0.024 |
6.189a |
4 |
0.185 |
|
|
Likelihood Ratio |
10.654 |
4 |
0.031 |
7.249 |
4 |
0.123 |
|
|
Linear-by-Linear Association |
2.87 |
1 |
0.09 |
0.045 |
1 |
0.832 |
|
|
No. of Valid Cases |
135 |
|
|
137 |
|
|
|
However, in case of non-gated communities, this hypothesis is rejected because the observed values and expected values do not differ significantly. The calculated value of Chi Square is 6.189 (Table 8). This value is lower than the critical value, that is, 9.488 at 4 degrees of freedom and 0.05 level of significance. It indicates that in case of non-gated communities, the association between the intensity of social interaction and neighbourhood satisfaction is insignificant. Hence, the residents who remain unsatisfied with their neighbourhood (due to other reasons) may still enjoy social interaction within their community and vice versa.
Hypothesis 4. SOC is associated with the duration of stay in the community.
Table 9 shows that the observed values for the relationship between the duration of stay in the community and SOC do not differ significantly from the expected values. The calculated values of Chi Square are 4.143 for gated communities and 3.444 for non-gated communities, respectively (Table 10). Both of these values are much lower than the critical value, that is, 9.488 at 4 degrees of freedom and 0.05 level of significance. Thus, the hypothesis “SOC is associated with the duration of stay in the community” is rejected. The main reason is that the case study areas fully developed only during the last decade, which is not a very long time, so most of the respondents have been residing there for less than 5 years. This might be the factor behind the absence of any relationship between SOC and residence duration in these areas. This is an unusual finding since it is normally assumed that SOC increases with the prolonged duration of residence in a particular community (Mousavinia et al., 2019; Li et al., 2021).
Table 9
Relationship between Duration of Stay and SOC
|
|
|
|
Sense of Community (Gated) |
Total |
Sense of Community (Non-Gated) |
Total |
||||
|
|
|
|
Yes |
No |
May Be |
Yes |
No |
May Be |
||
|
Duration of Stay in the Town |
More than 5 years |
Count |
16 |
27 |
1 |
44 |
22 |
31 |
3 |
56 |
|
Expected Count |
18.6 |
24.4 |
1 |
44 |
18.8 |
33.5 |
3.7 |
56 |
||
|
More than 10 years |
Count |
29 |
36 |
2 |
67 |
17 |
37 |
4 |
58 |
|
|
Expected Count |
28.3 |
37.2 |
1.5 |
67 |
19.5 |
34.7 |
3.8 |
58 |
||
|
More than 20 years |
Count |
10 |
12 |
0 |
22 |
5 |
12 |
1 |
18 |
|
|
Expected Count |
9.3 |
12.2 |
0.5 |
22 |
6 |
10.8 |
1.2 |
18 |
||
|
More than 30 years |
Count |
2 |
0 |
0 |
2 |
2 |
2 |
1 |
5 |
|
|
Expected Count |
0.8 |
1.1 |
0 |
2 |
1.7 |
3 |
0.3 |
5 |
||
Table 10
Chi-Square Test Results for the Relationship between Duration of Stay and SOC
|
|
Gated Communities |
Non-Gated Communities |
||||
|
|
Value |
df |
Asymptotic Significance (2-sided) |
Value |
df |
Asymptotic Significance (2-sided) |
|
Pearson Chi-Square |
4.143a |
6 |
0.657 |
3.444a |
6 |
0.751 |
|
Likelihood Ratio |
5.335 |
6 |
0.502 |
2.999 |
6 |
0.809 |
|
Linear-by-Linear Association |
1.873 |
1 |
0.171 |
1.012 |
1 |
0.314 |
|
N of Valid Cases |
135 |
|
|
137 |
|
|
The number of gated communities is rapidly growing in both developed and developing countries and Pakistan is no exception. Primarily, these communities were designed and developed to provide a safe and secure living environment. Although gated communities have succeeded to some extent in achieving their original objective, yet social exclusion and a decreasing Sense of Community (SOC) among their residents is a growing concern. This research attempted to identify the underlying factors that promote social interaction and hence SOC in both gated and non-gated communities. Based on the analysis of data generated through interviews with the residents of selected gated and non-gated communities of Lahore and testing of various hypotheses, the following conclusions were drawn:
To increase social interaction and SOC, it is very important to provide more physical activity facilities (such as for walking, jogging, cycling, indoor/outdoor games) and develop more community centres and improve the existing ones. Hence, people can have more frequent visits and may avail the opportunity to socially interact with their fellow residents. Pedestrian friendly streetscape and street furniture must be designed to enhance and encourage street interaction.
Adhikari, G. P. (2021). Calculating the sample size in quantitative studies. Scholar's Journal, 4(1), 14–29. https://doi.org/10.3126/scholars.v4i1.42458
Bandauko, E., Kutor, S. K., Nyantakyi-Frimpong, H., Baiden, P., & Arku, G. (2023). Influence of socio-demographic factors and housing characteristics on satisfaction with privacy in gated communities in Accra (Ghana).Housing Studies,38(10), 1781–1802. https://doi.org/10.1080/02673037.2022.2077920
Bint-e-Waheed, H., & Nadeem, O. (2020). Perception of security risk in gated and non-gated communities in Lahore, Pakistan.Journal of Housing and The Built Environment,35(3), 897–915. https://doi.org/10.1007/s10901-019-09719-2
Boonjubun, C. (2019). Also the urban poor live in gated communities: A Bangkok case study.Social Sciences,8(7), Article e219. https://doi.org/10.3390/socsci8070219
Chapman, D. W., & Lombard, J. R. (2006). Determinants of neighborhood satisfaction in fee-based gated and nongated communities. Urban Affairs Review, 41(6), 769–799. https://doi.org/10.1177/1078087406287164
Ewing, R., & Park, K. (Eds.). (2020). Basic quantitative research methods for urban planners. Routledge.
Farahani, L. M., & Lozanovska, M. (2014). A framework for exploring the sense of community and social life in residential environments. Archnet-IJAR, International Journal of Architectural Research, 8(3), 223–237. https://hdl.handle.net/10536/DRO/DU:30069682
Francis, J., Giles-Corti, B., Wood, L., & Knuiman, M. (2012). Creating sense of community: The role of public space. Journal of Environmental Psychology, 32(4), 401–409. https://doi.org/10.1016/j.jenvp.2012.07.002
George, D., & Mallery, P. (2019). IBM SPSS statistics 26 step by step: A simple guide and reference. Routledge.
Gul, Y., Sultan, Z., & Jokhio, G. A. (2018). The association between the perception of crime and walking in gated and non-gated neighbourhoods of Asian developing countries. Heliyon, 4(8), Article e00715. https://doi.org/10.1016/j.heliyon.2018.e00715
Jacob, P., & Chander, D. S. (2020). Impact of social interaction on residential satisfaction in gated communities in an Indian context. International Journal of Advanced Research in Engineering and Technology, 11(2), 48–56.
Kim, S. K. (2006).The gated community: Residents' crime experience and perception of safety behind gates and fences in the urban area[Doctoral dissertation, Texas A&M University]. Texas A&M University Libraries. https://hdl.handle.net/1969.1/4130
Li, X., Li, Z., Jia, T., Yan, P., Wang, D., & Liu, G. (2021). The sense of community revisited in Hankow, China: Combining the impacts of perceptual factors and built environment attributes. Cities, 111, Article e103108. https://doi.org/10.1016/j.cities.2021.103108
Link, F., Señoret, A., & Valenzuela, F. (2022). From community to public familiarity: Neighborhood, sociability, and belonging in the neoliberal city. Urban Affairs Review, 58(4), 960–995. https://doi.org/10.1177/10780874211021512
Lu, T., Zhang, F., & Wu, F. (2018). Place attachment in gated neighbourhoods in China: Evidence from Wenzhou. Geoforum, 92, 144–151. https://doi.org/10.1016/j.geoforum.2018.04.017
Manzi, T., & Smith, B. (2005). Gated communities as club goods: Segregation or social cohesion? Housing Studies, 20(2), 345–359. https://doi.org/10.1080/0267303042000331817
McMillan, D. W., & Chavis, D. M. (1986). Sense of community: A definition and theory. Journal of Community Psychology, 14(1), 6–23. https://doi.org/10.1002/1520-6629(198601)14:1%3C6::AID-JCOP2290140103%3E3.0.CO;2-I
Mousavinia, S. F. (2022). How residential density relates to social interactions? Similarities and differences of moderated mediation models in gated and non-gated communities. Land Use Policy, 120, Article e106303. https://doi.org/10.1016/j.landusepol.2022.106303
Mousavinia, S. F., Pourdeihimi, S., & Madani, R. (2019). Housing layout, perceived density and social interactions in gated communities: Mediational role of territoriality. Sustainable Cities and Society, 51, Article e101699. https://doi.org/10.1016/j.scs.2019.101699
Moustafa, Y. M. (2009). Design and neighborhood sense of community: An integrative and cross-culturally valid theoretical framework. Archnet-IJAR, International Journal of Architectural Research, 3(1), 71–91.
Rafiemanzelat, R. (2016). Gated communities and sense of community: A review on the social features of gated communities. International Journal of Electronics and Communication Engineering, 10(5), 671–676.
Rahmaan, A., & Anis, B. (2009). Dynamics of gated communities, their impact and challenges for sustainable development: A case study of Lahore, Pakistan. International Journal of Architectural Research, 3, 57–70.