Aalia Nazir1*, Hafeez Ullah1, Ghulam Gilanie1, Shabbir Ahmad1, Zahida Batool1, and Asghar Gadhi2
1 Institute of Physics, The Islamia University of Bahawalpur, Pakistan
2Bahawalpur Institute of Nuclear Medicine, Bahawalpur, Pakistan
* Corresponding Author: [email protected]
Breast cancer is a significant health problem for women globally; however, timely detection can reduce female morbidity and mortality. Early breast screening has become imperative for all women, though, adequate screening facilities are necessarily required in developing countries like Pakistan, where breast cancer is a leading cause of death. To encounter this chronic disease, various image processing techniques have been introduced to automatically diagnose breast cancer from digital mammograms. The current study deployed data from a population of 35 participants. The mammograms used for screening were 5 normal, 15 benign, and 15 malignant patients. The breast images were marked by the radiologist and the system was trained with normal, benign, and malignant classes. Moreover, Multilayer Neural Networks (MNN) based texture analysis methodology was adopted to distinguish normal, benign, and malignant breast images. Reportedly, an automated approach was used to detect breast conditions after conducting the analysis of digital mammograms. Statistical parameters, namely sum, mean, variance, standard deviation, kurtosis, skewness, energy, and entropy were calculated, analyzed, and compared for the normal, malignant, and benign breast images. The results indicated a 100% accuracy after the analysis. The results of the extracted statistical parameters were promising and reliable in distinguishing between normal, malignant, and benign breast mammograms, again indicating the need for early detection of the disease to minimize the risk of breast cancer among women.
Keywords: breast cancer, benign and malignant cancer, mammography, MNN, neural network
Breast cancer is one of the most common cancers among women, which affects women's physical and mental health and is even life-threatening globally. The overall frequency is increasing, and the risk factors are well-documented [1].
There are several features, which are responsible for this disease like obesity, radiation exposure, family history, fat-enriched food, and pre-malignant injuries. Breast cancer once detected can become worse with a change in lifestyle [2,3]. Breast cancer is the second major cause of mortality worldwide and in Pakistan every 1 woman out of 9 is suffering from this chronic disease. This can be due to the lack of medical facilities and unawareness, which are major causes of delayed diagnosis [4,5]. It has been a challenging task to detect breast cancer at an earlier stage to lower the mortality rate. The risk of breast cancer among women aged less than 40 years is smaller, whereas an increased rate has been noticed in women between 45-55 years, resultantly causing an increase in mortality rate [6]. Mammography is an affordable, low-radiation test recommended for early detection of breast cancer [7,8]. This test can be performed on both pre-symptomatic and symptomatic women; however, it is less efficient for women who are lower than 40 due to dense breasts [9]. Though, women at later stages can feel a lump, a hard loop within the breast or under the arm, swelling, changes in the mass of the breast, redness, and dimpling or creasing of skin. Countries with low-income and underdevelopment, such as Pakistan, face a scarcity of resources for essential diagnosis or detection. Delays in medical care may contribute to the spread of breast cancers morbidity and mortality [10]. Michell et al. Identified that the addition of digital breast tomosynthesis (DBT) in conventional mammography increases the accuracy rate in cancer assessment [11].
The human nervous system is a compound neural system and our body collects external signals through dendrites. These signals are collected till a threshold level to make an action. A large number of neurons are interrelated to study input and optimize its output by means of computing and processing. Artificial Neural Network (ANN) is used in training a learned system by processing these signals in medical imaging so, that decisions can be automated. Computer-aided Detection Systems (CAD) trained using machine learning models, help radiologists, medical practitioners, radiation oncologists or physicians in the accurate and more definite detection of breast cancer in the early stage [12]. CAD systems have been used in many medical institutes for clinical diagnosis as referred by doctors [13]. For the feature extraction process, curvelet moments are also very beneficial in giving reduced features and enhancing accuracy in the diagnosis of breast cancer [14]. An automated feature extraction process is utilized in diagnosing architecture distortion in the breast, which causes malignancy by applying texture models and vector machine classifiers on the region of interest [15]. A multivariate feature can also be used for extraction by applying a genetic algorithm and obtaining feature descriptive in two categories, which classify malignant and benign breasts and reduces the workload of radiologists [16]. Furthermore, the grey level co-occurrence matrix is used for feature extraction in different orientations to differentiate masses and non-masses, by combing the grey level with the wavelet approach through which the results are enhanced [17]. ANN-PSO (artificial neural network with particle swarm optimization) method has been used by Zhang et al to extract the intensity and shape features, which tested and then distinguished normal and abnormal breast mammograms [18]. The particle swarm optimized wavelet neural network (PSOWNN) technique was applied to breast mammograms by Sathyaa et al and the Receiver Operating Characteristic (ROC) curve indicated the sensitivity and specificity as indicated by Dheeba et al. [19] 20].
From the analysis of texture, an automated method was proposed to classify different breast tissues as normal, malignant, or benign. This method provided the radiographic details of breast lesions.
Breast tumors can be benign or malignant. Benign is not dangerous, it can grow but doesnt spread in surroundings. However, malignant is cancerous and can spread in the entire body and cause destruction [21,22. Therefore, in this study, an automated approach has been proposed to classify breast cancer as normal, benign, or malignant. This work explored ways to prevent this disease and provide a new taxonomy for breast cancer risk assessment.
A dataset of mammograms, correspondingly collected from 35 subjects was obtained from the Bahawal Victoria Hospital. The women who were considered for scanning ranged from age 45-55 years having either normal, benign, or malignant breast cancer stage. All patients were duly informed and the ethics review board signed for further process. Medial-lateral oblique and craniocaudal images were acquired and statistical mammographic data were analyzed. The following steps were taken to successfully classify breast conditions including normal, benign or malignant.
i. The mammograms having high intensity and contrasts were input to the developed system. The developed system consisted of an architecture based upon 12-layered multi-layered neural networks (MNN).
ii. Segmentation of Region of Interest (ROI), which had a suspicious area with distinguished surroundings was marked by the domain experts.
iii. Texture features, namely, sum, mean, variance, standard deviation, kurtosis, skewness, energy, and entropy extracted from each of the segmented ROIs belonging to normal, benign, and malignant stages.
iv. Training of the system using these extracted texture features through MNN using Matlab2020a was conducted on 70% of the total data.
v. Evaluation of the proposed developed system was based on the standard evaluation measurement, such as accuracy.
In this research, statistical methods were used to extract texture features. Using image classification and segmentation methods was a more reliable approach, which ensured higher reliability in the obtained results. The feature extraction method underlying the statistical procedure consisted of the sum of the following parameters, namely mean (pixel value), variance (square root of deviation), energy (uniformity), standard deviation (pixel deviation from the mean), skewness (pixel asymmetry), kurtosis (flatness or peak), and entropy (random measurements). Normal, malignant, and benign breast mammograms and their bilateral statistical data were analyzed. There are usually two models for image projection, namely Craniocaudal (CC), a view from the apex, which allows for enhanced imaging of the central and internal breast regions, and Mediolateral Oblique (MLO) that provides an improved view of the gland from a specific side view.
|
(a) |
(b) |
(c) |
(d) |
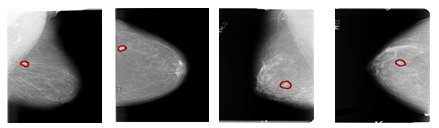
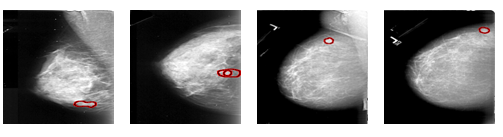
Figure 1. (a) Case 1 (L-MLO), (b) Case 2 (R-CC), (c) Case 35 (R-MLO), and (d) Case 35 (R-CC)
|
(a) |
(b) |
(c) |
(d) |
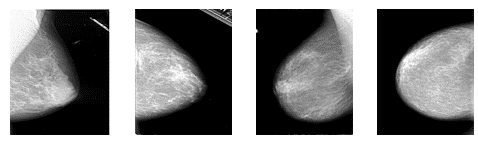
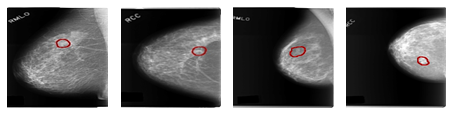
Figure 2. (a) Case 7 (R-MLO), (b) Case 7 (L-CC), (c) Case 19 (L-MLO), and (d) Case 19 (R-CC)
|
(a) |
(b) |
(c) |
(d) |
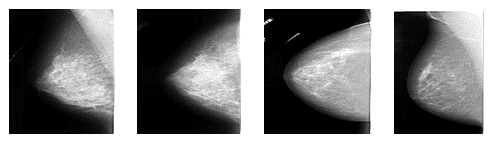
Figure 3. (a) Case 1 (L-MLO), (b) Case 1 (L-CC), (c) Case 2 (L-MLO), and (d) Case 2 (L-CC)
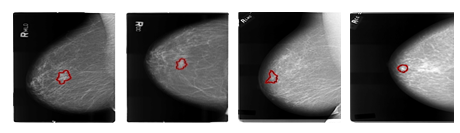
Figure 3 contains randomly selected left mammograms from two different subjects. The regions highlighted in these MLO and CC images are malignant breast lesions. Benign areas are brighter due to their higher intensity. Figure 4, shows right mammograms of two cases containing malignant areas in MLO and CC image projections. In Figure 4, Case 3 R (MLO and CC) shows abnormalities, lesion-like masses, foci, asymmetric dense margins, and unclear partially malignant pathology (a, b). Case 4 R (MLO and CC) showed abnormalities, with lesion-like mass morphology and suspiciously malignant irregular margins in parts (c, d). The selected area is the tumor-containing lesion.
|
(a) |
(b) |
(c) |
(d) |
Figure 4 (a) Case 3 (R-MLO), (b) Case 3 (R-CC), (c) Case 4 (R-MLO), and (d) Case 4 (R-CC)
|
(a) |
(b) |
(c) |
(d) |
Figure 5. (a) Case 1 (L-MLO), (b) Case 1 (L-CC), (c) Case 2 (L-MLO), and (d) Case 2 (L-CC)
|
(a) |
(b) |
(c) |
(d) |
Figure 6. (a) Case 3 (R-MLO), (b) Case 3 (R-CC), (c) Case 4 (R-MLO), and (d) Case 4 (R-CC).
Mammograms of the left breast for case 1 and case 2 are shown in Figure 5, with the mediolateral and craniocaudally view with affected highlighted areas. This study has dealt with images of benign breasts having calcification, pleomorphic distribution, and architectural distortions as shown in Figure 6. Case 3 R (MLO) is abnormal. Lesion-type classification, pleomorphic distribution, and clustered benign mammogram are shown in Figure 6 (a). Case 3 R (CC) is abnormal lesion-type calcification, pleomorphic distribution clustered, and architectural distortion margins speculated benign as shown in Figure 6 (b). Case 4 R (MLO and CC) shows abnormality lesion-type mass and shape round margins obscured benign as shown in Figure 6 (c, d). Red enclosed areas in the normal and benign breasts are the regions of interest, which are segmented and processed for statistical feature extraction of mammograms.
Texture parameters extracted from normal ROIs of the selected 35 patients age ranging from 45-55 are shown in Table I. Texture analysis was performed on 35 women with bilaterally normal breasts. Data from allthepatients were collected and summarized below, showing medial-lateral oblique and craniocaudal views.
Table 1. Statistical Parameters in Mediolateral Oblique and Craniocaudal view of Normal Right and Left Breast
|
Statistical Parameters |
Normal (MLO) (Average values) |
Normal (CC) (Average values) |
||
|
Right Breast |
Left Breast |
Right Breast |
Left Breast |
|
|
Sum |
53.0 |
50.00 |
43.0 |
42.00 |
|
Mean |
81.3 |
81.67647 |
66.4 |
65.470588 |
|
Variance |
68.0 |
6768.161 |
63.0 |
6470.7764 |
|
Standard deviation |
82.0 |
82.04567 |
79.0 |
80.050905 |
|
Skewness |
0.49 |
0.455200 |
0.86 |
0.8279944 |
|
Kurtosis |
-1.20 |
-1.272985 |
-0.60 |
-0.7750828 |
|
Entropy |
26.0 |
2651414 |
21.0 |
21112641.1 |
|
Flatness |
0.46 |
0.475726 |
0.52 |
0.53155200 |
|
Energy |
3.2 E-05 |
3.268E-05 |
4.0 E-05 |
4.16294E-05 |
Table 1 provides textural parameters, such as, sum, mean, variance, standard deviation, skewness, kurtosis, entropy, flatness, and energy, along with maximum, minimum, and mean ranges for all normal mammograms.
The statistical characteristics ofall thepatients with malignancies were determined and presented in Table 2.
Table 2. Numerical Analysis of Right and Left Malignant Breast in MLO and CC view
|
Statistical Parameters |
Malignant (MLO) (Average values) |
Malignant (CC) (Average values) |
||
|
Right Breast |
Left Breast |
Right Breast |
Left Breast |
|
|
Sum |
5754958.9 |
5665979.1 |
4779375.86 |
4332792.4 |
|
Mean |
78.371429 |
77.400000 |
62.6571429 |
59.828571 |
|
Variance |
6171.9399 |
6381.0684 |
5749.74924 |
5489.5443 |
|
Standard deviation |
78.195735 |
79.510718 |
75.2393183 |
73.539115 |
|
Skewness |
0.5173302 |
0.5314520 |
0.89566069 |
0.9520324 |
|
Kurtosis |
-1.0368810 |
-1.0458932 |
-0.48604212 |
-0.2584942 |
|
Entropy |
30025540 |
28286342 |
23421773.6 |
21287130 |
|
Flatness |
0.4867556 |
0.4924317 |
0.55017747 |
0.5496571 |
|
Energy |
2.727E-05 |
2.9818E-05 |
3.49926E-05 |
3.8034E-05 |
Table 3 summarizes the texture parameters of the image window pixels, including the maximum, minimum, and mean values of the left and right benign breasts, with promising results. Reportedly, maximum and minimum values are now equal to absolute values.
Table 3. Pixel Parameters of Right and Left Benign Breast Images
|
Statistical Parameters |
Benign (MLO) (Average values) |
Benign (CC) (Average values) |
||
|
Right Breast |
Left Breast |
Right Breast |
Left Breast |
|
|
Sum |
5798909.86 |
5172456 |
4832506.3 |
5066756.51 |
|
Mean |
73.2285714 |
66.485714 |
62.200000 |
65.2857143 |
|
Variance |
5685.44068 |
5397.0492 |
5488.9733 |
5285.80702 |
|
Standard deviation |
74.9817381 |
73.053862 |
73.571646 |
72.37847995 |
|
Skewness |
0.68503344 |
0.7359084 |
0.9761847 |
0.80500920 |
|
Kurtosis |
-0.7213016 |
-0.604295 |
-0.1948880 |
-0.41404877 |
|
Entropy |
28338321.9 |
25325634 |
214942223 |
24647141.59 |
|
Flatness |
0.51946173 |
0.5318824 |
0.5694440 |
0.536184773 |
|
Energy |
2.727E-05 |
2.9818E-05 |
3.49926E-05 |
3.8034E-05 |
The results for the left and right benign breasts are shown in Table 3. To obtain reliable results and conclusions about the texture parameters of all normal, malignant, and benign breast images, comparisons were made numerically, to classify the results of normal and benign breast data by using MNN. The proposed approach was analyzed and found to be a reliable approach for the assessment. Digital data from previous mammograms of benign and healthy breasts were used for differentiation. Texture parameters are compared in Table 4 for maximum and minimum values for both of the selected cases.
Table 4. Comparison of Right MLO view Texture Parameters of Normal and Benign Breast Mammograms
|
Statistical Parameters |
Right normal (MLO) (Average Values) |
Right benign (MLO) (Average values) |
% Differences |
|
Sum |
5383731.714 |
5798909.86 |
-7.1595896 |
|
Mean |
81.34285714 |
73.2285714 |
11.0807648 |
|
Variance |
6807.459804 |
5685.44068 |
19.7349544 |
|
Standard deviation |
82.28868257 |
74.9817381 |
9.74496545 |
|
Skewness |
0.491937579 |
0.68503344 |
-28.187801 |
|
Kurtosis |
-1.20984084 |
-0.7213016 |
67.730231 |
|
Entropy |
26957357.8 |
28338321.9 |
-4.8731329 |
|
Flatness |
0.468915193 |
0.51946173 |
-9.730559 |
|
Energy |
3.23365E-05 |
2.75458E-05 |
17.3917621 |
Normal, benign, and malignant mammograms were analyzed and the extracted textural features were presented in medial-lateral and craniocaudal (CC) views. Subtle and obscure areas are enhanced using algorithms to make areas of interest easier to see and texture extraction methods are more useful in these areas.In this research, mammograms were used to train and test the proposed model to automatically classify normal, benign, and malignant breast images based on their texture. Each mammogram contains 20 slices of both views (MLO and CC) along the left and right breast. Therefore, 35 × 2 × 20 × 2 slices were used for training and testing the reported system. Of these total 2800 slices, 1848 slices were used for training the reported system and the remaining 952 slices were used for testing the reported system. Reportedly, two clues to malignant tumors are identified, namely microcalcifications and masses. These texture features were used to train the proposed method using MNNs and then compared to the literature [23,24], both types yielded up to 90% of accuracy in discriminating benign or malignant abnormalities.
The statistical analysis examined each category's sum, mean, variance, entropy, skewness, and other pixel features of left and right breasts. Variations in these parameters, such as maximum, minimum, and mean values, were used to classify normal and benign tumor, including breast and the areas of microcalcification. In this work, MLO-mapped parameters of mammograms of healthy and malignant breasts were used in which clear differences in all values were noticed.
Differences between all parameters and maximum, minimum, and mean values demonstrated the intelligent classification of normal and benign breasts. This studys results were promising for various statistical approaches to describe and analyze image textures. By analyzing the variance of all outcomes, it was concluded that a distinction is required between the normal and benign cases with 100% accuracy. Different values are also agreed upon for normal and abnormal benign images. The observed variance for normal cases ranges from 8831.9-3896.8 and all findings for abnormal benign cases are above the maximum for normal images. Therefore, the variance parameter gave 100% results from benign to normal images. Furthermore, it was observed that normal and abnormal benign cases could achieve different ranges of kurtosis 88% of the time, with 89% of perfect results.For the rest of the parameters, a clear result was also noticed. This demonstrated good results obtained in a large number of breast cancer cases and benign cases. These were further compared on various parameters of normal, benign, and malignant breasts by plotting kurtosis, energy, flatness and distortion on the x-axis and their intensity on the y-axis. Data were obtained from random patients and parameters were plotted with intensity. The variation in values of normal, malignant, and benign breast mammograms can be clearly observed graphically.
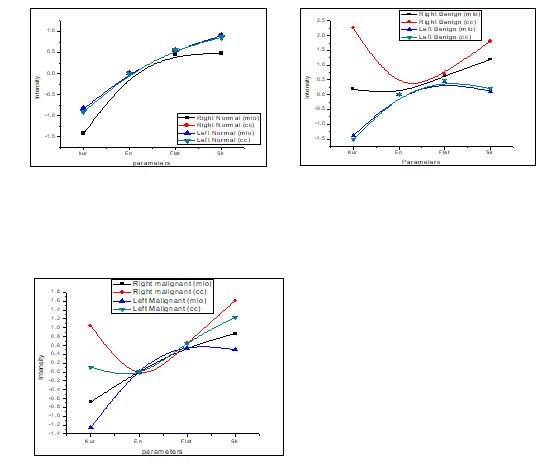
Figure 7. (a) The normal breast parameters of right and left mammogram in MLO and CC view, (b) Parameters of benign breast images along with intensities, and (c) Malignant breast mammogram parameters along with intensities.
Figure 7(a) shows the changes in kurtosis, energy, flatness, and skewness of left and right mammograms of a normal breast in craniocaudal and medial-lateral views. The parameters compared with the benign mammography parameters are shown in Fig. 7(b). In Fig. 7(b), the hyperintensities of the right benign image in CC view and MLO show the variation of values in normal parameters. The kurtosis parameter has a high intensity, which decreased at the energy point and increased again with flatness and strain but increase in the value at cc and then decreases gradually. Comparing these two charts with the malignant breast image, the deviations from normal values are larger than the benign image parameters, as shown in Fig. 7(c).Intensity fluctuations in right malignant CC views are rather instantaneous and different from benign and normal breast parameters. The left malignant tumor (MLO, CC) and right malignant MLO also showed strange curves, which were different from the normal breast curve. This artificial texture analysis approach would play an important role in the future. Furthermore, the research aims to test these methods with other classifiers or segmentation schemes and in more realistic texture interpretation situations.These results showed that there is considerable performance variability between different texturing methods. These results are supported by previous comparative studies in this field. Hence, the feature extraction results may assist radiologists in the early screening of breast mammograms and discrimination between healthy and unhealthy breasts by analyzing the numerical data.
The current study, aimed to propose a multi-layered neural network (MNN) approach to demonstrate the potential to distinguish between healthy, benign, and malignant breast mammograms in breast region analysis and segmentation. Texture analysis and comparison parameters of statistical data such as mammogram sum, variance, mean, kurtosis, standard deviation, skewness, energy, entropy, and flatness were used to obtain the results. It was obvious from the results that this feature extraction modality was reliable for diagnosing cancerous or malignant breasts. Therefore, it was recommended that early detection could increase the survival rates among women possessing breast cancer. Moreover, screening tests are mandatory for all women, especially in developing countries like Pakistan, where cancer mortality is relatively higher than in other developed countries.