

| Review | Open Access |
|---|
Groundwater Quality Dynamics in a Low-Mineralized Aquifer in Southern Nigeria: Integrating Physicochemical, Correlation, and Cluster Analyses |
 |
|---|
 Peter Bassey* , Asine Osedebamen, Ayamezimi Oziofu Ehinlaiye, and Kennedy Odu Ojo,
University of Benin, Nigeria
Groundwater of Benin, Southern Nigeria was analyzed to evaluate the water quality and suitability for drinking. Fifteen random groundwater samples were collected. The results were compared with the international standards / guidelines / thresholds. Importantly, lower pH (i.e., 4.75) indicating acidic conditions, well below the acceptable range (i.e., pH 6.5–8.5). More critically, the concentrations of Fe2+ (mean 0.57 mg/L) and Zn2+ (mean 0.17 mg/L) exceeded the World Health Organization (WHO) permissible limits (i.e., Fe2+ 0.3 mg/L and Zn2+ 0.01 mg/L). Conversely, electrical conductivity (12.42 µS/cm), total dissolved solids (5.75 mg/L), chloride (13.91 mg/L), and nitrate (1.85 mg/L) were all found within the safe WHO thresholds. Cd and Pb were below the detection limits. Statistical analyses revealed significant correlations, i.e., between electrical conductivity and turbidity (r = 0.855), and total suspended solids with carbonate (r = 0.933) and nitrate (r = 0.817). Distinct groupings of parameters, as indicated in cluster analysis, suggested common geogenic and anthropogenic influences. The study may conclude that the groundwater of the study-area is not suitable for direct human consumption. Prior treatment for elevated acidity and critical contamination from Fe2+ and Zn2+ are necessary. Immediate remediation efforts are, therefore, required to safeguard public health in the study area.
Highlights
- Groundwater from the low-mineralized aquifer in southern Nigeria is strongly acidic (with mean pH 4.75) and majorly contaminated with iron, zinc and manganese exceeding WHO permissible limits.
- Despite low electrical conductivity, TDS and major ion contents, multivariate statistics (correlation and cluster analyses) reveal tightly linked geochemical groupings that point to combined geogenic and anthropogenic controls on groundwater chemistry.
- The integrated physicochemical and statistical assessment provides a critical baseline for the study area. This may highlight the urgent need for targeted remediation, pH correction, and continuous monitoring to protect public health and ensure sustainable groundwater use.
1. INTRODUCTION
Water is the most important natural resource and is fundamental to sustainability of all forms of life [1]. Despite covering over 70% of the Earth's surface, freshwater resources accessible for human use are remarkably scarce. Groundwater constitute over 97% of the world's unfrozen freshwater [2]. Groundwater is the primary source for drinking, agricultural, and industrial activities, in many regions, if not all [3]. Unfortunately, the water resource is increasingly threatened globally by both quantitative depletion and qualitative degradation [4].
Physicochemical composition determine the quality of groundwater. The quality of ground water is influenced severely by the natural geogenic processes and anthropogenic activities [5]. Geogenic factors include rock-water interactions, mineral dissolution, and groundwater residence time. All these factors release ions and elements like Ca2+, Mg2+, SO42+, and, critically, heavy metals in the ground water [6]. As a matter of fact, anthropogenic pollution is a major driver of groundwater deterioration, worldwide. Unregulated spill of industrial effluents, leaching of fertilizers and pesticides, percolation from inadequate sanitation systems, and improper disposal of municipal solid waste are key sources of contamination [7, 8].
Sustained evidence suggested that heavy metals accumulation may be toxic [9]. Also, they impart undesirable taste and odor to water [10]. Iron (Fe) overload, for example, may lead to hemochromatosis. Whereas, higher accumulation of Zinc (Zn) may cause health complications, like stomach cramps, nausea, and copper deficiency [11]. To further complicate the situation, mobility and solubility of several heavy metals are enhanced by the acidic pH of groundwater (e.g., mean value 4.75). The concentration of heavy metals may therefore, be enhanced in the groundwater [12].
Correlation and cluster analysis, multivariate statistical techniques, are widely used to interpret complex water quality datasets. They are also used to identify the potential sources of contamination (natural vs. anthropogenic), and understand the associations between various physicochemical parameters [13, 14]. Strong correlations between certain ions can indicate common origin or synergistic geochemical behavior. Whereas, cluster analysis can group sampling locations with similar characteristics, revealing spatial patterns of pollution [15].
Recent studies highlighted groundwater deterioration around the globe. In India, studies [16-18] found high accumulation of nitrates and fluoride. They were found linked to agricultural and geogenic sources, respectively. China's industrial regions ground water were found infested with severe heavy metal pollution. High accumulation may be linked to industrial wastewater and mining activities [19]. Deterioration of water quality in Africa was an attribution of natural geology and/or lack of sanitation infrastructure [20, 21].
Our preliminary analysis revealed deviations from drinking-water guidelines set forth by the World Health Organization (WHO). The pronounced acidity (mean pH 4.75) and the alarming deviation from safe limits for iron (mean 0.57 mg/L against a WHO limit of 0.3 mg/L) and zinc (mean 0.17 mg/L against a WHO limit of 0.01 mg/L) [22]. This study, therefore, is designed to conduct analysis of physicochemical parameters of the groundwater, with the following objectives: i) to evaluate the physicochemical characteristics of groundwater under international drinking water standards, ii) to identify the parameters concerning human health, and iii) to elucidate the probable sources of contamination. This research, therefore, aimed to inform public health policy in targeted remediation efforts in the region. This study determined the quantity of heavy metals, ion contents. Furthermore, pH and electric conductivity was determined while comparing the values with the accepted standards.
2. METHODOLOGY
2.1. Study Area Description and Sampling StrategyThe study area is located in Benin, Southern Nigeria, and lies between 6o15’38.4”N, 5o38’6.9”E and 6o14’47.7”N, 5o39’59.7”E (Figure 1) in the South-South geographical zone of Nigeria. The study area is about 60 m above sea level, has a flat terrain with no drainage system to channel off surface runoff. This situation supports water stagnation after rain episodes. However, a good network of residential roads exists within the study area.
The study area falls within the humid tropical zone with a mean annual temperature of about 29°C. The highest rainfall occurs between the month of July and September and decrease as dry season approaches between December and January with mean annual rainfall of 2500mm. The vegetation comprises a few trees, shrubs and grasses.
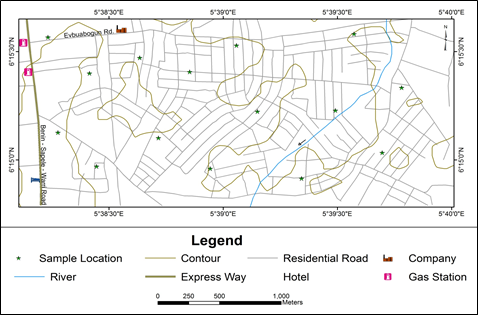
Figure 1. Location of the Study Area
A total of fifteen (15) borehole water samples were collected using 0.75L plastic cans with tight closures. These samples were taken from active boreholes at various places around the research region. The container was rinsed with a little amount of sample water before the sample was added. Prior to transporting the samples to the lab for physicochemical examination, the samples for the metal analysis were acidified with 1 ml nitric acid (HNO3) and kept in a refrigerator (to avoid the metals precipitating in the water). At the Chemistry Department Laboratory at the University of Benin in Benin City, the samples were examined for physical, chemical, and heavy metal characteristics.
2.2 Sample Collection and PreservationWater samples were collected in pre-cleaned, high-density polyethylene (HDPE) bottles following stringent protocols to prevent cross-contamination and sample degradation. Nitric acid solution (10%) followed by deionized water was used to sterilize the sample-bottles as described by Khanoranga and Khalid [15]. The samples were treated with ultrapure nitric acid to attain a pH of < 2.0. For anion analysis, the samples were not treated with the acid. The samples were placed in a dark, cooled icebox at approximately 4°C and analyzed within 24 hours of collection. This ensured sample integrity as described by Li and colleagues [19].
2.3 Analytical Procedures for Physicochemical ParametersPhysiochemical parameters were analyzed in triplicate. The mean values were computed. The procedure for each parameter adhered to standard methods of American Public Health Association following Khanoranga and Khalid procedure [15] and other internationally recognized protocols.
2.3.1. Physical Parameters.
2.3.1.1. pH and Electrical Conductivity (EC). The pH and EC were measured in situ by the collection site using a calibrated multi-parameter probe. The pH electrode was calibrated daily using standard buffer solutions at pH 4.01, 7.01, and 10.01. The EC probe was calibrated with a 0.01 M KCl solution (1413 µS/cm at 25°C). In situ measurement is to avoid post-sampling shifts in pH due to CO₂ degassing and temperature changes [3].
2.3.1.2. Turbidity. Portable turbidimeter (e.g., HACH 2100Q) was used to determine turbidity, expressed in Nephelometric Turbidity Units (NTU). The instrument was calibrated using standard formazin suspensions.
2.3.1.3. Total Dissolved Solids (TDS). TDS was calculated from the measured EC value using an empirical formula: TDS (mg/L) = k × EC (µS/cm), where k is a conversion factor. A widely accepted factor of 0.64 was applied in this study, consistent with practices for natural freshwaters [23].
2.3.1.4. Total Suspended Solids (TSS) and Total Solids (TS). These were determined gravimetrically. For TSS, a known volume of water was filtered through a pre-weighed, dried glass-fiber filter (0.45 µm pore size). The filter with the residue was dried to a constant weight at 105°C. The weight increase represented the TSS. For TS, a known volume of unfiltered sample was evaporated and dried at 105°C, and the remaining residue was weighed.
2.3.2. Chemical and Nutrient Parameters
2.3.2.1. Alkalinity and Carbonate Species. Total alkalinity was determined on-site by potentiometric titration with a standard 0.02 N sulfuric acid (H₂SO₄) solution to an endpoint of pH 4.5. The carbonate (CO₃²⁻) and bicarbonate (HCO₃⁻) concentrations were subsequently calculated from the alkalinity value and the sample pH using established thermodynamic relationships, following guidelines of American Public Health Association [12].
2.3.2.2. Major Anions (Chloride, Sulfate and Nitrate). The concentrations of these anions were determined using Ion Chromatography (IC) (Metrohm 882 Compact IC Plus). The system was equipped with a chemical suppression module and a conductivity detector. A mixture of sodium carbonate and sodium bicarbonate was used as eluent. The instrument was calibrated with multi-anion standard solutions. The method described above was previously described to analyze multiple anions [18].
2.3.2.3. Major Cations (Calcium, Magnesium). The divalent cations - Ca2+ and Mg2+ were analyzed using Flame Atomic Absorption Spectrophotometry (FAAS). An air-acetylene flame was used, and the instrument was calibrated with commercial single-element standard solutions. Lanthanum chloride (LaCl3) solution was added to prevent interference in the calcium determination.
2.3.3. Heavy Metal Analysis. The concentrations of heavy metals (Fe, Zn, Mn, Cu, Cd, and Pb) were determined using Atomic Absorption Spectrophotometry (AAS). For metals expected at higher concentrations (Fe, Zn, Mn, Cu), FAAS was employed. For the trace-level metals Cd and Pb, which have very low WHO limits, Graphite Furnace Atomic Absorption Spectrophotometry (GFAAS) was utilized due to its superior sensitivity and lower detection limits [17]. All samples for metal analysis were filtered through a 0.45 µm cellulose nitrate membrane filter prior to acid digestion with concentrated HNO₃ on a hotplate to ensure the analysis of dissolved metals and to oxidize organic complexes.
2.4. Statistical AnalysisMultivariate statistical analyses were performed to understand the complex hydrochemical dataset and the underlying patterns. Specifically, SPSS Statistics (v. 28) and R package were used.
2.4.1. Descriptive Statistics. Basic statistical parameters (Mean, Standard Error, Standard Deviation, Minimum, and Maximum) were computed for all parameters to summarize the central tendency and variability of the data.
2.4.2. Correlation Analysis. To determine shared origins or geochemical behavior among parameters, Pearson's correlation coefficient matrix was generated. This would help identify linear relationships between pairs of physicochemical parameters, if exist.
2.4.3. Cluster Analysis (R-mode). This technique was used to group the water quality parameters based on their similarity across all samples. The squared Euclidean distance was used as a similarity measure, and Ward's method was employed as the linkage algorithm.
3. RESULTS
Table 1. Physical and Chemical Analyses of Groundwater Samples from the Study Area
|
Parameters |
Mean |
S.E. |
Std. Dev. |
Min |
Max |
WHO LIMIT |
|---|---|---|---|---|---|---|
|
PH |
4.75 |
0.055 |
0.212 |
4.51 |
5.22 |
6.5 - 8.5 |
|
TURBIDITY (NTU) |
0.05 |
0.004 |
0.017 |
0.03 |
0.09 |
5 |
|
CONDUCTIVITY |
12.42 |
0.218 |
0.843 |
11.38 |
13.81 |
1000 |
|
TDS (mg/l) |
5.75 |
0.077 |
0.298 |
5.34 |
6.22 |
500 |
|
TSS (mg/l) |
6.87 |
0.524 |
2.031 |
4 |
10 |
N/S |
|
TOTAL SOLID (mg/l) |
12.99 |
0.573 |
2.221 |
9.3 |
15.3 |
N/S |
|
ALKALINITY (mg/l) |
6.76 |
0.293 |
1.135 |
4 |
8 |
N/S |
|
CARBONATE (mg/l) |
5.20 |
0.296 |
1.146 |
4 |
7 |
N/S |
|
SULPHATE (mg/l) |
1.68 |
0.041 |
0.157 |
1.21 |
1.84 |
250 |
|
CHLORIDE (mg/l) |
13.91 |
0.092 |
0.358 |
13.03 |
14.13 |
200 |
|
NITRATE (mg/l) |
1.85 |
0.050 |
0.193 |
1.54 |
2.12 |
10 |
|
CALCIUM (mg/l) |
0.92 |
0.107 |
0.416 |
0.39 |
1.73 |
200 |
|
MAGNESIUM (mg/l) |
0.48 |
0.011 |
0.042 |
0.36 |
0.53 |
20 |
|
IRON (mg/l) |
0.57 |
0.053 |
0.204 |
0.263 |
0.891 |
0.3 |
|
ZINC (mg/l) |
0.17 |
0.013 |
0.050 |
0.116 |
0.269 |
0.01 |
|
COPPER (mg/l) |
0.06 |
0.004 |
0.014 |
0.039 |
0.086 |
0.5 |
|
MANGANESE (mg/l) |
0.05 |
0.021 |
0.083 |
0.021 |
0.35 |
0.1 |
|
CADMIUM (mg/l) |
0 |
0 |
0 |
0 |
0 |
0.003 |
|
LEAD (mg/l) |
0 |
0 |
0 |
0 |
0 |
0.05 |
To analyze physicochemical parameters, fifteen (15) random groundwater samples were collected. The following parameters were studied: hydrogen potential, electrical conductivity, turbidity, total suspended solids, total solids, alkalinity, carbonate, sulphate, chloride, and nitrate levels. Along with them, Ca, Mg, Fe, Zn, Pb, Cd, Cu, and Mn concentrations were measured.
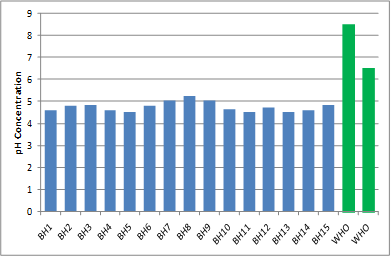
Figure 2. Comparative pH Values and WHO Minimum and Maximum Limit
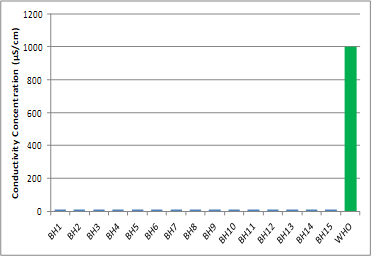
Figure 3. Comparative EC Concentration Values and WHO Limit
The physicochemical characterization of the groundwater samples provides clear evidence of a weakly mineralized and acidic aquifer system. The measured parameters when statistically analyzed and the graphically represented (Figures 2–13), revealed key geochemical processes that might affected groundwater quality.
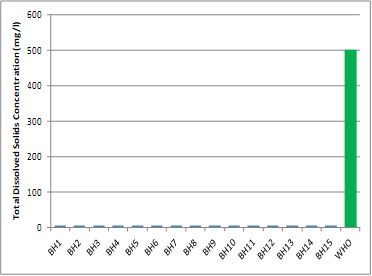
Figure 4. Comparative TDS Values and WHO Standard
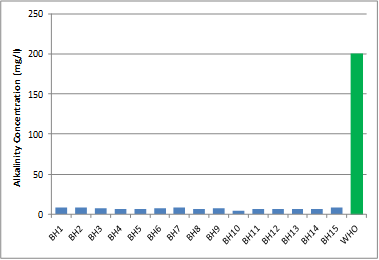
Figure 5. Comparative Alkalinity Values and WHO Standard
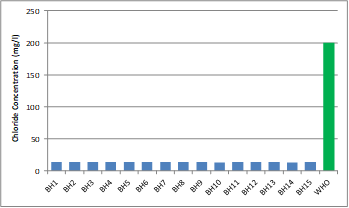
Figure 6. Comparative Cl- Values and WHO Standard
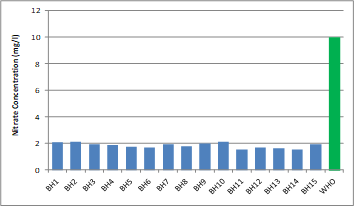
Figure 7. Comparative NO3- Values and WHO Standard
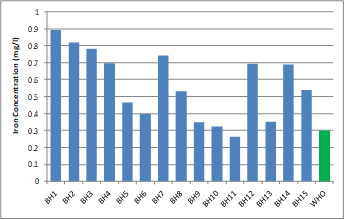
Figure 8. Comparative Fe Concentration Values and WHO Limit
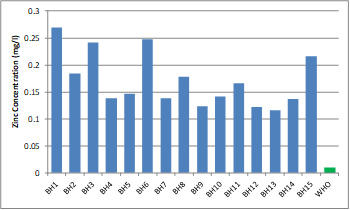
Figure 9. Comparative Zn Concentration Values and WHO Limit
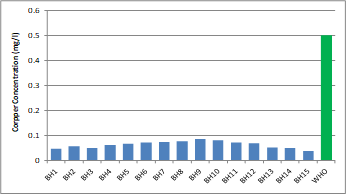
Figure 10. Comparative Cu Concentration Values and WHO Limit
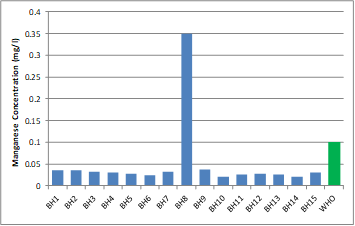
Figure 11. Comparative Mn Concentration Values and WHO Limit
Table 2. Correlation Coefficient Matrix of Ground Water Quality Parameters in the Study Area
| PH | Turb | EC | TDS | TSS | TS | ALK | CO32- | SO42- | Cl- | NO3- | Ca2+ | Mg2+ | Fe2+ | Zn2+ | Cu2+ | Mn2+ | |
|---|---|---|---|---|---|---|---|---|---|---|---|---|---|---|---|---|---|
| PH | 1 | ||||||||||||||||
| Turb | .143 | 1 | |||||||||||||||
| EC | .154 | .855** | 1 | ||||||||||||||
| TDS | .384 | .770** | .861** | 1 | |||||||||||||
| TSS | .052 | -.312 | -.182 | -.080 | 1 | ||||||||||||
| TS | .140 | -.270 | -.220 | .016 | .921** | 1 | |||||||||||
| ALK | .364 | .190 | .299 | .340 | .010 | -.031 | 1 | ||||||||||
| CO32- | .045 | -.332 | -.300 | -.241 | .933** | .846** | .045 | 1 | |||||||||
| SO42- | .297 | .188 | .265 | .315 | -.136 | -.126 | .966** | -.095 | 1 | ||||||||
| Cl- | .304 | .262 | .379 | .427 | .020 | .125 | .726** | -.059 | .773** | 1 | |||||||
| NO3- | .289 | -.140 | .080 | .117 | .817** | .670** | .261 | .737** | .042 | .128 | 1 | ||||||
| Ca2+ | .058 | -.084 | .101 | .144 | .678** | .597* | .407 | .644** | .333 | .362 | .663** | 1 | |||||
| Mg2+ | .110 | -.142 | .143 | .080 | .510 | .472 | .324 | .399 | .229 | .579* | .673** | .562* | 1 | ||||
| Fe2+ | .137 | .063 | .080 | .215 | .261 | .188 | .528* | .243 | .477 | .181 | .366 | .622* | -.032 | 1 | |||
| Zn2+ | .097 | .176 | .232 | .203 | .273 | .183 | .431 | .297 | .434 | .330 | .285 | .621* | .341 | .342 | 1 | ||
| Cu2+ | .346 | .085 | .004 | -.021 | .099 | .216 | -.406 | .065 | -.439 | -.065 | .026 | -.262 | .066 | -.506 | -.434 | 1 | |
| Mn2+ | -.273 | .065 | .186 | .075 | .207 | .119 | .584* | .226 | .484 | .344 | .381 | .414 | .435 | .317 | .114 | -.282 | 1 |
r (0.05)(∞2) df (13)=0.514
r (0.01)(∞2) df (13)=0.641
Bold values = Significant (p<0.05)
Bold values with underline = Highly Significant (p<0.01)
3.1. Electrical Conductivity, pH and Dissolved ConstituentsThe logarithm of the hydrogen ion activity is presented as the reciprocal of the pH, which measures the activity of the hydrogen ion (H+), according to [3]. The pH measured in the research region varied from 4.51 to 5.22, with BH8 recording the highest value and BH11 recording the lowest value. The recommended WHO guideline of 6.5 to 8.5 is not met by any results (Table 1). According to [16], the low pH found in the study area may leach metal ions like Fe, Mn Cu, Pb, and Zn from plumbing fixtures and piping and may cause aesthetic issues like a metallic or sour taste, laundry staining, and the distinctive staining of sinks and drains.
Electrical conductivity of 11.38-13.81 µS/cm with mean 12.42 µS/cm was extremely low as compared to the WHO limit of 1000 µS/cm (Figure 3). Similarly, TDS values (5.34–6.22 mg/L; mean 5.75 mg/L) shown in Figure 4 indicate a very dilute groundwater system. These low values suggest limited water–rock interaction and possibly rapid infiltration of rainwater with minimal mineral dissolution.
The very strong correlation between EC and TDS (r = 0.861, p < 0.01) confirmed that EC in this aquifer is primarily controlled by dissolved ionic content (Table 2). Together, the conductivity and TDS patterns indicate a low-mineralized aquifer system typical of shallow recharge environments in crystalline basement terrains.
3.2. Suspended and Total SolidsTotal suspended solids found to be 4–10 mg/L; mean 6.87 mg/L and total solids determined as 9.3–15.3 mg/L showed moderate variability (Table 1). Although no WHO limits exist for these parameters, the relatively low values suggest minimal sediment transport except in localized areas. Significant correlations between TSS and carbonate (r = 0.933) and between TSS and total solids (r = 0.921) (Table 2) indicate the dominance of particulate-associated carbonate minerals contributing to the solid load. These suspended solids also play a role in adsorbing or transporting trace metals, influencing the distribution of Fe, Zn, and Mn.
3.3. Major AnionsCl- ions were observed in both surface and groundwater. Cl- has a significant advantage over impurities like ammonia for the purpose of calculating sewage effluent content because it is resistant to oxidation or other methods of removal [8]. Cl- concentrations (13.03–14.13 mg/L; mean 13.91 mg/L) were well below the WHO limit (200 mg/L), indicating limited influence from anthropogenic sources such as sewage or agricultural runoff (Figure 6). Sulphate (1.21–1.84 mg/L; mean 1.68 mg/L) and nitrate (1.54–2.12 mg/L; mean 1.85 mg/L), and supported by the graphical outputs, remained far below WHO permissible limits (Figures 7; Table 1). Since nitrifying bacteria oxidize nitrogen from organic materials to produce nitrate. Nitrate was present in all subsurface water. The nitrate content also included sewage effluents.
The extremely strong correlation between sulphate and alkalinity (r = 0.966) and the high correlation between chloride and sulphate (r = 0.773) implied shared lithological or geochemical sources (Table 2). These patterns suggested that the major anions originated primarily from natural mineral dissolution rather than anthropogenic pollution.
3.4. Major CationsCa2+ (0.39–1.73 mg/L; mean 0.92 mg/L) and Mn2+ (0.36–0.53 mg/L; mean 0.48 mg/L) determined to be significantly below WHO thresholds (Table 1). This confirmed the limited dissolution of carbonate and silicate minerals in the aquifer. Their low levels were in line with the overall dilute nature of the groundwater. Correlation patterns of Ca+2–NO-3 (r = 0.663) and Mg²⁺–NO-3 (r = 0.673) suggested shallow soil. Water interactions might influence these cations, although their absolute values remain very low (Table 2). Furthermore, alkalinity in the samples made the water less sensitive to acids.
3.5. Trace Metals3.5.1. Iron (Fe²⁺). Fe2+ concentrations (0.263–0.891 mg/L; mean 0.57 mg/L) exceeded the WHO limit of 0.3 mg/L in many samples (Figure 8). Increased Fe2+ concentrations are consistent with pH-driven mobilization, given the acidic conditions (Figure 2). The moderate correlations between Fe and alkalinity (r = 0.528) and Fe2+ and Ca²⁺ (r = 0.622) might reflect geogenic influence through mineral weathering (Table 2). Unpalatable water contains iron, and when that water is exposed to air, the iron precipitates out and leaves behind dark streaks [16].
3.5.2. Zinc (Zn²⁺). Zn2+ concentrations (0.116–0.269 mg/L; mean 0.17 mg/L) exceeded the WHO limits of 0.01 mg/L (Figure 9). Natural mineralization or anthropogenic inputs such as galvanized materials or solid waste leachates might be the best possible reasons. The correlation of Zn2+ with Ca²⁺ (r = 0.621) suggested co-release during mineral dissolution. Higher concentration of Zn2+ might leave a metallic or unpleasant taste in water [24].
3.5.3. Copper (Cu²⁺). To our satisfaction, Cu2+ values (0.039-0.086 mg/L) remained within WHO limits (0.5 mg/L). This may indicate negligible contamination from plumbing or industry (Figure 10).
3.5.4. Manganese (Mn²⁺). Long-term exposure could have deleterious effects, specifically affecting the nervous system, on youngsters, the elderly, and expectant-mothers. The contamination might manifest as Parkinson's-like symptoms, as previously reported [1]. Mn levels ranged from 0.021 to 0.35 mg/L, with several samples exceeding the WHO permissible limit (0.1 mg/L) ( Figure 11) . This might align with the well-known phenomenon of Mn mobilization under acidic and reducing conditions, consistent with the low pH environment (Figure 2). The correlation between Mn and alkalinity (r = 0.584) supported a geogenic source.
3.5.5. Lead (Pb) and Cadmium (Cd). Pb and Cd were not detected in any sample ( Table 1 ), indicating no contamination from battery disposal, industrial effluents, or vehicular residues. Although they were not present in all samples, Cd and Pb might be health hazards. According to a study [25], Cd entered aquatic systems through the weathering and erosion of soils and bedrock, atmospheric deposition, direct industrial discharge, leaking from landfalls and polluted sites, and the dispersive use of fertilizers in agriculture, while Pb poisoning is uncommon, chronic exposure at relatively low levels, as is anticipated in the study areas, could have negative health effects. These effects might include interference with RBCs’ chemistry, babies' birth and young children's normal physical and mental development, slight deficits in children's attention span, hearing, and learning abilities, and slight increases in blood pressure in some adults [20].
3.6. Statistical Structure and Geochemical Groupings/ Cluster Analysis (R-mode)The correlation matrix ( Table 2 ) revealed clear patterns of EC, TDS, and turbidity constituting a strong geochemical cluster (EC–TDS r = 0.861; EC–turbidity r = 0.855). This confirmed that conductivity is jointly controlled by dissolved and suspended constituents. Alkalinity, sulphate, and chloride clustered together.
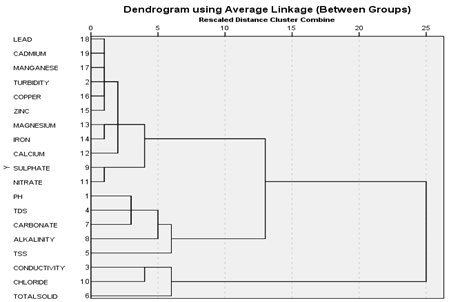
Figure 12. Dendrogram (R – Mode)
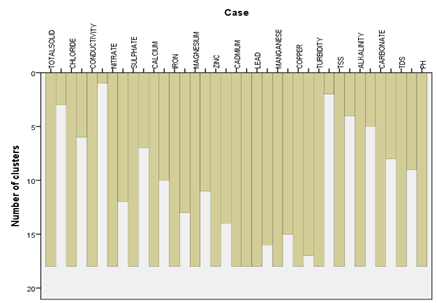
Figure 13. Icicle Diagram (R-Mode)
The cluster was supported by high correlations of alkalinity–SO₄²⁻ r = 0.966; Cl⁻–SO₄²⁻ r = 0.773. Fe, Mn, Zn, and carbonate-related variables showed moderate associations, indicating particulate and pH-related mobilization. The results were justified the dendrogram and icicle plot ( Figure 12 and 13 ). The clustering might reflected shared geochemical processes.
To sum it up, the dendrogram and icicle plot showed clear grouping/clustering of the studied parameters. This may reflect common sources or geochemical traits. One cluster links EC, TDS, turbidity, and TSS indicating mineralization–solids association. This showed that the groundwater might be contaminated through ground surface infiltration. Another cluster groups alkalinity, sulphate, and chloride, indicating shared lithological or geochemical origin. Mineral dissolution or soil leaching might be the possible reason of this clustering. Trace metals, like Fe, Zn, Mn, clustered moderately with carbonate and total solids. The particulate matter and the acidity might help to mobilize trace elements. To conclude the above, these clusters confirm key controls on groundwater chemistry. They include shallow subsurface interaction, low buffering capacity, and natural geochemical dissolution.
4. CONCLUSION
A total of fifteen (15) random groundwater samples were collected from Benin, Southern Nigeria. They were analyzed for their physiochemical composition. Analysis indicated that the groundwater contained low mineralization, weak buffering capacity, and persistent acidity, with all pH values falling below WHO guidelines. Major ions remain within permissible limits, however, Fe, Mn, and Zn concentrations reflected enhanced geogenic metal mobilization under acidic conditions. Our study determined that the dissolved solids, suspended particulates, and trace metals are controlled by hydro-geochemical indicators. The absence of Pb and Cd suggested minimal anthropogenic contamination. Despite low salinity, the groundwater may not be suitable for direct consumption. The groundwater, therefore, required pH adjustment and removal of toxic levels of metals. Looking into the above, continued monitoring and aquifer protection are essential to preserve groundwater quality.
Author Contribution
Peter Bassey: conceptualization, supervision. Asine Osedebamen: methodology, formal analysis, writing-original draft. Ayamezimi Oziofu Ehinlaiye: writing-original draft. Kennedy Odu Ojo: investigation, data curation
Conflict of Interest
The authors of the manuscript have no financial or non-financial conflict of interest in the subject matter or materials discussed in this manuscript.
Data Availability Statement
Data supporting the findings of this study will be made available by the corresponding author upon request.
Funding Details
No funding has been received for this research.
Generative AI Disclosure Statement
The authors did not use any type of generative artificial intelligence software for this research.