

| Review | Open Access |
|---|
Determination of Aflatoxins B1, Proximate and Sensory Parameters in Different Edible Products Collected from Local Market of Lahore, Pakistan |
 |
|---|
 Muhammad Aslam1*,
Mehvish Abd-Ul-Rehman1,
Zahra Noreen2,
Shahid Masood3,
Yousuf Abbas1,
Aamir Sohail1, and
Muhammad Aneeq Javed1
Muhammad Aslam1*,
Mehvish Abd-Ul-Rehman1,
Zahra Noreen2,
Shahid Masood3,
Yousuf Abbas1,
Aamir Sohail1, and
Muhammad Aneeq Javed1
1Department of Chemistry, Division of Science and Technology, University of Education, Lahore, Pakistan
2Department of Botany, Division of Science and Technology, University of Education, Lahore, Pakistan
3Food and Biotechnology Research Centre, Pakistan Council of Scientific and Industrial Research Laboratories Complex, Lahore, Pakistan
The research was performed to determine the Aflatoxin B1 (AFB1), proximate, and sensory parameters in different edible products collected from local markets of Lahore. Total 185 samples were collected from the local markets of Lahore, Pakistan, ensuring that they have different levels of aflatoxin. Only 30 (16.2%) samples of rice gave AFB1 (e.g., 1.57ppb, 2.34ppb, 3.79ppb and 4.01ppb) out of 185 samples. Other aflatoxin types were absent in this research. The proximate, physiochemical, and sensory characteristics of different edible products were determined. Proximate protein, fiber, fat, ash, moisture content, and gluten were determined. Brix value, specific gravity, pH, and acidity were also evaluated. These edible products showed values of 6.14% and 10.2% protein in the flour and whole wheat, 21.21% fiber in corn leaves, 0.71% and 10.2% fat in beta-carotene and nankhatai biscuits, and 8% gluten in the flour. The sensory parameters were detected as odor and solubility in different edible products. It was concluded that Super Basmati Parboiled Brown Rice contained the highest amounts of aflatoxins. While, the proximate parameters and sensory parameters were in their acceptable range. In order to make edible products safe, there is a need to reduce the amounts of aflatoxins in edible products.
Highlights
- The study showed that only 16.2% of 185 edible-product samples from Lahore markets were contaminated with aflatoxin B1, with Super Basmati parboiled brown rice showing the highest levels. However, other aflatoxin types were not found.
- Comprehensive proximate and physicochemical profiling (protein, fat, fiber, ash, gluten, moisture, pH, Brix, acidity, specific gravity) demonstrated that the tested samples generally remained within acceptable nutritional and safety ranges.
- Sensory evaluation (odor, solubility and overall acceptability) confirmed good consumer-acceptable quality of the samples. This may emphasize that targeted mitigation of aflatoxin B1 in high risk rice varieties is the key safety intervention needed.
1. INTRODUCTION
Edible products are an essential part of our nutrition/diet. It is essential to keep these edible products safe in order to ensure good health [1]. The contamination of these edible products through aflatoxins causes health and economic issues [2]. Aflatoxins are toxic and carcinogenic fungal metabolites produced by species of Aspergillus, especially both Aspergillus flavus, Aspergillus nomius, and Aspergillus parasiticus [3]. The exploration of Malignancy orchestrated aflatoxin types took place in 2012, by the Universal Office, all concerns were related to the disease-causing agent [4]. The carcinogenic effect of aflatoxins is increasing day by day in developing countries, such as Pakistan. This may cause serious health issues for human and animal health [2]. It causes acute hepatitis and immune suppression. According to the International Agency for Research on Cancer (IARC), the carcinogenic effect of aflatoxins predominantly takes place on the liver [5]. The estimated business yield is reduced due to Aflatoxin's effect on edible products [6]. Environmental storage conditions are regularly prepared for structure improvement and mycotoxin creation at room temperature. This maximizes the level of pollution [7]. Over 1029 samples have been examined and proceeded by TLC by Alimun Nisa in the year 2014 including (33.13%) white rice, (22.42%) natural shade rice, (39.39%) broken rice, (24.27%) Sella rice, (26.92%) parboiled rice was found dairy with B1, B2 that was distinguished in (3.03%) white rice, (1.47%) hearty hued rice, and (3.03%) broken rice. While (3.65%) gritty hued rice, (1.5%) trial parboiled rice, and (0.8%) were found affected by aflatoxins [8]. Thin layer chromatography and fluid chromatography analysis showed that oil contains Aflatoxin B1 (AFB1) at a level of 5-200 µg/kg [9].
Proximate analysis is a technique which decides the estimations of the macronutrients in food tests. Through this analysis, by using the fat and protein, the values of different nutrients can be calculated, such as protein, ash, crude fiber, moisture, and proteins that constitute the sample [10]. Proximate analysis is essential to keep all the constituents in the desired quantity. Brix is the sugar substance of a fluid. The citrus extract is employed as a further substance in several drinks to boost flavor and taste but the high sugar content badly affects teeth [11].
Sensory parameters were determined by using the human senses. No instrument was required for this purpose. Panels of researchers sat and measured the sensory parameters. If these panels give satisfactory results, they are said to be scientific instruments [12]. Sensory parameters determine the storage stability and consumer preference for the prepared products. These parameters included odor, solubility, pungency, taste, and overall acceptability [13].
This study aimed to determine the aflatoxins, proximate, and sensory parameters in different edible products collected from numerous territories of Lahore.
2. MATERIALS AND METHODS
2.1. InstrumentsElectronic balance, Model No. D432611624, SHIMADZU CORPORATION JAPAN was used for mass measurements. pH was determined with WTW 1F10-220 Inolab Level 1 Multiparameter Meter without Probe, 110 V. Digital refractometer (H196801, Romania) was used to calculate the sugar contents in the energy drink samples. For ash, box furnace, Model no. BF51766c-1 was used. Spectrophotometer (Thermo electron corporation, Evolution 300 LC, England) was also used in this study.
2.2. Collection of SamplesLike other countries, Pakistani people also use edible food products from several sources, such as home-made and commercial. In the current study, 185 samples of different edible products, such as rice, red chili, dates, corn (also called Makkai), pine nut, and vermicelli were collected. These were collected from different local markets of Lahore, Pakistan. Aflatoxin level was assessed by comparison with standard of varying aflatoxin concentration [7].
For proximate and sensory parameters, samples were also collected, such as whole wheat was used for protein. For fat, beta-carotene carbohydrate and Nan-khatai biscuits were used. Corn dry leaves were used for fiber and ash. Flour was used for gluten. For percent moisture content, beta-carotene, carbohydrate, corn, flour, long bun, mini bun, whole wheat bread, Tafton bread, dinner roll, plain bun, sweet bun, sheer mall, fruit bun, burger bun, baker khani, cake Rusk premium, hot dog roll, kalvinji roll, and garlic roll were used. Citrus lemon juice and mango juice were used for acidity and brix. Citrus lemon juice, mango juice, and different juices of fruits were used for ph. determination. Pomegranate (carbonated juice) was used for acidity and specific gravity. Sodium benzoate (white, granules or crystalline powder) and sodium meta bisulfite (whitish-appearance in its solid-state) were used for sensory parameters.
2.3. Determination of Aflatoxins2.3.1. Sampling. Aflatoxin was not consistently appropriate in edible food products. It was present in the form of pockets of different sizes. Consequently, they were processed through a sample divider or processor to get better homogeneity.
2.3.2. Extraction. Extraction with chloroform is the most suitable method for aflatoxin determination. Briefly, 50 g of ground sample was mixed with 25 mL of water in a 250 mL volumetric flask. Then, 150ml chloroform was added and shaken for 30 minutes through wrist action. Separation was done through filter paper. 50mL of the filtrate was taken into the beaker and dissipated by using a hot plate. After removing the beaker, 1ml chloroform was added in it. The dilution for spotting got in micro liter. The 25μL spots were applied on thin layer of chromatography plate with micro syringe or micropipette. Two TLC tanks were developed. The TLC plate was first developed in diethyl ether for 30minutes. After collapse of period, the TLC plate was dried. This plate was redeveloped in a similar way in another TLC tank with acetone– chloroform (1:9) as mobile phase for 20 minutes. After that, the plate was evacuated and dried. TLC plate was observed under UV light for the occurrence of aflatoxin spot [14].
2.4. Proximate Parameters 2.4.1. Determination of Nitrogen Content2.4.1.1. Digestion. 5g of the sample was moved to the assimilation cup. 25mL sulphuric acid and 2 - 3g digestion tablet were added and heated. Any nitrogen contents in the food were changed into alkali and other natural compound to CO2 and H2O.

2.4.1.2. Dilution and Distillation. Digested sample was diluted to 100mL and volume was made in volumetric flask. 10mL of 40% NaOH was added in 5mL of diluted sample. 10mL of 2% boric acid and 2-3 drops of phenolphthalein as indicators were added from the opposite side. In the presence of warmth, nitrogen from reaction flask moved to receiving flask as smelling salts. Pinkish shade of the solution in receiving flask changed to transparent.
2.4.1.3. Titration. Distilled solution was titrated with HCl and the end point of this titration changed in color from whitish to light pink. Volume of HCl utilized was noted [15].

2.4.2. Determination of Fat. 2.73g and 5.620g samples were measured and dried in an oven set at 98oC for 3-4 hours. Then, these were placed out of the oven, cooled, and set up at Soxhlet apparatus. The vacant 100mL volumetric flask was weighed and n-hexane was added in the volumetric flask up to mark. After that, sample was set into a siphon tube and warmed. n-hexane has a low boiling point than fat. So, it began boiling at 60-65oC. Into the siphon tube, fat was dissolved from sample. On felling down into receiving flask, the siphon tube was filled once more, 5-6 cycles were repeated, and after that heating was stopped. During this, n-hexane was recovered. The flask was removed and placed into oven to evaporate the remaining hexane and flask was weighed again. The remaining material was fat-extracted from sample [16].
Fat in the sample can be calculated by using the following formula:

2.4.3. Determination of Fiber Contents. 0.264g sample was weighed and put in a clean dry beaker. 100mL of 1.25% H2SO4 was added and set on processing mechanical assembly, distilled water was added during bubbling. The beaker was removed and the content was filtered through Muslin cloth. 100mL of 1.25% of NaOH was added into filtrate and repeated above procedure again. The experiment was repeated for three times and 50 mL of distilled water was used to evacuate chemicals or impurities. Sample was weighed and put for drying in an oven at 110oC for 30 minutes. Now, the petri dish was placed in a muffle furnace for 3 - 4 hours at 550oC. White ash was formed. It was cooled in a desiccator and weighed to determine the percent fiber in a sample [17].

2.4.4. Determination of Gluten. 15.0g wheat flour was weighed and put in a petri dish. Flour was blended in with distilled water to form a dough ball. Dough ball was placed in distilled water for 30 minutes. Size of the dough ball increased. After 30 minutes, it was removed. The dough ball was slowly washed by taking in hands under running distilled water until a sticky material was obtained. Sticky material was placed in glutimer and pressed for 4 minutes and glutimer was run. The material was removed from glutimer and weighed [18, 19].
2.4.5. Determination of Ash. Crucible used for the estimation of ash content was weighed and then dried at 110οC in an oven. 0.38g sample was taken in crucible and burnt on burner. It was then placed in a furnace and maintained at 550οC for overnight until the sample was converted into white ash. After that, it was chilled in a desiccator and weighed using analytical balance.
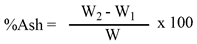
where,
W1 = Weight of empty crucible
W2 = Weight of empty crucible + ash
W = Weight of sample
2.4.6. Determination of Percent Moisture Content (MC). Vacant petri plates were washed, dried, and then weighed. Samples were added to the petri plates and again weighed. Petri plates were placed in an oven at 110oC and removed after 4-5 hours. These petri plates were placed in a desiccator for cooling. After 30 minutes, petri plates were removed from the desiccator and weighed again. The experiment was repeated till constant readings were obtained and average reading was calculated.

2.5. Physicochemical Analysis
2.5.1. Determination of pH. The pH meter electrode was washed, dried, and then rinsed with the sample prior to measurement. The 100mL beaker was filled with the sample. After dipping the electrode in sample, the pH at 25 oC was recorded. Electrode was cleaned and then submerged in a buffer solution.
2.5.2. Determination of Brix. BRIX level (symbol °Bx) was analyzed in the given samples. 1 - 2 drops of the sample were added on the slide of the refractometer. The digital refractometer was cleaned with cotton properly before and after using it, until no drop of sample solution remained on the outer side of the refractometer.
2.5.3. Determination of Acidity. The acidity was found based on the concentration of the citric acid. 10 mL of sample solution of the edible food products was added in 90 mL of distilled water. Titration was done against 0.1M NaOH. Phenolphthalein was used as an indicator. Acidity was determined with the help of the following formula:

2.5.4. Determination of Specific Gravity. ASTM 854 was used to determine the specific gravity. Pycnometer was filled with distilled water and weight (W1) was noted. Then, it was emptied and filled with sample and weight (W2) was also noted. The ratio of these weights gave the specific gravity of prepared samples.
Weight of the specific gravity bottle and water = W1
Weight of specific gravity bottle and sample = W2 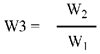
Specific gravity of sample = W3
2.6. Sensory Parameters1g of sample was taken in a beaker. 100mL of distilled water was added to dissolve the sample. The color, taste, aroma, and the overall acceptability of prepared sample was checked and found to be excellent to good overall.
3. RESULTS AND DISCUSSION
During the time of harvesting, controlling, and collection, rice can be spoiled by aflatoxins production due to favorable conditions [20, 21]. In Asian countries, the predominant presence of aflatoxins in rice has been described in various studies [21, 22]. The current research clearly depicted the AFB1in different rice samples. A total of 30 out of 185 samples contained AFB1. These samples contained AFB1 in different limits, that is, 2 to 4ppb. The results of Aflatoxins B1 in different rice samples are given in Table 1.
Table 1. Determination of Aflatoxin B1 (AFB1) in Edible Products
|
Sample ODR |
Sample name |
AF B1 in ppb* |
Sample ODR |
Sample name |
AF B1 in ppb* |
|---|---|---|---|---|---|
|
03 |
Organic Basmati Brown Rice |
2.32 |
04 |
Organic Basmati brown Rice |
3.10 |
|
05 |
Organic Basmati Rice |
2.72 |
06 |
Organic Basmati Rice |
3.78 |
|
60 |
Super Basmati Brown Rice |
2.32 |
61 |
Super Basmati Brown Rice |
2.01 |
|
62 |
Super Basmati Parboiled Brown Rice |
4.07 |
63 |
Super Basmati Parboiled Brown Rice |
4.69 |
|
460 |
Super Basmati Brown Rice |
3.78 |
423 |
Brown Rice |
1.84 |
|
425 |
Brown Rice |
1.83 |
942 |
Super Basmati brown rice |
2.33 |
|
943 |
Super Basmati Brown Rice |
4.00 |
946 |
Super Basmati Brown Parboiled Rice |
3.26 |
|
946 |
Super Basmati Brown Rice |
2.34 |
947 |
Super Basmati Brown Rice |
4.01 |
|
948 |
Super Basmati Brown Rice |
3.93 |
939 |
Brown Rice |
2.34 |
|
885 |
Rice |
1.56 |
886 |
Rice |
1.53 |
|
858 |
Super-Kernel basmati brown Rice |
2.34 |
869 |
Pakistani Basmati Rice |
1.57 |
|
235 |
Super Basmati Brown Rice |
3.79 |
266 |
1121 Sella Basmati Rice |
1.85 |
|
256 |
Super Basmati parboiled Golden Rice |
1.86 |
240 |
Super Basmati Brown Rice |
4.74 |
|
242 |
Super Basmati Brown Rice |
2.32 |
244 |
Super Basmati Brown Rice |
2.73 |
|
245 |
Super Basmati brown Rice |
4.75 |
247 |
Super Basmati Brown Rice |
3.10 |
*ppb: parts per billion
The percentage of AFB1 in the different samples is 16.21% (Figure 1).
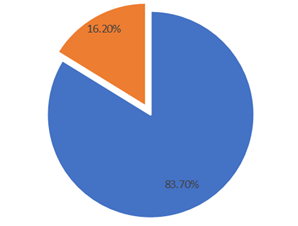
Figure 1. Aflatoxin B1 (AFB1) Percentage in Various Samples of Rice
Other samples, that is, red chili, vermicelli, BBQ taxes, curry powder, walnut, bitter apricot kernel, dates, raisins, pine nut, corn, coffee beans, and Walton tea rusks, and a different sample of rice were not contaminated with aflatoxins.
Proteins are of significant importance for the development and growth of the human body. These are also helpful in the action of enzymes and the movement of macrobiological as well as other biochemical compounds across the cell membrane [23]. Fats are a major part of our food which are necessary for the growth of human body, mainly the brain [24]. The value of fat was 0.71% and 19.56%. The percentage of protein and fat is given in Table 2.
Table 2. Percentage of Protein and Fats in Edible Products
|
Parameters |
Samples |
% |
|---|---|---|
|
Protein |
Flour |
6.14% |
|
Whole Wheat |
10.2% |
|
|
Fats |
Beta Carotene |
0.71% |
|
Nan Khatai Biscuit |
19.56% |
Fiber as an essential part of food provides health benefits including digestive system, weight management, cardiovascular, and general fitness [17]. The value of fiber was 21.21%. Ash content is the determination of mineral substance present in the sample. The value of ash was 11.57%. The percentage of fiber and ash is given in Table 3.
Table 3. The Percentage of Fiber and Ash
|
Parameters |
Samples |
% |
|---|---|---|
|
Fiber |
Corn Dry Leaves |
21.21% |
|
Ash |
Corn Dry Leaves |
11.57% |
A total of 8% gluten was present in 15.0g flour. Moisture content (MC) is a measure of the shelf life of the sample. If a large amount of MC is present, it would spoil the sample due to microbial attack. This is the most important test used in different industries to check the shelf life of samples [25]. Two batches were performed on the same samples by drying or direct method. Batch 1 had 16.82%, 7.6%, and 10.3% and 8.86%, while batch 2 had 18.2%, 7.7%, 9.6%, and 8.70%. Proximate parameters in edible products are given in Table 4.
Table 4. Percentage of Moisture Content (MC) in Edible Products
|
Sample |
Beta Carotene % |
Carbohydrate% |
Corn% |
Flour% |
|---|---|---|---|---|
|
MC-1 |
16.82 |
7.6 |
10.3 |
8.86 |
|
MC-2 |
18.2 |
7.7 |
9.6 |
8.70 |
Different juices were used for the determination of physiochemical parameters. These juices had a pH range from 2.80 - 4.13. The powerful juice of pH 4.13 was less acidic, while the juice of pH 2.80 was more acidic than all other juices. Citrus products had low pH, which means they are acidic. They indicated upper gastrointestinal issues, such as an ulcer or reflux. The value of pH is given in Table 5. The Brix value depends upon the temperature [26]. The percentage brix is given in Table 6.
Table 5. Value of pH in Different Juices
|
Sample |
pH (25oC) |
Sample |
pH (25oC) |
|---|---|---|---|
|
Mango Juice |
4.13 |
Fruit juice P8 |
3.73 |
|
Fruit Juice 3L |
3.75 |
Fruit juice P9 |
3.65 |
|
Fruit Juice P6 |
3.73 |
Fruit juice P10 |
3.75 |
|
Fruit Juice P7 |
3.77 |
Lemon juice |
2.80 |
Table 6. Percentage Brix in Juices
|
Sample Name |
Brix (%) |
|
|---|---|---|
|
Citrus Lemon Juice |
6.7% at 18.4oC |
|
|
Mango Juice |
15.0% at 18.0oC |
|
The acidity percentage ranged from 0.16 - 0.2816%, respectively. Pomegranate juice had a slightly larger acidity percentage which is not too bad for health. Individuals who are sensitive to pomegranate may encounter itching, runny nose, and trouble relaxing. The percentage acidity is given in Table 7.
Table 7. Percentage Acidity of Juices
|
Sample |
Acidity % |
|---|---|
|
Mango Juice |
0.16 |
|
Pomegranate Juice |
0.2816 |
The specific gravity which had a 103.49 value at zero-day also increased to 103.51 after 90 days of storage. The change in specific gravity was due to the breakdown of organic acids and other changes, such as sugar inversion [27]. The sensory parameter is given in Table 8.
Table 8. Sensory Parameters of Chemicals
|
Parameters |
Sodium Benzoate |
Metabisulphate |
|---|---|---|
|
Solubility |
Freely Soluble in Water |
Fairly Soluble in Water |
|
Odor |
Odorless |
Faint Pungent |
The current study aimed to measure the aflatoxins, proximate and physiochemical, and sensory parameters which deliver safe food for human utilization and to eliminate the poisonous and polluted food species. A total of 16.2% samples of rice gave positive results for aflatoxins. Only AFB1 was present and other types were absent. These samples were grown and stored in tropical and subtropical regions. AFB1 causes serious damage to liver. An optimum value of proximate parameters in macronutrients is necessary for growth and development but high or less range would be harmful. An optimum pH was a suitable range from 6.5 - 7.5 and a pH of 5.5 was considered as a limit level for the improvement of dental decay. If pH dropped from 5.5 for a long time, then the teeth would be demineralized quickly [28]. Sensory analysis was performed for odor and solubility. Comparative studies were also done with similar products to evaluate the quality of the edible products.
Author Contribution
Muhammad Aslam: conceptualization, supervision. Mehvish Abd-Ul-Rehman: methodology, formal analysis. Zahra Noreen: conceptualization. Shahid Masood: writing-orignal draft, Yousuf Abbas: writing-orignal draft. Aamir Sohail: writing-orignal draft. Muhammad Aneeq Javed: writing-orignal draft.
Conflict of Interest
The authors of the manuscript have no financial or non-financial conflict of interest in the subject matter or materials discussed in this manuscript.
Data Availability Statement
The data associated with the study may be provided by the corresponding author if requested.
Funding Details
No funding was received for this research.
Generative AI Disclosure Statement
The authors did not use any type of generative artificial intelligence software for this research.
REFERENCES
- Preet S, Kumar R, Sabapathy SN, Bawa, AS. Functional and edible uses of soy protein. Compr Rev Food Sci Food Saf. 2008;7:14-28. https://doi.org/10.1111/j.1541-4337.2007.00025.x
- Naseem Z, Ayesha I, Muhammad A, et al. Effect of moisture content on Aflatoxin B1 production in wheat flour samples collected from Lahore, Pakistan. Pak J Anal Environ Chem. 2019;20(2),184-189. http://dx.doi.org/10.21743/pjaec/2019.12.23
- Amir HN, Alessandra D, Massimo L, Eliana BS, Antonello S. Characteristics, occurrence, detection and detoxification of Aflatoxins in foods and feeds. Foods. 2019;9(5):e644. https://doi.org/10.3390/foods9050644
- Nicoleta MM, Mihaescu G, Carmen C. Aflatoxins health risk factors. Bacteriol Virusol Parazitol Epidemiol. 2010;55(1):19-24.
- Gnonlonfin GJ, Hell K, Adjovi Y, et al. A review on Aflatoxin contamination and its implications in the developing world. Crit Rev Food Sci Nutr. 2013;53(4),349-365. https://doi.org/10.1080/10408398.2010.535718
- Noreddine B. Aflatoxins producing molds, structure, health issues and incidence in Southeast Asian and Sub-Saharan African countries. Int J Environ Res Pub Health. 2020;17(4):e1215. https://doi.org/10.3390/ijerph17041215
- Nisa A, Zahra A, Hina S. Detection of Aflatoxins in rice samples. BanglaJ Sci Ind Res. 2014;49(3):189-194. https://doi.org/10.52763/PJSIR.BIOL.SCI.55.1.2012.27.29
- Rottinghaus GE. A review of TLC and HPLC methods for analysis of aflatoxins in commodities. In: Richard JL, Thurston JR, eds. Diagnosis of Mycotoxicoses. Springer Nature; 1986:239-255.
- Amir SMN, Masoud SG, Abolfazl K. Determination of aflatoxin B1 levels in Iranian and Indian spices by ELISA method. Toxin Rev. 2014;33,151-154. https://doi.org/10.3109/15569543.2014.942319
- Miller N, Pretorius HE, Trinder DW. Determination of aflatoxins in vegetable. Oils J Assoc Off Anal Chem. 1985;68(1):136-137. https://doi.org/10.1093/jaoac/68.1.136
- Iqbal SZ, Paterson RR, Bhatti A, Asi MR. Survey of aflatoxins in chillies from Pakistan produced in rural, semi-rural and urban environments. Food Addit Contam. 2010;3(4):268-274. https://doi.org/10.1080/19393210.2010.520341
- Watts BM, Yalimaki GL, Jaffery LE, Elias LG. Basic Sensory Methods for Food Evaluation. The International Development Research Centre; 1989.
- Hanne KM, Lars D, Guro K, Edvinsen E, Elvevoll O, Ida JJ. Protein determination. Foods. 2018;7(1):e5. https://doi.org/10.3390/foods7010005
- Ockerman HW, Hansen CL. Animal By-Product Processing. Weinheim: VCH; 1988.
- Maubois JL, Lorient D. Dairy proteins and soy proteins in infant foods Nitrogen to protein conversion factors. Dairy Sci Technol. 2016;96(1):15-25. https://doi.org/10.1007/s13594-015-0271-0
- Akande KE. Proximate and amino acid analyses of full fat sunflower (Helianthus annuus L.) seed meal. Singapore J Sci Res. 2011;1(2):179-183. https://scialert.net/abstract/?doi=sjsres.2011.179.183
- Mari CLM, Claudia B, Manuel VM, Jose APA, Juana FL. Properties of dietary fibers from agro-industrial coproducts as source for fiber enriched foods. Food Bioproc Technol. 2015;8:2400–2408. http://dx.doi.org/10.1007/s11947-015-1591-z
- Ravinder K, Naveen K. Isolation, characterization of wheat gluten and its regeneration properties. J Food Sci Technol. 2015;52(9):5930–5937. https://doi.org/10.1007/s13197-014-1690-2
- Samra I, Zaib H, Farkhanda G, Saeed AN, Naheeda AZ. Comparative efficiency of different methods of gluten extraction in indigenous varieties of wheat. Arch Latinoam Nutr. 2013;63(2):180-187. https://pubmed.ncbi.nlm.nih.gov/24934075/
- Ali N. Co-occurrence of citrinin and ochratoxin an in rice in Asia and its implications for human health. J Sci Food Agri. 2018;98(6):2055-2059.https://doi.org/10.1002/jsfa.8667
- Park JW, Choi SY, Hwang HJ, Kim YB. Fungal mycoflora and mycotoxins in Korean polished rice destined for humans. Int J Food Microbiol. 2005;103(3):305-314. https://doi.org/10.1016/j.ijfoodmicro.2005.02.001
- Sun XD, Hong S. Mycotoxin contamination of rice in China. Mycotoxin contamination of rice in China. J Food Sci. 2017;82(3):573-584. https://doi.org/10.1111/1750-3841.13631
- Wu G, Fuller WB, Zhaolai D, Defa L, Junjun W, Zhenlong W. Amino acid nutrition in animals, protein synthesis and beyond. Annu Rev Anim Bio Sci. 2014;2:387–417. https://doi.org/10.1146/annurev-animal-022513-114113
- Nielsen. Food Analysis Laboratory Manual. National Academic Digital Laboratory of Ethiopia; 2010.
- Delcour JA, Hoseney RC. Book review: principles of cereal science and technology. J Cereal Sci. 51, Article e415. https://doi.org/10.1016/j.jcs.2010.01.001
- Eid IB, Anas MA. Determination of citric acid in soft drinks, Juice drinks and energy drinks using titration. Int J Chem Sci. 2014;1(6):30-34. http://dx.doi.org/10.13140/2.1.1882.6886
- Magerramov MA. Density of the concentrates of peach and pomegranate juices at elevated state parameters. J Eng Phys Therm. 2006;79:811-816. https://doi.org/10.1007/s10891-006-0169-z
- Jennings PA, Mullen CA, Roy. Titration and pH measurement. Encyclopedia of Life Sciences; 2010. https://doi.org/10.1002/9780470015902.a0002700.pub2