

| Review | Open Access |
|---|
Development and Validation of a UV-Spectrophotometric Method for the Estimation of Atorvastatin in Bulk and Tablet Dosage Form |
 |
|---|
 Muhammad Aslam1* , Fahad Mushtaq1, Habib Raza2, Zahra Noreen3, Aamir Sohail1, Muhammad Aneeq Javed1, and Mehvish Abdul-Rehman1
1Department of Chemistry, University of Education, Lahore, Pakistan
2Himont Pharmaceutical, Lahore, Pakistan
3Department of Botany, University of Education, Lahore, Pakistan
A new UV-spectrophotometric method is devised that uses methanol as a solvent to precisely measure the quantity of atorvastatin present in both raw materials and pharmaceutical dosage form. It is efficient, accurate, simple, quick, and distinctive. High sensitivity and accuracy are the distinguishing features of this approach. Atorvastatin’s max was located at 247 nm. A linear relationship between the concentrations of 10-20 g ml-1 was discovered, exhibiting a high correlation coefficient. The new method’s precision, linearity, accuracy, and limit of detection (LOD) were all validated statistically. The results affirm the suitability of this method for daily analysis of atorvastatin in both its raw form and pharmaceutical formulations. Furthermore, it is noteworthy that this method avoids the need for costly solvents, extraction procedures, derivatization, and time-consuming steps. Hence, it is successfully applied to pharmaceutical formulations and validated in harmony with the standard procedures of the International Council of Harmonization (ICH).
Highlights
- A simple, rapid, and cost-effective UV-spectrophotometric method was developed for quantification of atorvastatin using methanol as solvent.
- The method showed strong linearity within 10–20 µg mL⁻¹ at 247 nm, with high sensitivity and accuracy.
- The procedure was validated according to ICH guidelines and successfully applied to bulk drug and pharmaceutical formulations for routine quality control.
1. INTRODUCTION
Chemically, atorvastatin calcium is a 7-[2-(4-fluorophenyl)-3-phenyl-4-(phenylcarbamoyl)-5-(propan-2-yl)-1H-pyrrol-1-yl]-3,5-dihydroxyheptanoate , calcium salt (2:1) trihydrate or (βR,δR)]-2-(4-fluorophenyl)-β,δ-dihydroxy-5-(1-methylethyl)-3-phenyl-4-[(phenylamino) carbonyl]-1H-pyrrole-1-heptanoic acid calcium or {[R-(R, R*)]-2-(4-flurophenyl)-β,δ-dihydroxy-5-(1-methylethyl)-3-phenyl-4-[phenylamino)carbonyl]-1H-pyrrole-1-heptanoic acid, calcium salt (2:1) trihydrate}, as shown in Figure 1. Atorvastatin is present in solid state, with chemical formula C33H35FN2O5 and molecular weight 558.64g/mole. Its solubility is much higher in organic solvents like methanol and chloroform, as compared to polar solvents like water.
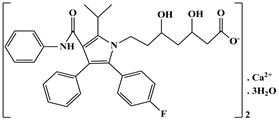
Figure 1. Chemical Structure of Atorvastatin Calcium Trihydrate
Atorvastatin is found in various commercially available medical formulations. These pharmaceutical formulations are used in the therapeutic treatment of numerous forms of hypercholesterolemia and also as an agent to lower cholesterol levels [1]. Atorvastatin is a 2nd generation 3-hydroxy-3-methylglutaryl-coenzyme A (HMG-CoA) reductase inhibitor. Sterols are formed by this enzyme via the conversion of mevalonate from HMG-CoA. The rate-limiting step in the production of cholesterol is this conversion process. A considerable reduction in entire cholesterol can be brought about by HMG-CoA reductase inhibitor along with low-density lipoprotein cholesterol (LDL-C) and plasma triglycerides [2, 3]. A number of different methods including HPLC, HPTLC [4], capillary electrophoresis [5], electrochemical [6, 7], and spectrofluorimetric [8] have been designed for the quantitative estimation of atorvastatin, either alone [9, 10] or along with other active ingredients [11, 12], in different pharmaceutical formulations. In terms of the consumption of the solvent, these reported processes are not sufficient or cost-effective. The aim of the current study is to develop an effective UV-based method to measure atorvastatin in tablet and bulk dose forms. Using methanol as the solvent, this procedure is intended to be simple, quick, accurate, economical, and dependable.
2. MATERIALS AND METHODS
2.1. Chemicals and ReagentsAll of the analytical grade chemicals, reagents, and solvents were used directly from VWR BDH Chemicals. A Halo DB-20, Dynamica, UV-VIS Double Beam Spectrophotometer with wavelength range 200 - 400 nm and having two matched 1 cm matches quartz cell was used. EF-2 Electrolab Friability Tester was used for the friability test. Pyrex - Iwaki Micropipette of variable volumes and Electric Mettler Toledo balance, model AL 204electronic balance, were used.
2.2. Sample TabletsThis study was carried out on sample tablet Atrocad (Himont Pharmaceutical) containing active ingredients including atorvastatin. Each tablet contains 10 mg atorvastatin. The tablets comprise a pale yellow, biconvex, and beveled edges film with a bisecting line on one side. The average weight of each tablet is 160 mg ± 7.5%.
2.3. Disintegration TestA total of 800 mL of distilled water was taken in 1000 mL beaker and the temperature was adjusted at 37°C. The basket assembly was washed and 06 Atrocad tablets were put in each tube with disc. Then, the disintegration test apparatus was started. When all tablets completely disintegrated, the time displayed on the screen was noted. Time span should not be more than 30 minutes.
2.4. Friability TestThe friability test was carried out on Electrolab Friability Tester (Model: EF-2). Tablets were dusted and reweighed when the machine completed 100 revolutions. Friability, as the percentage weight loss, was calculated using the following formula:

After accurately weighing 25 mg of atorvastatin calcium RS into a volumetric flask (100 mL), it was diluted with methanol and dissolved. A total of 1 mL was pipetted out from this mixture into another volumetric flask (25 mL) and the necessary amount of methanol was added to dilute it. The final concentration of the standard preparation was established at 10 g mL-1.
2.6. Selection of WavelengthThe UV spectrum’s wavelength was determined for the study of atorvastatin calcium. When atorvastatin calcium standard solution was scanned between 200 and 300 nm, the λmax was found to be 247 nm versus methanol.
2.7. Sample SolutionAtrocad pills were weighed and grounded into a fine powder. Around 160 mg of this powder, equal to 10 mg of atorvastatin, was transferred into a volumetric flask (50 mL). Then, 15 minutes of sonication was performed after adding and mixing 20 mL of methanol. The first few mL of the filtrate were discarded after filtering. Afterwards, 20 mL of methanol was added to 1 mL of the filtrate to obtain the final concentration of 10 µg mL-1.
2.8. Preparation of Working Standard SolutionA total of 160 mg of powdered sample was mixed in methanol and shaken well to dissolve and get 1000 μg mL-1 solution. To obtain atorvastatin concentrations of 10, 12, 14, 16, 18, and 20 μg mL-1, suitable aliquots of 1000 g mL-1 solution were diluted with methanol up to the mark. Then, 247 nm was used to measure the absorbance.
2.9. Amount of Atorvastatin in Each TabletUsing methanol as a blank, the absorbance of the sample and standard preparations were measured at 247 nm. The amount of atorvastatin was calculated in mg per tab by the formula given below:
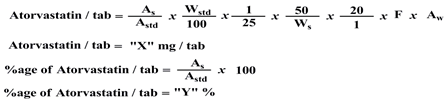
where,
Wstd = Weight of sample taken for standard preparation
Ws = Weight of sample taken for sample preparation
Astd = Absorbance of the standard preparation
As = Absorbance of the sample preparation
Aw = Average weight of tablet
F = Factor for conversion of atorvastatin calcium trihydrate to atorvastatin (0.933)
2.10. Method ValidationIn order to evaluate the linearity, precision, ruggedness, accuracy, and robustness of the analyte, the analytical process was verified in accordance with the ICH criteria for the validation of analytical procedures.
2.11. SpecificityBy monitoring the sample tablet’s UV spectrum and comparing it to the standard, the method’s specificity was evaluated. The estimation of atorvastatin was not affected by the excipient. As a result, it was determined that the tablet’s concentration was determined without excipient interference.
2.12. LinearityLinearity was assessed by evaluating the various concentrations of the atorvastatin standard solution. For atorvastatin, the concentration range by Beer-Lambert was found to be 10-20 g mL-1. The calibration curves for atorvastatin were plotted to assess the linearity of the relationship between absorbance and concentration (Figure 2 and Table 1).
Table 1. Linearity Data of Atorvastatin at 247 nm (10-20 μg mL-1)
|
SN |
Concentration (μg mL-1) |
Absorbance |
|---|---|---|
|
1 |
10 |
0.190 |
|
2 |
12 |
0.250 |
|
3 |
14 |
0.290 |
|
4 |
16 |
0.320 |
|
5 |
18 |
0.360 |
|
6 |
20 |
0.380 |
|
Mean |
0.298333333 |
|
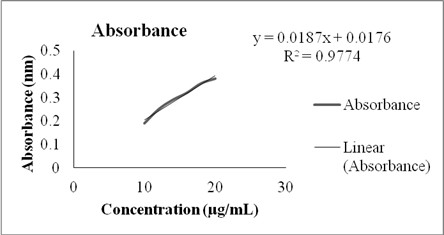
Figure 2. Calibration Curve of Atorvastatin (10-20 μg mL-1) at 247 nm
>2.13. Accuracy (Recovery %)The standard addition method was used to investigate the accuracy [13]. By making 5 sample solutions and adding a specified quantity of active medication to each sample solution, a recovery study was carried out to ensure the correctness of the method. Absorbance was evaluated at 247 nm (Table 2).
Table 2. Accuracy Study, Recovery of Atorvastatin (n=5)
|
Samples after Addition |
Concentration (μg mL-1) |
Absorbance |
Recovery (%) |
|---|---|---|---|
|
1 |
10 |
0.190 |
99.50 |
|
2 |
12 |
0.250 |
98.60 |
|
3 |
14 |
0.290 |
99.44 |
|
4 |
16 |
0.320 |
99.66 |
|
5 |
18 |
0.360 |
99.46 |
|
Mean |
- |
- |
99.30 |
|
Mean |
0.282 |
99.30 |
|
The mean of percentage recovery was calculated and found to be close to standard value. So, this method shows good accuracy.
2.14. Precision (Intraday)The analysis of 5 separate solutions having the same concentration of 10 μg mL-1 atorvastatin served as the basis for the repeatability measurement. By analyzing several atorvastatin duplicate samples, the method’s repeatability was determined. Precision was achieved using intraday variation. In the intraday variation investigation, a solution (10 μg mL-1) was determined and examined three times on the same day (that is, in the morning, afternoon, and evening, Table 3).
Table 3. Intraday Precision of Atorvastatin (10 μg mL-1, n=5)
|
Samples |
Concentration (μg mL-1) |
Absorbance |
Assay (%) |
||
|---|---|---|---|---|---|
|
Morning |
Afternoon |
Evening |
|||
|
1 |
10 |
0.220 |
0.220 |
0.221 |
98.90 |
|
2 |
10 |
0.224 |
0.225 |
0.226 |
98.90 |
|
3 |
10 |
0.240 |
0.239 |
0.240 |
99.40 |
|
4 |
10 |
0.238 |
0.240 |
0.239 |
100.0 |
|
5 |
10 |
0.260 |
0.261 |
0.259 |
100.4 |
|
Mean |
0.2364 |
0.237 |
0.237 |
99.52 |
|
The resilience of an analytical approach in the context of quantifying atorvastatin in tablets and bulk material refers to its ability to remain unaffected even when confronted to small, deliberate changes in process parameters. Sample solutions were examined at λmax+2 for this purpose. Using a narrow range of wavelengths, the assay percentage was calculated as between 98-110% (Table 4).
Table 4. Robustness Effect of Wavelength Variation (247 vs 249 nm)
|
Samples |
Concentration (μg mL-1) |
λmax (λ247) |
λmax+2 (λ249) |
||
|---|---|---|---|---|---|
|
Absorbance |
Assay (%) |
Absorbance |
Assay (%) |
||
|
1 |
10 |
0.190 |
98.50 |
0.220 |
99.50 |
|
2 |
12 |
0.250 |
99.60 |
0.240 |
99.45 |
|
3 |
14 |
0.280 |
99.60 |
0.250 |
99.60 |
|
4 |
16 |
0.340 |
99.50 |
0.320 |
99.90 |
|
5 |
18 |
0.360 |
99.30 |
0.370 |
99.40 |
|
6 |
20 |
0.410 |
100 |
0.420 |
100.4 |
|
Mean |
0.305 |
99.41 |
0.30333 |
99.70 |
|
Ruggedness was evaluated through the analysis of the sample solution on two distinct days under varied environmental conditions. Its percentage was determined in the range of 98-110%. (Table 9). The percentage assay at different days was calculated as shown in Table 5. The sample containing the drug’s active ingredient passed the toughness standards.
Table 5. Ruggedness, Inter-day Assay Variation (Day 1 vs Day 2)
|
Samples |
Concentration (μg mL-1) |
Day 1 |
Day 2 |
||
|---|---|---|---|---|---|
|
Absorbance |
Assay (%) |
Absorbance |
Assay (%) |
||
|
1 |
10 |
0.190 |
98.5 |
0.240 |
98.8 |
|
2 |
12 |
0.220 |
99.5 |
0.280 |
99.3 |
|
3 |
14 |
0.250 |
99.6 |
0.320 |
99.4 |
|
4 |
16 |
0.370 |
99.4 |
0.340 |
99.6 |
|
5 |
18 |
0.410 |
100 |
0.360 |
99.8 |
|
6 |
20 |
0.420 |
100.4 |
0.420 |
100.2 |
|
Mean |
0.31 |
99.57 |
0.32667 |
99.52 |
|
The smallest amount of analyte in a sample that can be identified but is not necessarily present in sufficient amount to provide an exact measurement is known as the limit of detection (LOD). It is expressed in terms of concentration (μg mL-1). According to ICH proposals, LOD can be computed using the following calculation:
LOD = 3.3 x N/S
where N is the standard deviation of drug measurements and S is the slope of the corresponding calibration curve. The results are enlisted below in Table 6.
Table 6. Limit of detection data for atorvastatin
|
Samples |
Concentration (μg mL-1) |
Absorbance 1st |
Absorbance 2nd |
Absorbance 3rd |
|---|---|---|---|---|
|
1 |
10 |
0.222 |
0.224 |
0.228 |
|
2 |
12 |
0.335 |
0.334 |
0.336 |
|
3 |
14 |
0.418 |
0.422 |
0.424 |
|
4 |
16 |
0.435 |
0.436 |
0.438 |
|
Mean |
0.3525 |
0.354 |
0.3565 |
|
By testing drug formulation at an interval of one hour, the stability of the established approach was confirmed. Further, it was found that there was hardly any discernible change in absorbance up to 8 hours at two different temperatures. The assay was discovered to be in the range of 98-110%. Consequently, it was determined that the suggested procedure offers a high level of stability (Table 7).
Table 7. Short-term stability at 25°C and 30°C (1-8 hours)
|
No. |
Concentration |
After 1 hour |
After 8 hours at 25oC |
After 8 hours at 30oC |
|||
|---|---|---|---|---|---|---|---|
|
Absorbance |
Assay (%) |
Absorbance |
Assay (%) |
Absorbance |
Assay (%) |
||
|
1 |
10 |
0.188 |
98.8 |
0.187 |
98.3 |
0.192 |
100.9 |
|
2 |
12 |
0.246 |
98.2 |
0.249 |
99.4 |
0.256 |
102.2 |
|
3 |
14 |
0.290 |
99.8 |
0.286 |
98.5 |
0.293 |
100.9 |
|
4 |
16 |
0.317 |
98.9 |
0.312 |
97.3 |
0.325 |
101.4 |
|
5 |
18 |
0.358 |
99.3 |
0.356 |
98.7 |
0.364 |
101.0 |
|
Mean |
|
99.0 |
|
98.44 |
|
101.28 |
|
|
SD |
0.70836274 |
||||||
|
RSD |
0.718 |
||||||
|
%RSD |
101.4 |
||||||
3. RESULTS AND DISCUSSION
3.1. Method DevelopmentThe method described in this study offers a quick and precise way to evaluate atorvastatin in tablet and bulk dose forms using UV spectrophotometry. The examination of atorvastatin was carried out on 247 nm wavelength (Figure 3) aligns with green UV spectrophotometric approaches for atorvastatin [14].
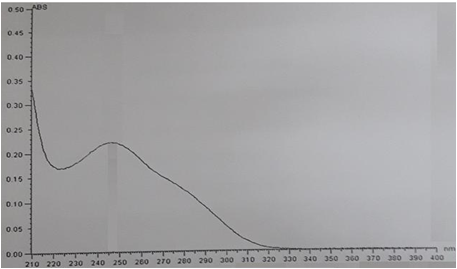
Figure 3. UV Spectrum of Atorvastatin (10 μg mL-1) showing λmax = 247 nm
The absorbance of atorvastatin was found in the range of 0.190-0.380 (Table I). The selected technique showed linearity in the concentration range of 10-20 mg mL–1. Using the appropriate absorptivity, drug concentration was calculated using this approach at 247 nm, as shown in Figure 2.
Following is a discussion of the estimation of atorvastatin in tablet dose form using multiple physical and validation parameters.
3.2. Physical Parameters3.2.1. General Appearance. The following characteristics were used to observe the appearance of a sample atorvastatin tablet, namely Atrocad (Table 8).
Table 8. Physical Characteristics of Atrocad Tablets
|
Appearance Parameters |
Tablet Atrocad |
|---|---|
|
Colour |
Pale yellow |
|
Shape |
Biconvex |
|
Coating |
Beveled edges film coated |
|
Surface texture |
Not plain |
|
Identifying mark |
Bisecting line on one side |
3.2.2. Size. The physical dimensions, proportions, or extent of an object is called its size. The size of the tablets was measured by using Vernier caliper (Table 9).
Table 9. Dimensions of Atrocad Tablets (n=5)
|
SN |
Diameter (mm) |
Thickness (mm) |
|---|---|---|
|
1 |
3.00 |
1.96 |
|
2 |
3.00 |
1.67 |
|
3 |
3.01 |
1.73 |
|
4 |
3.02 |
1.68 |
|
5 |
3.02 |
1.70 |
|
Average |
3.01 |
1.74 |
The average diameter of the tablet containing active drug atorvastatin was calculated and found to be 3.01 mm.
3.2.3. Average Weight. Weighing 10 tablets, it was found that not more than two individual weights deviated from the average weight by 7.5% and none departed more than 15% (Table 10).
Table 10. Average Weight of Atrocad Tablets (n=10)
|
Tablets |
Weight of Tablets (g) |
|---|---|
|
1 |
0.160 |
|
2 |
0.162 |
|
3 |
0.161 |
|
4 |
0.163 |
|
5 |
0.160 |
|
6 |
0.163 |
|
7 |
0.162 |
|
8 |
0.157 |
|
9 |
0.158 |
|
10 |
0.159 |
|
Total Weight |
1.60 |
|
Average Weight |
0.160 |
3.2.4. Disintegration Time. Disintegration time was calculated for sample tablets containing atorvastatin (Table 11).
Table 11. Disintegration Time of Atrocad Tablets (n=3)
|
SN |
Disintegration Time (min) |
|---|---|
|
1 |
4.00 |
|
2 |
4.00 |
|
3 |
4.00 |
|
Average |
4.00 |
3.3. Friability Test
A tablet’s strength is important to both its marketing and disintegration. By testing for friability as well as hardness, a tablet’s mechanical strength can be identified. This test measures the physical durability of uncoated tablets after being exposed to mechanical shock and attrition.
Weight of 10 tablets before friability = 165 g
Weight of 10 tablets after friability = 160 g
Percentage Loss = [(Initial wt. – Final wt.) / Initial wt.] x100
= [(165 – 160) / 160] x 100
= 2.6%
It is permitted to use conventionally compressed pills with a weight loss of no more than 5%.
3.4. Method Validation3.4.1. Specificity. The specificity of the method was checked and it was determined that the excipients did not show any interference in atorvastatin absorbance. The stability of the developed method was monitored at different intervals of time and temperature and the results were found to be within limit, that is, 98-110%. This revealed that the proposed analytical method is highly specific and stable. It also confirmed that the presence of excipients and alteration of variables such as temperature and time does not affect the results.
3.4.2. Linearity. The capacity of an analytical process to produce a result that is directly proportional to the analyte concentration in the sample within a certain range is known as linearity. It is important to establish linearity for all types of analytical procedures. The relationship between absorbance and concentration, as absorbance was increased, was found to be linear concentration at a constant rate. Calibration curve for atorvastatin showed linearity in the concentration range of 10-20 mg mL-1. The values of correlation coefficients (r2) confirmed the calibration curve’s linearity. The results were between 98-110%, as shown in Table 1 and Figure 2, comparable to recent ICH-validated UV methods [15].
3.4.3. Accuracy (Percentage Recovery). It is the degree to which the discovered value and the accepted reference value agree with each other. For accuracy measurement, the conventional addition approach was used. The percentage recoveries for atorvastatin were found to be in the range of 98.60-99.66% and the means of the percentage recovery assay were calculated as 99.30%. This is close to the atorvastatin standard value, so this method shows good accuracy (Table 2), further demonstrating that the developed method is an accurate method to determine atorvastatin. The numbers of the recovery percentage are displayed in Table 2, which demonstrates the efficacy of the suggested approach.
3.4.4. Precision. The precision of the method was determined by analyzing the drug three times in the same day and getting the same results, as shown in Table 3. As a result, the high level of precision of the proposed method was determined. The devised method was determined to be precise because the assay for the intraday precision study was found to be between 98% and 110% (Table 3).
3.4.5. Robustness. This is an analytical method that measures how unaffected it can be by modest but intentional changes in method parameters and shows how reliable it is under typical usage. Robustness was determined by carrying out the percentage assay at slightly different wavelength (λ247 andλ249). The percentage assay was found to be within limit, that is, 99.41- 99.70% (Table 4).
3.4.6. Ruggedness. Ruggedness was assessed by carrying out the assay under the same conditions on various days by various analysts, using various instruments and at various times. The results found by different instruments at different times were within limit, that is, 98-110%, as shown in Table 5.
3.4.5. LOD. It is the smallest concentration of an analyte in a sample that can be detected but is occasionally difficult to quantify. These restrictions are typically stated as percentage or part per million (ppm). The quantification limit in a specific analytical method signifies the smallest quantity of an analyte within a sample that can be accurately and precisely quantified. According to the ICH criteria, the detection limits as LOD (k = 3.3) were calculated and revealed to be 10 g mL-1 (Table 6).
3.4.6. Stability. There was essentially no discernible change in absorbance up to 8 hours at two different temperatures, which proved the stability of the created approach. The short-term stability findings (Table 7) point to a sample’s stability in the solution for 1-8 hours, that is, between the acceptable range of 98-110%. RSD was discovered to be 101.4%, demonstrating the stability of the tablet at various temperatures. Therefore, the suggested procedure offers a high level of stability.
3.5. ConclusionFor the quantification of atorvastatin, a simple, accurate, and focused spectrophotometric method is developed and validated in this study. Atorvastatin exhibits its peak absorbance at 247 nm. Moreover, it was found that the Beer-Lambert equation is valid for concentrations between 10 and 20 g mL-1. The experimental findings and discussion that followed showed that the proposed approach matches the requirements laid out by the International Council of Harmonisation (ICH) and is validated in terms of linearity, accuracy, precision, robustness, and ruggedness. Together, these results show that the suggested UV-spectrophotometric approach is easy to use, affordable, and capable of providing accuracy, precision, and sensitivity. This technique can be used to accurately determine the amount of atorvastatin present in both bulk materials and pharmaceutical formulations for quality control tests.
Author Contribution
Muhammad Aslam: conceptualization, supervision. Fahad Mushtaq: methodology, formal analysis. Habib Raza: writing-original draft. Zahra Noreen: conceptualization. Aamir Sohail: writing-original draft. Muhammad Aneeq Javed: writing-review & editing. Mehvish Abdul-Rehman: writing-original draft
Conflict of Interest
The authors of the manuscript have no financial or non-financial conflict of interest in the subject matter or materials discussed in this manuscript.
Data Availability Statement
Data supporting the findings of this study will be made available by the corresponding author upon request.
Funding Details
No funding has been received for this research.
Generative AI Disclosure Statement
The authors did not use any type of generative artificial intelligence software for this research.
Acknowledgments
Dr. Muhammad Aslam and Mr. Fahad Mushtaq express their gratitude to Mr. Habib Raza, Himont Pharmaceutical, 17-KM Ferozepur Road Lahore, Pakistan for providing research facilities.
REFERENCES
- Shitara Y, Sugiyama Y. Pharmacokinetic and pharmacodynamic alterations of 3-hydroxy-3-methylglutaryl coenzyme A (HMG-CoA) reductase inhibitors: drug-drug interactions and interindividual differences in transporter and metabolic enzyme functions. Ther. 2006;112(1):71-105. https://doi.org/10.1016/j.pharmthera.2006.03.003
- Bakker-Arkema RG, Davidson MH, Goldstein RJ, et al. Efficacy and safety of a new HMG-CoA reductase inhibitor, atorvastatin, in patients with hypertriglyceridemia. J Am Med Assoc. 1996;275(2):128-133.
- Nawrocki JW, Weiss SR, Davidson MH, et al. Reduction of LDL cholesterol by 25% to 60% in patients with primary hypercholesterolemia by atorvastatin, a new HMG-CoA reductase inhibitor. Arterioscler Thromb Vasc Biol. 1995;15(5):678-682. https://doi.org/10.1161/01.atv.15.5.678
- Jamshid A, Nateghi AR. HPTLC determination of atorvastatin in plasma. Chromatographia. 2007;65(11):763-766. https://dx.doi.org/10.1365/s10337-007-0228-4
- Al-Shehri MM. A validated capillary electrophoresis method for simultaneous determination of ezetimibe and atorvastatin in pharmaceutical formulations. Saudi Pharma J. 2012;20(2):143-148. https://doi.org/10.1016/j.jsps.2011.09.005
- Erk N. Development of electrochemical methods for determination of atorvastatin and analytical application to pharmaceutical products and spiked human plasma. Crit Rev Anal Chem. 2004;34(1):1-7. https://dx.doi.org/10.1080/10408340490273717
- Korany MA, Hewala II, Abdel-Hay KM. Determination of etofibrate, fenofibrate, and atorvastatin in pharmaceutical preparations and plasma using differential pulse polarographic and square wave voltammetric techniques. J AOAC Int. 2008;91(5):1051-1058. https://doi.org/10.1093/jaoac/91.5.1051
- Sharaf-E-Din MMK, Salama FMM, Nassar MWI, Attia KAL, Kaddah MMY. Validated spectrofluorimetric method for the determination of atorvastatin in pharmaceutical preparations. J Pharma Anal. 2012;2(3):200-205. https://doi.org/10.1016/j.jpha.2012.01.005
- Erturk S, Aktas ES, Ersoy L, Ficicioglulu S. An HPLC method for the determination of atorvastatin and its impurities in bulk drug and tablets. J Pharm Biomed Anal. 2003;33(5):1017-1023. https://doi.org/10.1016/s0731-7085(03)00408-4
- Petkovska R, Cornett C, Dimitrovska A. Development and validation of rapid resolution RP-HPLC method for simultaneous determination of AT and related compounds by use of chemometrics. Anal Lett. 2008;41(6):992-1009. https://dx.doi.org/10.1080/00032710801978566
- Rajeswari KR, Sankar GG, Rao AL, Seshagirirao JVLN. RP-HPLC method for simultaneous determination of atorvastatin and amlodipine in tablet dosage form. Indian J Pharm Sci. 2006;68(2):275-277. https://dx.doi.org/10.4103/0250-474X.25738
- Sonawane SS, Shirkhedkar AA, Fursule RA, Surana SJ. Application of UV-spectrophotometry and RP-HPLC for simultaneous determination of atorvastatin calcium and ezetimibe in pharmaceutical dosage form. Eurasian J Ana Chem. 2006;1(1):31-41. https://dx.doi.org/10.12973/ejac/77004
- Bhinge SD, Malipatil SM. Development and validation of a stability-indicating method for the simultaneous estimation of cefixime and dicloxacillin using the RP-HPLC method. J Taibah Uni Sci. 2016;10(5):734-744. https://dx.doi.org/10.1016/j.jtusci.2015.10.011
- Almutairi FM, Althobaiti YS, Abduljabbar MH, et al. A green and sustainable UV spectrophotometric approach for simultaneous determination of rosuvastatin, pravastatin, and atorvastatin in pharmaceuticals leveraging firefly algorithm-enhanced partial least squares regression. Anal Methods. 2025;17(20):2485-2494. https://doi.org/10.1039/D5AY00446B
- Kumari D, Syed SM. Precise and accurate UV spectrophotometric estimation of atorvastatin in bulk and dosage form: a validation study. Int J Pharm Sci Res. 2025;16(12):3421-3425. https://doi.org/10.13040/IJPSR.0975-8232.16(12).3421-25