

| Review | Open Access |
|---|
On Irregularity Indices for Fractal- and Cayley-Tree Type Dendrimers |
 |
|---|
Consider as a simple connected (molecular) graph, whereas, and are the sets of vertices and edges, respectively. A graph is supposed to be regular if all vertices have equal degree, otherwise irregular. The fractal- and cayley-trees are irregular acyclic and connected graphs which are widely used to develop signal amplifiers for biosensors, cellular imaging and genetic engineering. The topological index (TI) serves as a mathematical function for determining numerical values of molecular graphs, aiding in the prediction of diverse physical, chemical, biological, thermodynamic, and structural properties. An irregular index, a specific type of TI, quantifies the irregularity of atomic bonding within chemical compounds represented by the graphs under analysis. This study focuses on calculating the irregularity indices for fractal dendrimers and Cayley tree-type dendrimers. A comparative analysis of the obtained indices is conducted using their numerical values and 3D visualizations. Lastly, the most efficient and consistent irregularity indices for fractal- and Cayley-tree dendrimers are identified and discussed.
1. INTRODUCTION
Graph theory is an evolving field that has become a central part of mathematics, playing a foundational role across multiple disciplines, including computer science, operations research, social networks, map colouring, chemical engineering, game theory, and mathematical chemistry. Specifically, chemical graph theory focuses on analyzing the physical and chemical properties, along with the structural characteristics, of chemical compounds. These properties include a variety of factors like temperature, heat of formation, weight, point of stability, freezing point, melting point, boiling point, solubility, heat formation, heat evaporation, and surface tension. By analyzing these characteristics, researchers can gain valuable insights into the behavior and composition of different compounds. For this purpose, while various mathematical tools and models are used in chemical graph theory, topological indices are most familiar [1].
Wiener [2] used a distance-based TI for the paraffins boiling point. [3] defined the novel indices for determining the total π-electron energy of alternant hydrocarbons. If all vertices in a graph have an identical degree, the graph is referred to as regular and vice versa. Irregularity indices are TIs that help us to characterize irregular graphs with various properties. [4] discussed graph irregularity indices as molecular descriptors of QSPR studies. [5] calculated irregularity indices for complex biomolecular networks. Bell [6] defined different novel properties for irregularity of graphs. Gutman [7] determined and discussed the Irregularity of quasi perfect molecular graphs. Majcher et al. [8] discussed highly irregular graphs with an extreme number of edges. Liu et al. [9] calculated maximally irregular triangle free graphs and size of maximally irregular graphs. [10-12] investigated the change of the total irregularity of graphs under various subdivision operations.
Zahid et al. [13] analyzed irregularity measures of particular nanotubes, as observed by Gao et al. [14] calculated irregularity of indices of some molecular graphs of various classes of dendrimers. Imbalance-based irregularity indices of boron nanotubes were computationally analyzed [15]. Dimitrov et al. [16] discussed graphs with equal irregularity indices. The irregularity of indices has been concentrated as of late in a novel manner [9, 17]. The irregularity of such as , irregularity index and is imported as in the previous study presented by Albertson [18]. Other indices handled the concept of imbalance of an edge discussed [19].
Gutman et al. [20] gave new idea of the irregularity index for graphs. Imran et al. [21] worked on fractal- and cayley-tree type dendrimers and calculated various irregularity indices for these graphs. Manimaran utilized edge partition method to investigate Sombor variants for tree Graph, Fractal-, and Cayley-Tree Type Dendrimers [22]. Hamanakaet al. [23] assessed non-Hermitian skin effect on the cayley tree through multifractal statistics. Pannipitiya investigated a dynamical approach to the Potts model on cayley tree [24]. FDEs attracted significant consideration due to their ability to model composite phenomena, such as visco-elastic materials [25], economics [26], continuum and statistical mechanics [27].
Fractal dendrimer is denoted by F_q and constructed from F_(q-1) by performing some steps at first to make a way of three connections with two same end nodes. After that, r new nodes are made for every one of the two center nodes of F_(q-1) and then they are attached to the center nodes. Cayley tree dendrimer is denoted by C_(p,q) and obtained from C_(p,q-1) by performing p-1 and vertices are generated and attached to the boundary vertices.
The following study unfolds as under: Section 2 covers preliminary information. Section 3 covers irregularity indices for fractal-trees, while Section 4 explores irregularity indices for cayley trees. The paper concludes in Section 5.
2. PRELIMINARIES
Suppose G=(V(G),E(G)) is a simple connected graph, where V(G) & E(G) are sets of vertices & edges, respectively. Whereas, the total number of edges adjacent to any vertex n_i is called degree of the vertex, which is denoted as d(n_i ). A graph is considered connected if there is always a path connecting every pair of vertices within the graph. Connected and acyclic graph is called a tree. In tree the vertices that have d(v)≥3 is the branching point. A tree-graph is chemical tree has Δ(G)=4. Any graph is supposed to be a regular graph if all of its vertices have a similar degree. The majority of Irregularity indices are from the family of degree based topological lists and are utilized in quantitative structure action relationship demonstrating.
Table 1. Irregularity Indices
|
Irregularity Indices |
Mathematical Demonstration |
Reference |
|---|---|---|
|
imballuv |
|d u - d v | |
[21] |
|
AL(G) |
 |
[22] |
|
IRL(G)
|
 |
[22] |
| IRR_t (G) |  |
[11] |
| IRF(G) |  |
[20] |
| IRA(G) |  |
[4] |
| IRDIF(G) |  |
[4] |
| IRLF(G) |  |
[4] |
|
LA(G) |
 |
[4] |
| IRLF(G) |  |
[4] |
|
IRD1(G) |
 |
[4] |
| IRGA(G) |  |
[4] |
| IRLU(G) |  |
[4] |
| IRB(G) |  |
[4] |
3. IRREGULARITY INDICES FOR FRACTAL-TREE DENDRIMERS
The term fractal is derived from Latin signifying "to break", and graph designs in that each littler piece of the structure is like as entirety. There are numerous instances of fractal dendrimers, such as broccoli, sierpinski triangle, lotus white flower, von koch curve, , ferns etc. This work explores the proposed fractal-tree dendrimers for F_q where q≥0 is the repetition if q=0 then F_0 only an edge connecting two exact nodes. F_q is borrowed from F_(q-1) while performing three operations in every edge of F_(q-1).
- Step 1 to make a way of three connections with two same end nodes.
- Step 2 to make new nodes for every one of the two center nodes.
- Step 3 attached all new nodes to the center nodes.
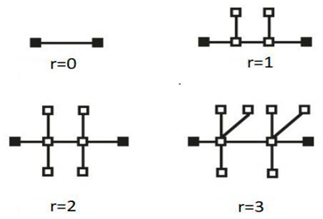
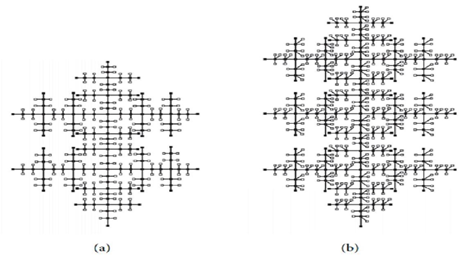
Figure 2. Fractal-tree Dendrimer (a)F3 andr=2 and (b)F4andr=3
Table 2. Separation of Edge Set of Fractal-Tree Dendrimer Based on Degrees of End Vertices


Table 3. Irregularity Indices Related to Theorem 1
| (r,q) |
IRL(G) |
IRR(G) |
IRRRt (G) |
IRF(G) |
IRD1 |
IRB(G) |
|---|---|---|---|---|---|---|
| (1,1) |
24.2737 |
48 |
24 |
88 |
27.5174 |
11.2923 |
| (1,2) |
93.8510 |
188 |
94 |
340 |
108.4478 |
43.3129 |
| (1,3) |
163.42 |
328 |
164 |
592 |
189.3782 |
75.33 |
| (1,4) |
232.99 |
468 |
234 |
844 |
270.3086 |
107.34 |
| (1,5) |
302.58 |
608 |
304 |
1096 |
351.23 |
139.36 |
| (1,6) |
372.15 |
748 |
374 |
1348 |
432.16 |
171.38 |
| (1,7) |
441.7380 |
888 |
444 |
1600 |
513.09 |
203.4 |
| (1,8) |
511.3 |
1028 |
514 |
1852 |
594.02 |
235.43 |
| (1,9) |
580.89 |
1168 |
584 |
2104 |
674.96 |
267.45 |
| (1,10) |
650.46 |
1308 |
654 |
2356 |
755.88 |
299.47 |
| (1,11) |
720.04 |
1448 |
724 |
2608 |
836.81 |
331.49 |
| (1,12) |
789.61 |
1588 |
794 |
2860 |
897.74 |
363.51 |
| (1,13) |
859.19 |
1784 |
864 |
3112 |
998.67 |
395.53 |
| (1,14) |
928.77 |
1868 |
934 |
3364 |
1079.61 |
427.55 |
| (1,15) |
998.35 |
2008 |
1004 |
3661 |
1160.53 |
459.57 |
| (1,16) |
1067.92 |
2148 |
1074 |
3868 |
1241.46 |
491.59 |
| (1,17) |
11137.5 |
2288 |
1144 |
4120 |
1322.39 |
523.61 |
| (1,18) |
1229.85 |
2428 |
1214 |
4372 |
1403.33 |
555.63 |
| (1,19) |
1276.66 |
2568 |
1284 |
4624 |
1484.26 |
587.65 |
| (1,20) |
1346.23 |
2708 |
1354 |
4876 |
1565.18 |
619.68 |

Figure 3. Comparison of the Irregularity Indices indicated with distinct colors
IRR(G)by red color ,IRL(G)by green color,IRR_t (G)by blue color, IRF(G)by yellow color,IRD1(G)by dark green color and IRB(G) by Plum Color
Among these indices IRR(G) is a more dominant irregularity index for fractal-tree dendrimers.


Table 4. Irregularity Indices Related to Theorem 2.
| (r,q) |
IRLU(G) |
IRLU(G) |
IRA(G) |
IRDIF(G) |
IRLF(G) |
IRGA(G) |
LA(G) |
|---|---|---|---|---|---|---|---|
| (1,1) |
42.66 |
42 |
3.7162 |
16 |
14 |
7.82 |
26.85 |
| (1,2) |
164 |
161 |
14.22 |
62.67 |
17.89 |
30.72 |
106.85 |
| (1,3) |
285.33 |
280 |
24.72 |
109.34 |
93.34 |
53.61 |
185.85 |
| (1,4) |
406.66 |
399 |
35.2342 |
156 |
133 |
76.5 |
266.85 |
| (1,5) |
528 |
518 |
45.74 |
202.66 |
259 |
99.4 |
346.85 |
| (1,6) |
649.33 |
637 |
56.2463 |
249.33 |
212.33 |
122.3 |
426.85 |
| (1,7) |
770.66 |
756 |
66.7523 |
296 |
252 |
145.2 |
506.85 |
| (1,8) |
892 |
875 |
77.2583 |
342.66 |
191.66 |
168.1 |
586.85 |
| (1,9) |
1013.33 |
994 |
87.7643 |
389.33 |
331.33 |
191 |
666.85 |
| (1,10) |
1134.66 |
1113 |
98.27 |
436 |
371 |
213.9 |
746.85 |
| (1,11) |
1256 |
1232 |
108.7763 |
482.66 |
410.66 |
236.8 |
826.85 |
| (1,12) |
1377.33 |
1351 |
119.2824 |
529.33 |
450.33 |
259.7 |
906.85 |
| (1,13) |
1498.66 |
1470 |
129.7884 |
576 |
490 |
282.6 |
986.85 |
| (1,14) |
1620 |
1589 |
140.2944 |
622.66 |
529.66 |
305.5 |
1066.85 |
| (1,15) |
1741.33 |
1809 |
150.8 |
669.33 |
569.33 |
328.4 |
1146.85 |
| (1,16) |
1862.66 |
1827 |
161.3064 |
716 |
609 |
351.3 |
1226.85 |
| (1,17) |
1984 |
1946 |
171.8124 |
762.66 |
648.66 |
374.2 |
1306.85 |
| (1,18) |
2105.33 |
2065 |
182.3184 |
809.33 |
688.33 |
397.1 |
1386.85 |
| (1,19) |
2226.66 |
2184 |
192.8244 |
856 |
728 |
420 |
1466.85 |
| (1,20) |
2348 |
2303 |
203.33 |
902.66 |
767.66 |
442.9 |
1546.85 |

Figure 4. Comparison of the Irregularity Indices, i.e., Represented by IRLU(G),IRLU(G),IRA(G),IRDIF(G),LA(G), IRGA(G),IRLF(G) Presented by Red, Green, Blue, Yellow, Cyan, Maroon & Purple Colors, Respectively
Among these indices IRLU(G) is more dominant irregularity index for fractal-trees dendrimers.
4. IRREGULARITY INDICES FOR CAYLEY'S TREE DENDRIMERS
The Cayley tree is a type of dendrimers, which is also known as Bethe lattice Let C_(p,q) (p≥3,q≥0)represents the Cayley tree dendrimers after t iterations. Initially (q=0),C_(p,0) consists of central vertex only to form C_(p,1) we creates p vertices and attach them to middle vertex. For >1,C_(p,q) is obtained from C_(p,q-1) by performing p-1 vertices are generated and attached to the boundary vertices.
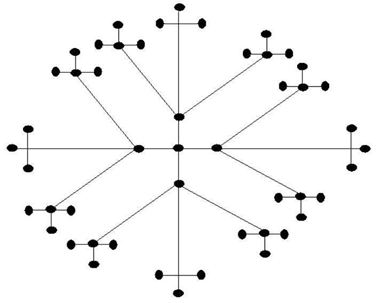
Figure 5. Cayley Tree Dendrimer C_4,3
Table 5. Sepration of Edge Set of Cayley's Tree Dendrimer Based on degrees of End Vertices


Table 6. Irregularity Indices Related to Theorem 3
| (p,q) |
IRR(G) |
IRRR_t (G) |
IRL(G) |
IRF(G) |
IRD1 |
IRB(G) |
|---|---|---|---|---|---|---|
| (4,1) |
12 |
6 |
5.5451 |
36 |
49.9 |
36 |
| (4,2) |
36 |
18 |
16.6355 |
108 |
149.71 |
108 |
| (4,3) |
108 |
54 |
49.9 |
324 |
449.15 |
324 |
| (4,4) |
324 |
162 |
149.71 |
972 |
1347.47 |
972 |
| (4,5) |
972 |
486 |
449.15 |
2916 |
4042.434357 |
2916 |
| (4,6) |
2916 |
1458 |
1347.47 |
8748 |
12127.30307 |
8748 |
| (4,7) |
8748 |
4374 |
4042.42 |
26244 |
36381.90921 |
26244 |
| (4,8) |
26244 |
13122 |
12127.3 |
78732 |
109145.7276 |
78732 |
| (4,9) |
78732 |
39366 |
36381.9 |
236196 |
327437.1829 |
236196 |
| (4,10) |
236196 |
118098 |
109145.72 |
708588 |
982311.5488 |
708588 |
| (4,11) |
708588 |
354294 |
327437.18 |
2125764 |
2646934.646 |
2125764 |
| (4,12) |
21225764 |
1062882 |
982311.54 |
6377292 |
8840803.939 |
6377292 |
| (4,13) |
6377292 |
3186146 |
2946934064 |
19131876 |
26522411.82 |
19131876 |
| (4,14) |
19131876 |
95655938 |
8840803.93 |
573956228 |
79567235.45 |
573956228 |
| (4,15) |
57395628 |
28697814 |
79567235.45 |
172186884 |
238701706.3 |
172186884 |
| (4,16) |
172186884 |
86093442 |
26522411.82 |
516560652 |
716105119 |
516560652 |
| (4,17) |
515160652 |
258280326 |
238701706 |
1549681956 |
2148315357 |
1549681956 |
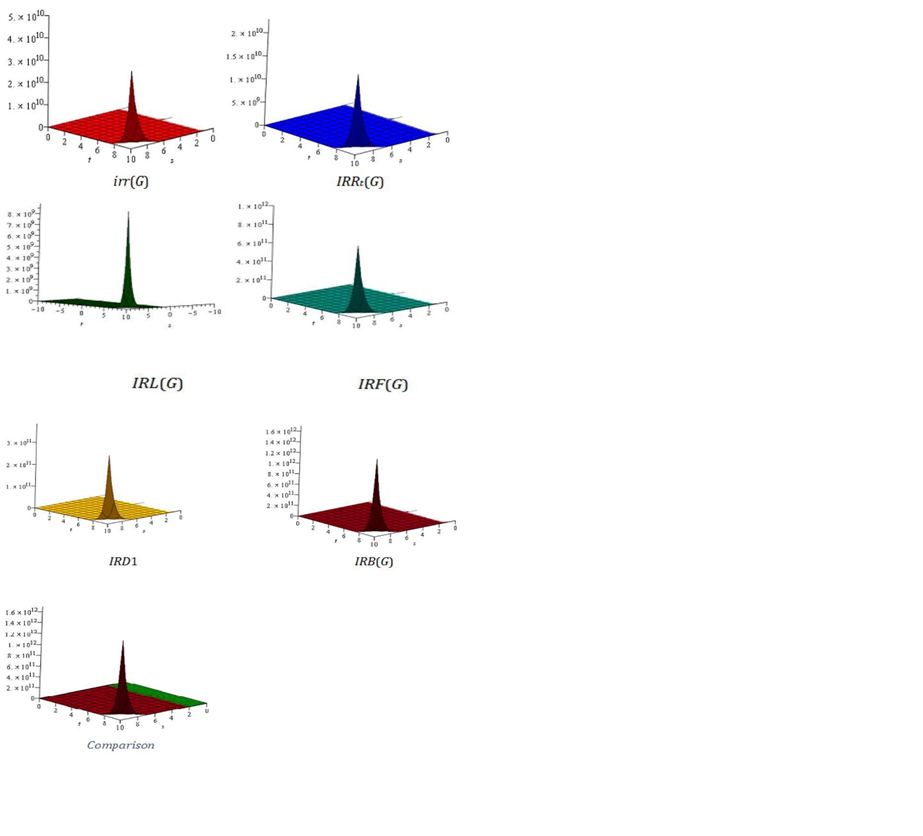
Figure 6.Comparison of the Irregularity Indices, i.e., IRR(G),IRR_t (G),IRL(G),IRF(G),IRD1(G),IRB(G) are Indicated as Red, Green, Blue, Teal, Yellow and Plum Colours Respectively.
Among these indices IRD1(G) is more dominant irregularity index for Cayley tree dendrimers.


Table 7. Irregularity Indices Related to Theorem 4
| (p,q) |
IRLU(G) |
IRA(G) |
IRDIF(G) |
LA(G) |
IRLF(G) |
IRGA(G) |
|---|---|---|---|---|---|---|
| (4,1) |
12 |
9 |
27 |
43.2 |
27 |
8.0331 |
| (4,2) |
36 |
27 |
81 |
129.6 |
81 |
24.0995 |
| (4,3) |
108 |
81 |
243 |
288.8 |
243 |
72.2985 |
| (4,4) |
324 |
243 |
729 |
1166.4 |
729 |
216.8955 |
| (4,5) |
972 |
729 |
2187 |
3499.2 |
2187 |
650.6865 |
| (4,6) |
2916 |
2187 |
6561 |
10497.6 |
6561 |
1952.059 |
| (4,7) |
8748 |
6561 |
19683 |
31492.8 |
19683 |
5856.173 |
| (4,8) |
26244 |
19683 |
59049 |
94478.4 |
59049 |
17568.538 |
| (4,9) |
78732 |
59049 |
177147 |
283435.2 |
177147 |
52705.6142 |
| (4,10) |
236196 |
177147 |
531441 |
850305.6 |
531441 |
158116.8424 |
| (4,11) |
708588 |
531441 |
1594323 |
2550916.8 |
1594323 |
1423051.585 |
| (4,12) |
2125764 |
1594323 |
4782969 |
7652750.4 |
4782969 |
4269154.754 |
| (4,13) |
6377292 |
4782969 |
14348907 |
22958251.2 |
14348907 |
12807464.26 |
| (4,14) |
19131876 |
14348907 |
43046721 |
68874753.6 |
43046721 |
38422392.29 |
| (4,15) |
57395628 |
43046721 |
129140162 |
206624260.8 |
129140162 |
115267178.4 |
| (4,16) |
172186884 |
129140162 |
387420489 |
619872782.4 |
387420489 |
345801535.1 |
| (4,17) |
515160652 |
387420489 |
387420489 |
1859618347 |
387420489 |
1037404605 |
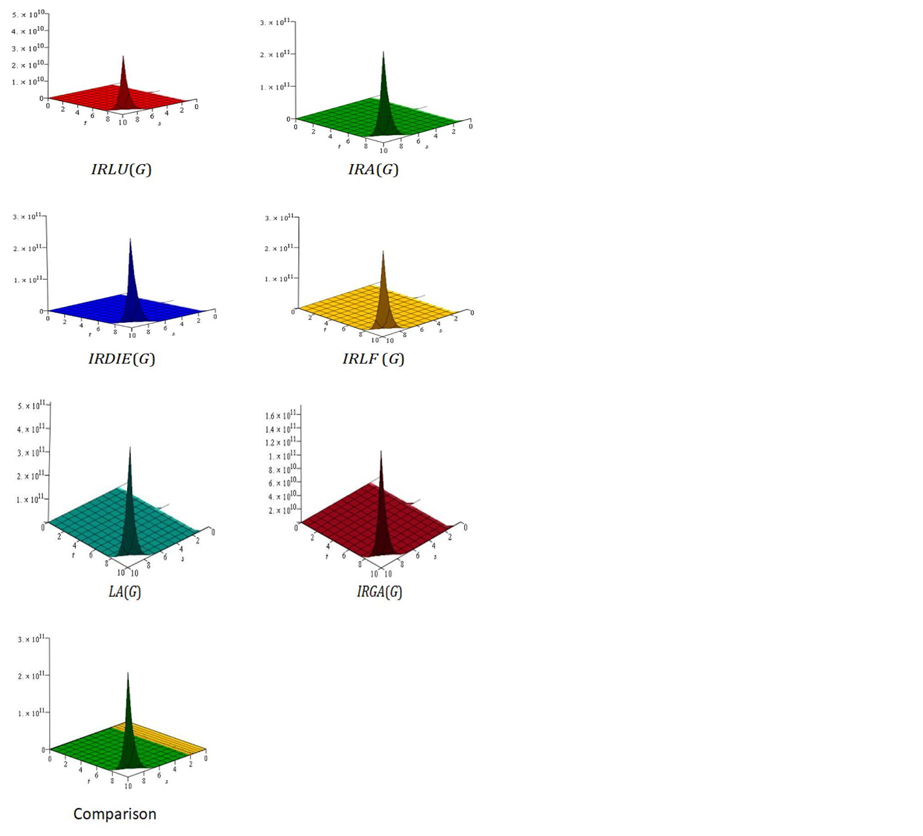
Figure 7. Comparison of the Irregularity Indices, i.e., IRLU(G),IRDIF(G),IRA(G),LA(G),IRLF(G),IRGA(G) are indicated as Red, Green, Blue, Yellow, Cyan and Maroon Colours
Among these indices LA(G) is a more dominant irregularity index for Cayley tree dendrimers.
5. CONCLUSION
Dendrimers grow in patterns similar to trees or fractals found in nature. This repeating, organized structure allows scientists to control their shape very precisely. As a result, these molecules are very useful for targeted drug delivery, designing new nanomaterials, and speeding up chemical reactions. Their branching architecture also makes them efficient, flexible, and easy to adapt for advanced chemical and biomedical applications. In conclusion, various irregularity indices for fractal- and Cayley-tree dendrimers are determined. The results are presented through tables containing numerical values and figures showcasing graphical representations. Our analysis revealed that IRD1 is the most dominant and consistent index among the fractal- and Cayley-tree dendrimers.
CONFLICT OF INTEREST
The authors of the manuscript have no financial or non-financial conflict of interest in the subject matter or materials discussed in this manuscript.
DATA AVAILABILITY STATEMENT
The data is freely-available and the reference paper is cited in data analysis section.
FUNDING DETAILS
No funding was received for this research.
REFERENCES
- Basak SC, Magnuson VR, Niemi GJ, Regal RR, Veith GD. Topological indices: their nature, mutual relatedness and applications. Math Model. 1987;8(1):5-300. https://doi.org/10.1016/0270-0255(87)90594-X
- Wiener Structural determination of paraffin boiling points. J Am Chem Soc. 1947;69(1):17-20. https://doi.org/10.1021/ja01193a005
- Gutman I, Trinajstić N. Graph theory and molecular orbitals. Total π-electron energy of alternant hydrocarbons. Chem Phys Lett. 1972;17(4):528-535. https://doi.org/10.1016/0009-2614(72)85099-1
- Réti T, Sharafdini R, Dregelyi-Kiss A, Haghbin H. Graph irregularity indices used as molecular descriptors in QSPR studies. MATCH Commun Math Comput Chem. 2018;79:24-509.
- Estrada Randic index, irregularity and complex biomolecular networks. Acta Chim Slov. 2010;57:597-603.
- Bell A note on the irregularity of graphs. Linear Algebra Appl. 1992;161:45-54. https://doi.org/10.1016/0024-3795(92)90004-T
- Gutman Irregularity of molecular graphs. Kragujev J Sci. 2016;38:71-78.
- Majcher Z, Michael J. Highly irregular graphs with extreme numbers of edges. Discret Math. 1997;164:237-242. https://doi.org/10.1016/S0012-365X(96)00056-8
- Liu F, Zhang Z, Meng J. The size of maximally irregular graphs and maximally irregular triangle-free graphs. Graphs Comb. 2014;30:699-705. https://doi.org/10.1007/s00373-013-1304-1
- Abdo H, Brandt S, Dimitrov D. The total irregularity of a graph. Discrete Math Theor Comput Sci. 2014;16:201-206. https://doi.org/10.46298/dmtcs.1263
- Abdo H, Dimitrov D. The total irregularity of graphs under graph operations. Miskolc Math Notes. 2014;15:3-17. https://doi.org/10.18514/MMN.2014.593
- Abdo H, Dimitrov D. The irregularity of graphs under graph operations. Discuss Math Graph Theory. 2014;34(2):263-278. https://doi.org/10.7151/dmgt.1733
- Iqbal Z, Aslam A, Ishaq M, Aamir M. Characteristic study of irregularity measures of some nanotubes. Canad J Phy. 2019;97(10):1125-1132. https://doi.org/10.1139/cjp-2018-0619
- Gao W, Aamir M, Iqbal Z, Ishaq M, Aslam A. On irregularity measures of some dendrimer structures. 2019;7(3):e271. https://doi.org/10.3390/math7030271
- Yang B, Munir M, Rafique S, Ahmad H, Liu JB. Computational analysis of imbalance-based irregularity indices of boron nanotubes. Processes. 2019;7(10):e678. https://doi.org/10.3390/pr7100678
- Dimitrov D, Rti T. Graphs with equal irregularity indices. Acta Polytech Hung. 2014;11(4):41-57.
- Horoldagva B, Buyantogtokh L, Dorjsembe S, Gutman I. Maximum size of maximally irregular graphs. MATCH Commun Math Comput Chem. 2016;76(1):81-98.
- Albertson The irregularity of a graph. Ars Combin. 1997;46(1):219-225.
- Vukićević D, Graovac A. Valence connectivity versus Randić, Zagreb and modified Zagreb index: a linear algorithm to check discriminative properties of indices in acyclic molecular graphs. Croat Chem Acta. 2004;77(3):501-508.
- Gutman Topological indices and irregularity measures. J Bull. 2018;8:469-475. https://doi.org/10.7251/BIMVI1803469G
- Imran M, Baig AQ, Khalid W. On topological indices of fractal and cayley tree type dendrimers. Discrete Dynam Nat Soc. 2018;2018(1):e2684984. https://doi.org/10.1155/2018/2684984
- Manimaran Topological analysis of fractal binary and ternary trees. Contemp Math. 2025;6(1):715-729. https://doi.org/10.37256/cm.6120255952
- Hamanaka S, Iliasov AA, Neupert T, Bzdušek T, Yoshida T. Multifractal statistics of non-Hermitian skin effect on the Cayley tree. Phys Rev B. 2025;111(7):e075162. https://doi.org/10.1103/PhysRevB.111.075162
- Pannipitiya A Dynamical Approach to The Potts Model on Cayley Tree. Dissertation. Purdue University; 2024.
- Bagley RL, Torvik PJ. Fractional calculus in the transient analysis of viscoelastically damped structures. AIAA J. 1985;23(6):918-925. https://doi.org/10.2514/3.9007
- Baillie Long memory processes and fractional integration in econometrics. J Econom. 1996;73(1):5-59. https://doi.org/10.1016/0304-4076(95)01732-1
- Talib I, Belgacem FBM, Asif NA, Khalil H. On mixed derivatives type high dimensional multi-term fractional partial differential equations approximate solutions. AIP Conf Proc. 2017;1798(1):e020024. https://doi.org/10.1063/1.4972616