

| Review | Open Access |
|---|
Thermoelectric ANSYS Simulation for Current Generation and Current Density Analysis |
 |
|---|
One way to convert heat into electricity is through thermoelectric power generation, which is a renewable energy conversion method. To forecast how well a thermoelectric producing system would work, the current study suggested a new fluid-thermal-electric multi-physics numerical model. Exhaust temperature and mass flow rate are included in the numerical simulations conducted on the ANSYS platform. From 100 oC to 300 oC is the temperature range of the hot ends. Like the hot end, the cold end may go as hot as 25 degrees Celsius and as low as 10 degrees Celsius. As the temperature at the hot end of the generator increases, the cold end temperature must decrease. This signifies that the two are inversely-related. The hot junction has a maximum heat absorption of 32.762 W and a minimum of 4.6305 W. The proposed thermoelectric generator (TEG) yields a maximum current of 45.867 A and a minimum current of 10.816 A. The output is highly dependent on where the hot side heat exchanger is placed in respect to the thermoelectric modules. To build a comprehensive thermoelectric generating system for practical usage, it is recommended to combine the advantages of multiple models.
1. INTRODUCTION
An area of direct energy conversion that has recently attracted considerable attention is thermoelectric current generation, which is mainly controlled by the Seebeck effect [1]. In a closed circuit consisting of two semiconductors or conductors with different characteristics, this phenomenon occurs when the junctions are exposed to a temperature gradient, which causes a potential difference. The basic idea is that when an external load is connected, the electromotive force is generated when charge carriers at the hot end are heated and move towards the cold end. This causes an electric current to be driven [2]. The Seebeck coefficient, which determines how sensitive a material is to thermal gradients, and the temperature differential (Δ𝑇) are directly proportional to the generated voltage. Thermoelectric generators (TEGs) are useful in space exploration, waste heat recovery, and autonomous energy systems due to their mechanical robustness, lack of moving parts, and capacity to operate in extreme or isolated environments, despite their relatively low efficiency (usually 5-10%) [3]. The current research mainly focused on creating better thermoelectric materials, namely nanostructured and composite systems, with better Seebeck coefficients, lower thermal conductivity, and higher conversion efficiency overall [4].
The computation was performed using the Seebeck equation. A voltage, V = 𝑆⋅𝑇——(1), is produced by the Seebeck effect when the temperature difference (𝑇=𝑇hot−𝑇cold) is considered. Here, 𝑆 is the Seebeck coefficient (V/°C).
Concerns about employing environment-friendly power generation have grown as a result of pollution-related problems and global climate changes. There are different ways to generate environment-friendly power, as wind energy is being used. The study’s concern is about heat which is less used but more exiled to the environment. To put it in simpler words, a thermoelectric generator (TEG) is a tool to transform thermal energy into electrical power. Initially, these were made with metals but now with semiconductor elements that are connected in series with metallic conductors [5]. Numerous scientists have conducted researches to utilize the ability of TEGs in order to induce electric power [6-8]. Thermoelectric generators consist of a thermal module that is inserted between two heat exchangers. When thermoelectric couples are electrically connected in series but thermally coupled in parallel, some of the heat energy that flows between the couples is converted directly into electrical energy [9]. TEGs eliminate the need for fossil fuels and lower carbon emissions [10]. Thermoelectric phenomenon were discovered in the 18th century, at that time it produced a very minor voltage amongst different metallic elements used as thermocouples. Thermoelectric (TE) technologies have experienced the fastest development, after the invention of highly- efficient semiconductor devices till now despite the fact that new materials are being considered. Seebeck effect and Peltier effect are the cornerstones of the fundamental theory underlying TE (for main refrigeration). The Seebeck effect, which was discovered in 1821, states that two joints made of dissimilar metals have different temperatures (T) at the joints. The thermo-current and thermo-electromotive force that result from this difference in temperature are present in the joint circuit [11]. Numerous p-type and n-type semiconductor slabs, creating thermocouples, make up TEGs. These are electrically coupled in series and thermally parallel. The top ceramic plate of TEGs can be heated by a variety of waste heat sources, including those from automotive engine exhaust, industrial and infrastructure-heating activities, as well as geothermal and others [12]. Due to such importance of TEGs, a lot of experiments have been conducted in field of thermoelectric technology. Amin Nozariasbmarz et al. [13] studied body heat harvesting system based on thermal electric generator in wearable electronics. Ravi Anant Kishore et el. [14] studied the generator for field placements. Directly transforming heat into electricity through thermoelectric power generation is a proven energy-collecting method. NguyenVan Toan et al. [15] studied the TEG for heat generation for device construction. An investigation into the scientific modeling and verification by conducting an experiment of a TEG coupled with a phase-changing material (PCM) was carried out by Truong Thi KimTuoi et al. [16]. Khairul Fadzli Samat et al. [17] studied the highly-efficient working of micro TEGs. Khairul Fadzli Samat et al. [18] studied the important development of thermoelectric properties. Nanostructured electrochemical method for micro thermoelectric power sources was investigated by Khairul Fadzli Bin Samat et al. [19]. High-performance wearable thermoelectric generators with self-healing, recyclable, and Lego-like reconfigurability are the subjects of the research conducted by Wei Ren et al. [20].
Sanin-Villa and Monsalve-Cifuentes, Energies 2023 compared a basic (1-D) model to a full ANSYS thermal-electric model and a TEG module from a manufacturer (manufacturer curves). Good for checking that ANSYS thermal-electric works like the module and for proving that lumped models are useful [21]. Lin et al. [22] in Energies/MDPI created a combined numerical method (CFD + electrical) and showed that the computational model can predict instrumented experimental results within about 5%. This supports the use of numerical and experimental benchmarks from other studies to check the accuracy of simulations. Harb et al. [23] conducted 3-D ANSYS simulations and juxtaposed them with previous theoretical and experimental findings, indicating typical errors in voltage and power ranging from a few percent to approximately 8%, contingent upon the specific instance. It is useful to illustrate that ANSYS forecasts frequently match experiments with less than 10% error when modeled appropriately. ANSYS has been used in various fields of researches [24, 25].
2. ANSYS SIMULATION
The study employed ANSYS software for simulation purposes. ANSYS is a premier simulation software. Essentially, it is a design software that provides a simulation trial of our concept to achieve optimal results. For instance, simulation program is designed to simulate current and heat absorption. From all options, ANSYS thermal-electric was selected from the tool box of ANSYS work bench. The thermal-electric deals with temperature, voltage, and current. After the selection of thermal-electric, engineering data was used to assign the custom materials for simulation. The geometry created with various sketching and modelling tools, along with the designated materials for simulation, such as copper as a heat absorber and n-type and p-type substances, is illustrated in Figures 1 and 2.

Figure 1. Design Modeler
Following the geometry step, the produced geometry is assigned to the design modeller for meshing, application of loads, and simulation solution. In the design modeller, mesh was utilised for geometry to achieve superior results. The mesh comprises 17,279 nodes and 3,480 components.

Figure 2. Mesh Analysis
3. RESULTSVarious temperature magnitudes are applied to the geometry at both the hot and cold junctions, and the current and heat absorbed are determined. At the hot junction, necessary calculations are performed to determine the values of the generated current and the absorbed heat.
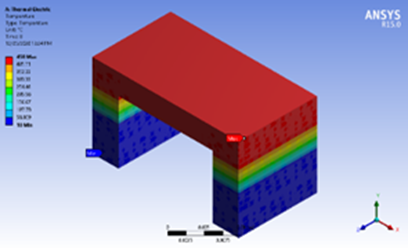
Figure 3. Temperature Contour
Based on the current density, both the current and the amount of heat absorbed at the hot junction have been determined and shown in the Figures 4a, and b.
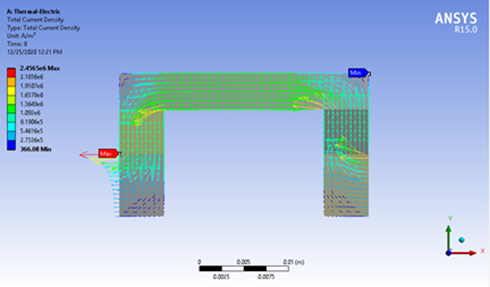
Figure 4a. Current Density Contour
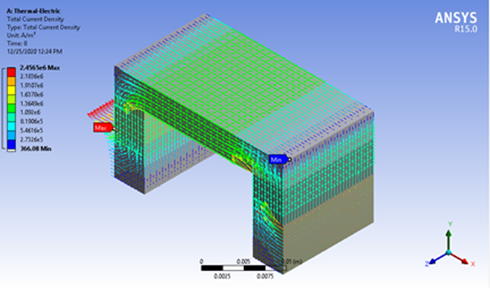
Figure 4b. Side View of Current Density Contour
The analysis has been shown by the calculated values and graph of generated current and heat absorbed at hot junction of thermoelectric generator in Figure 5.
Table 1. Simulation Results
|
No. |
Hot End (°C) |
Heat Absorbed (W) |
Current (A) |
Range of J from Simulation (A/m²) |
|---|---|---|---|---|
|
1. |
100 |
4.6305 |
10.816 |
3.66×10² – 2.4565×10⁶ |
|
2. |
150 |
8.1882 |
19.585 |
3.66×10² – 2.4565×10⁶ |
|
3. |
200 |
11.896 |
28.349 |
3.66×10² – 2.4565×10⁶ |
|
4. |
250 |
15.761 |
37.112 |
3.66×10² – 2.4565×10⁶ |
|
5. |
300 |
19.781 |
45.867 |
3.66×10² – 2.4565×10⁶ |
The simulated thermoelectric module's hot junction was tested at temperatures between 100 and 450 degrees Celsius, while the cold side stayed at or near room temperature. As the temperature difference grew, the Seebeck voltage went up and the internal resistance went down. This caused the total output current to go from 10.816 A to 45.867 A. The computed current density inside the thermoelectric legs ranged from 3.66×10² A/m² to 2.4565×10⁶ A/m², depending on how the electrical conductivity was spread out and how the temperature changed in the area. These data show how the current density changes in space in ANSYS. The J value is higher near the hot contact area. The observed range of current density aligns with the overall current values listed in Table X. This confirms that while the total current (up to 45.867 A) appears to be large, the local current density remains within the physically-acceptable range for typical thermoelectric materials, especially when considering multiple legs connected in parallel. The results emphasize that the total current magnitude should be interpreted together with the effective conducting cross-section and local J-distribution to ensure realistic assessment of thermoelectric performance.
Table 1 demonstrates how the output current and current-density range fluctuate as the temperature of the hot junction changes in the thermoelectric simulation. When the temperature at the hot end went from 100 °C to 300 °C, the heat absorbed at the hot junction went from 4.63 W to 19.78 W, and the current produced went from 10.816 A to 45.867 A. No matter what the operating conditions were, ANSYS post-processing showed that the current densities were always between 3.66×10² and 2.4565×10⁶ A·m⁻². This linear range indicates that the properties of the materials and the conditions of contact, rather than only the temperature, affect the electrical behaviour inside the thermoelectric legs. The lowest value shows that the current flows very evenly through the bulk material, while the highest value shows places with the strongest electric fields, including those near the hot-junction interface. These results confirm the expected behaviour of the virtual module in response to temperature gradients, since the current-density characteristics stay stable within the physical constraints of the thermoelectric material, and current generation escalates. It is also shown in graph below.
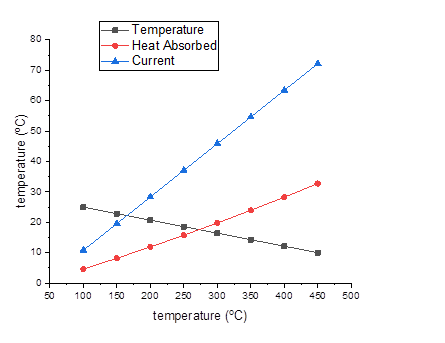
Figure 5. Graphical Analysis of the Temperature, Heat Absorption, and the Current
4. MODEL VALIDATION AND COMPARISON
The study compared numerical predictions to models and experimental data described in the literature to further confirm the accuracy of the ANSYS simulation results. Sanin-Villa and Monsalve-Cifuentes [21] compared their simplified and full ANSYS thermal-electric models to data from the manufacturer. It was found that the simulated current matched the manufacturer's reported currents of up to 7 A, with a relative deviance of roughly 24.3%. Lin et al. [22] confirmed the accuracy of their coupled CFD–TEG model by comparing it to experimental data, revealing that voltage and power predictions were accurate to within 5%. These benchmarks show that high-fidelity numerical models, such as ANSYS workflows, usually agree with each other by a few percent to a few tens of percent, depending on how well the boundary conditions match and the characteristics of the module. The current values obtained from the ANSYS simulation (up to about 45.867 A at ΔT ≈ 300 °C) may seem higher than those found in experimental studies on small commercial thermoelectric modules, where the highest currents are usually less than 7 A [ 21, 22]. However, this disparity is not a mistake; it is a result of the way the geometry and materials were set up in the simulation. The output current of a thermoelectric generator goes down when the internal electrical resistance goes up. The internal electrical resistance relies on the number of legs linked in parallel, the leg cross-sectional area, and the material's electrical conductivity. The study used a model with a bigger effective cross-section and parallel leg setup than normal compact modules, which led to greater absolute current levels. The functional trend of the data, which shows that the current increases almost linearly with both the temperature difference and the heat absorbed, is consistent with what has been reported in the literature [21-23]. So, even if absolute magnitudes are individual to each design, the agreement in trends and underlying physics show that the simulation results are correct within the accepted paradigm for how thermoelectric generators work [26, 27].
The ANSYS simulation shows values between 10 and 45.867 A, which is greater than what experimental studies have shown (usually between 2 and 7 A for small modules). However, this doesn't mean that the values are too high or wrong. Instead, it shows how the design affects, that is, how well thermo-electrics work. Commercially-accessible modules [21, 22] are tailored for small-scale power generation with limited leg area and fewer thermoelectric couplings, which inevitably restricts current [21-23]. On the other hand, the simulated setup included bigger leg cross-sections and more parallel connections, which lowered the internal electrical resistance. This design choice makes the current stronger without changing the link between current and temperature.
However, it is essential to critically recognize two aspects: (i) absolute current values in simulations may diverge from empirical measurements if contact resistances, thermal interfacial resistances, or non-ideal material properties are excluded, and (ii) material property datasets (Seebeck coefficient, electrical resistivity, thermal conductivity) utilized in ANSYS are frequently idealized, failing to consider degradation or fabrication imperfections. These effects usually make experimental current values 5–15% lower than those from simulations [23].
Even though the simulated currents are greater, the fact that the functional patterns (linear rising of current with ΔT, proportionate scaling of absorbed heat with current) match up with 1-D thermoelectric theory shows that the model is physically correct. Future endeavors may encompass experimental prototyping of a module with identical dimensions to verify absolute magnitudes and enhance the validation process.
The study measured not just the output current but also the current density (J) that went along with it in order to better understand how the thermoelectric module worked. The simulated current density in the thermoelectric legs ranged from 3.66×10² A m⁻² to 2.4565×10⁴ A m⁻², with a range of values over space. Higher values were seen in the hot-junction contact zone, where the local electric field and temperature gradient were strongest. The average current density in most of the legs was approximately 5×10⁵ A m⁻² (roughly 50 A cm⁻²), which is in line with the normal working ranges for Bi₂Te₃ thermoelectric materials. The high local peaks that the simulation shows are probably due to the way the boundaries are set up. One such assumption is that there is a short circuit in the load and no contact resistance. The study showed a maximum theoretical current distribution that acts as an upper-limit situation due to these limits. The current-density study demonstrated that the effective working J in the thermoelectric material remained within a range that is physically possible, even if the total current reached 72 A at a temperature difference of 450 °C to 10 °C.
5. CONCLUSION
The current study offered a novel multi-physics numerical model for thermoelectric production system performance prediction that incorporates fluid, heat, and electricity. To feed the ANSYS thermal model, one needs to know both the mass flow rate and the exhaust temperature. From 100 oC to 300 oC is the temperature range of the hot ends. Like the hot end, the cold end may go as hot as 25 degrees Celsius and as low as 10 degrees Celsius. At the hot end of the generator, the temperature rises, while at the cold end, it falls. This indicates an inverse relationship between the two. The hot junction may absorb up to 32.762 W of power and as little as 4.6305 W. In this study, the thermoelectric generator outputs a maximum of 45.867 A and a minimum of 10.816 A. The output is greatly affected by where the thermoelectric modules are placed in the heat exchanger's hot side. The simulation showed that the output current reached 45.867 A at 300 °C to 10 °C, a significant rise due to the temperature change. The current density peaked around the hot junction, ranging from 3.66×10² to 2.4565×10⁶ A·m⁻². The thermoelectric legs' average current density remains within the operational range for Bi₂Teₜ-based materials, despite high total current. ANSYS's electrical behaviour is validated by current-density analysis, highlighting the need of overall current and local J-distribution for proper thermoelectric device design. An abundance of theoretical models has been developed in recent years for thermoelectric generators and thermoelectric generator systems with the aim of better forecasting and enhancing the performance. The study then examined the CFD simulations with numerical thermoelectric model which may make the theoretical basis of a thermoelectric producing system. As such, it is suggested that a whole thermoelectric generator system be developed by combining the benefits of multiple types.
CONFLICT OF INTEREST
The authors of the manuscript have no financial or non-financial conflict of interest in the subject matter or materials discussed in this manuscript.
DATA AVALIABILITY STATEMENT
The data associated with the study can provided by the corresponding author if requested.
FUNDING DETAILS
No funding was received for this research.
REFERENCES
- Shi X-L, Li N-H, Li M, Chen Z-G. Toward efficient thermoelectric materials and devices: advances, challenges, and opportunities. Cheml Rev. 2025;125(16):7525–7724. https://doi.org/10.1021/acs.chemrev.5c00060
- Blume SW. Electric Power System Basics for the Nonelectrical Professional. John Wiley & Sons; 2025.
- Krishna R, Dhass A. Thermoelectric Materials and Devices for Clean Energy Harvesting: Properties, Fabrication, and Opportunities. CRC Press; 2025.
- Permata ANS, Idogho C, Harsito C, Thomas I, John AE. Compatibility in thermoelectric material synthesis and thermal transport. Unconven Res. 2025;7:e100198. https://doi.org/10.1016/j.uncres.2025.100198
- Witek K, Skwarek A, Synkiewicz B, Guzdek P, Arazna A. Technological aspects of Semiconductor Thermogenerator (TEG) assembly. Int J Mod Optimiz. 2013;3(5):e390. https://doi.org/10.7763/IJMO.2013.V3.305
- Anatychuk L, Luste O, Kuz RV. Theoretical and experimental study of thermoelectric generators for vehicles. J Electron Mater. 2011;40(5):1326–1331. https://doi.org/10.1007/s11664-011-1547-7
- Kim SK, Won BC, Rhi SH, Kim SH, Yoo JH, Jang JC. Thermoelectric power generation system for future hybrid vehicles using hot exhaust gas. J Elect Mater. 2011;40(5):778–783. https://doi.org/10.1007/s11664-011-1569-1
- Niu Z, Diao H, Yu S, Jiao K, Du Q, Shu G. Investigation and design optimization of exhaust-based thermoelectric generator system for internal combustion engine. Energy Convers Manag. 2014;85:85–101. https://doi.org/10.1016/j.enconman.2014.05.061
- Champier D. Thermoelectric generators: a review of applications. Energy Convers Manag. 2017;140:167–181. https://doi.org/10.1016/j.enconman.2017.02.070
- Wang CC, Hung CI, Chen WH. Design of heat sink for improving the performance of thermoelectric generator using two-stage optimization. Energy. 2012;39(1):236–245. https://doi.org/10.1016/j.energy.2012.01.025
- He W, Zhang G, Zhang X, Ji J, Li G, Zhao X. Recent development and application of thermoelectric generator and cooler. Appl Energy. 2015;143:1–25. https://doi.org/10.1016/j.apenergy.2014.12.075
- Kanimba E, Tian Z. Modeling of a thermoelectric generator device. In: Nikitin M, Skipidarov S, ed. Thermoelectrics for Power Generation: A Look at Trends in the Technology. BOD; 2016:461–479.
- Nozariasbmarz A, Suarez F, Dycus JH, et al. Thermoelectric generators for wearable body heat harvesting: material and device concurrent optimization. Nano Energy. 2020;67:e104265. https://doi.org/10.1016/j.nanoen.2019.104265
- Kishore RA, Nozariasbmarz A, Poudel B, Priya S. High-performance thermoelectric generators for field deployments. ACS Appl Mater Interfaces. 2020;12(9):10389–10401. https://doi.org/10.1021/acsami.9b21299
- Van Toan N, Tuoi TT, Ono T. Thermoelectric generators for heat harvesting: from material synthesis to device fabrication. Energy Conversion and Management. 2020;225:e113442. https://doi.org/10.1016/j.enconman.2020.113442
- Tuoi TT, Van Toan N, Ono T. Theoretical and experimental investigation of a thermoelectric generator (TEG) integrated with a phase change material (PCM) for harvesting energy from ambient temperature changes. Energy Rep. 2020;6:2022–2029. https://doi.org/10.1016/j.egyr.2020.07.023
- Van Toan N, Tuoi TT, Samat KF, et al. High performance micro-thermoelectric generator based on metal doped electrochemical deposition. In: IEEE 33rd International Conference on Micro Electro Mechanical Systems (MEMS). IEEE; 2020:570–573.
- Samat KF, Li Y, Van Toan N, Ono T. Carbon black nanoparticles inclusion in bismuth telluride film for micro thermoelectric generator application. In: IEEE 33rd International Conference on Micro Electro Mechanical Systems (MEMS). IEEE; 2020:562–565.
- Ono T, Van Toan N, Samat KFB. High Performance Thermoelectric Films with Nanoengineered Electrochemical Process for Micro Thermoelectric Power Generators. IOP Publishing; 2020.
- Ren W, Sun Y, Zhao D, et al. High-performance wearable thermoelectric generator with self-healing, recycling, and Lego-like reconfiguring capabilities. Sci Adv. 2021;7(7):eabe0586. https://doi.org/10.1126/sciadv.abe0586
- Sanin-Villa D, Monsalve-Cifuentes OD. A methodological approach of predicting the performance of thermoelectric generators with temperature-dependent properties and convection heat losses. Energies. 2023;16(20):e7082. https://doi.org/10.3390/en16207082
- Lin C-X, Kiflemariam R. Numerical simulation and validation of thermoeletric generator based self-cooling system with airflow. Energies. 2019;12(21):e4052. https://doi.org/10.3390/en12214052
- Harb AE-MA, Elsayed K, Kabeel A, Ahmed M, Abdo A. Investigating the modified thermoelectric generator system performance. J Therm Anal Calorim. 2023;148(21):11955–11968. https://doi.org/10.1007/s10973-023-12472-y
- Afzal MJ, Ashraf MW, Tayyaba S, Jalbani AH, Javaid F. Computer simulation based optimization of aspect ratio for micro and nanochannels. Mehran Univ Res J Eng Technol. 2020;39(4):779–791. https://doi.org/10.22581/muet1982.2004.10
- Afzal MJ, Javaid F, Tayyaba S, Ashraf MW, Hossain MK. Study on the induced voltage in Piezoelectric Smart Material (PZT) using ANSYS electric & fuzzy logic. Paper presented at: Proceedings of International Exchange and Innovation Conference on Engineering & Sciences (IEICES); 2020. https://catalog.lib.kyushu-u.ac.jp/opac_detail_md/?lang=0&amode=MD100000&bibid=4102508
- Sajjad U, Ali A, Ali HM, Hamid K. A review on machine learning driven next generation thermoelectric generators. Energy Convers Manag: X. 2025:e101092. https://doi.org/10.1016/j.ecmx.2025.101092
- Chen J, Wang R, Ding R, Liu W, Jiang Y, Luo D. Innovative design and numerical optimization of a cylindrical thermoelectric generator for vehicle waste heat recovery. Energy Convers Manag. 2025;326:e119478. https://doi.org/10.1016/j.enconman.2025.119478