Bushra Naz1*, Shahzad hyder2, Azlan Ahmed3, Lata Kumari4, Ali Hasnain1
1Department of Computer Systems Engineering, Mehran University of Engineering and Technology, Jamshoro, Pakistan
2Nanjing University of Science and Technology, China
3Department of Telecommunications, FET Sindh University, Pakistan
4Department of Environment Engineering, Mehran University of Engineering and Technology, Jamshoro, Pakistan
* Corresponding Author: [email protected]
Water plays an important role in physiological processes, such as the body's thermal equilibrium, the transfer of nutrients to the intended destination through the body, and the lubrication of joints. In Pakistan, the existing water availability is about 79%. Inadequate and adequate drinking water quality is a significant public health concern. In the project, we explain different machine learning techniques which are used to locate exact bacteria in a water sample, their shape, and scale. This technology promises sufficient identification and division. This invention allows for early identification of bacterial water pollution, requires minimal labor, etc. A robotic frame will speed up the treatment period without human power. It will reduce water emissions dramatically. The methods available for bacterial detection are effective but require lengthy waiting periods for results and expensive and laborious equipment. Via images with PYTHON (Its libraries), this research aims to detect bacteria utilizing images. This system tends to be effective and efficient way for water quality monitoring in different sectors in Pakistan. E.g., Wastewater treatment plants, Power plants, Industries, RO plants, and Laboratories.
INDEX TERMS bacteria detection, machine learning
Water is the life requirement of humanity. Water plays an important role in physiological processes, such as the body's thermal equilibrium, the transfer of nutrients to the intended destination through the body, and the lubrication of joints [1]. The water used must therefore be clean and contain no microorganisms which cause disease. The drinking and use of the water standard (2005) by Turkish Standards Institute TS 266 stipulates the consistency standards water shall meet. Microbiological parameters are one of the most relevant conditions that can be considered in water [2].
Water, and all other life, are an essential source of humanity. From living animals to plants and all the rest. Any of these bacteria are toxic to human health anywhere in our world. Many bacteria, such as bacteria, can be contained in the water bodies (such as Escherichia coli, Vibrio, and salmonella). These appear to cause sickness or inflammation of animals such as renal failure, typhoid fever. Cholera, Diarrhea. The identification of waterborne microbes thus plays a major role in regulating water quality and sanitation, thus reducing the risks of contaminating sources of water [3].
The bacterium Escherichia coli is one of the diseases in the water. E Coli is also one of the species of bacteria in living organisms' large intestines. But water contamination is caused by live-animal faces which can survive 4-12 weeks in water according to ambient conditions [4].
In light of the causes of infections, E. coli bacteria are of immense value to deter epidemics and reduce mortality quickly and effectively. A broad range of methods for detecting E. coli bacteria has been developed. The process of bacterial detection usually requires the use of agar media [5] since agar is ideal for micro-organisms growth and provides components for metabolic activities by micro-organisms. The formation, separation, detection, counting, and susceptibility tests of microorganisms, as well as clinical monitoring, food, water, and environmental controls, are the key objectives of this culture of growth. Studies are often conceived in which bacteria, such as manganese added zinc, are marked with radiant chemicals, or analysed under a microscope [6].
Pakistan is a country with an abundance of land and water resources. However, due to industrialization, urbanization, and population growth, water has become an increasingly important commodity. Water is essential to our way of life and development. In every aspect of our lives, it has an essential role [7]. Drinking water can often contain impurities from a variety of sources, including physical, biological, and chemical contamination. However, advances in water treatment technology have made it possible to remove many of these impurities, making drinking water much safer. The most harmful impurity is biochemical, which induces or causes mortality. Several impurities are transferred from place to place in nutrients and microorganisms. Water leakage happens as microorganisms or hazardous substances are either in contact with water bodies or are emitted or released into groundwater or freshwater supplies from domestic and industrial waste. Animal and human fecal contamination reveal that coli type bacteria are present. Bacterial development and dispersion are high in the rainy season due to runoff of rivers, lakes, and streams in water bodies. Poor water-borne diseases propagate by facilities for treatment. In Pakistan, drinking water and drainage facilities run parallel, causing leaks, and mixing to contribute to water quality deterioration [8].
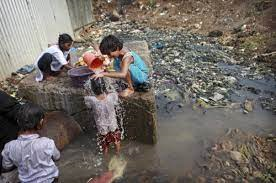
FIGURE 1. Water pollution in Pakistan
According to a recent report, the primary source of water in most Pakistani cities is groundwater, which unfortunately includes many pathogenic agents like viruses, bacteria, and protozoa. These agents cause 2.5 million deaths from endemic diarrhea every year, making it a very serious issue in the country [9].
Water contamination is a physical phenomenon that takes place due to anthropogenic activity in different water supplies like wetlands, groundwater, and waterways. The use of low water quality indices and spreads waterborne diseases. Around 50% of diseases and 40% of deaths are recorded in Community health research in Pakistan due to poor drinking quality. Around 80% of residents in Khyber Pakhtunkhwa province (KPK) use safe drinking water from surface and soil sources. Surface water in KP is clear and potable, but groundwater in the south is blackish in colour. In deepness, too, clean water is sought. However, with the aid of routine wells, excessive groundwater supply at KP is pumped out. Water supplies are primarily surface water and springs in the north of KP. The consistency and quantity of the drinking water are very limited as water and the old sewage systems are not well treated in urban areas [10].
For millennia people have stored and distributed water. Before, river water for drinking water was being used while people lived as collectors. When people lived for a long time in a single location, it was generally next to the river or lake[11][12]. Where there were no rivers or lakes in a city, groundwater was used for drinking water. This has been pumped up by wells [13]. The water availability was no longer adequate as the human population began increasing considerably. Drinking water from a separate source had to be extracted.
Jericho collected water some 7000 years ago in wells that were used as sources. People have already begun to develop water transport networks for drinking water. Transportation was achieved through clear channels excavated in rocks or the sand. One has used hollow tubes afterward. Hollow palm trees were used in Egypt and bamboo staunches were used by China and Japan. Finally, one began to use clay, wood, and copper. People in Persia were searching for rivers and lakes underground. The water went into the wells of the plateau by troughs in rocks.
The town of Mohenjo-Daro used a large water source around 3000 BC. Public bathrooms with water boiler facilities and baths were provided in this area. Water and rainwater are used very early in ancient Greece in the season. With the exponential growth of the urban population, Greece was compelled by a distribution network to store water in water wells and transport the water to residents. The water used was transported along with rainwater into the sewers. The water was pushed through hills under pressure as valleys were entered. The Greek was one of the first people to become involved in water safety. The drinking water was purified using aeration basins [14].
The Romans were the best water delivery network builders and constructors in history. They were providing canals, springs, or groundwater. The Romans constructed river dams that created reservoirs. The water from the lake was aerated and delivered. Because of its consistency, mountain water was the most common kind. The aqueducts were designed for water transport. Water was carried about ten miles across these aqueducts. Pluming of brick, rock, brass, iron, wood, or plumb in the city was carried out. Water benefits were safeguarded against foreign toxins.
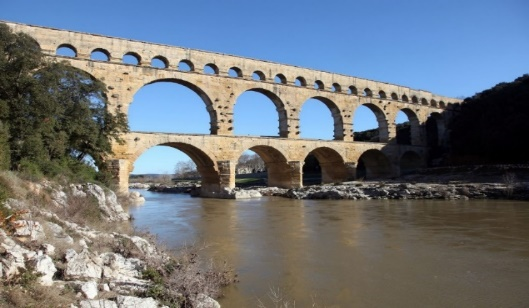
FIGURE 2. Roman aqueduct
The aqueducts were not seen any more following the collapse of the Roman Empire. Few creations took place in the treatment area between 500 and 1500 AD. Numerous settlements have been manifested in the Middle Ages. Wood plumbing has been used in these cities. Water from ponds, mines, or outside the region has been drained. Soon, the conditions were extremely hygienically dumped into the water as wastes and excrements. People who drink water became ill and died frequently. People began to drink water from outside of the city to fix this crisis, with rivers unpolluted. The so-called water bearers took this water into the city [14].
John Gibb established in Paisley, Scotland the first water source for a whole city, in 1804, to supply water for his bleaching factory and the rest of the area. Filtered water was carried to Glasgow in three years. A major water treatment plant was built in Paris in 1806. 12 hours before the filtering, the water-cooled. Sand and charcoal were used for filters and replaced all six hours. James Simpson, an Englishman, designed sand filters in 1827 for purging drinking water. Today's public health salute remains the number one [15].
The methods available for bacterial detection are effective but require lengthy waiting periods for results and expensive and laborious equipment. Via images with PYTHON (Its libraries), this research aims to detect bacteria utilizing images.
It is a kind of bacterium that typically lives in the bowels. It is also present in certain animals' intestines. E. coli are generally harmless and also contribute to maintaining a healthy digestive tract. However, if you eat polluted food or drink water from freshwater, certain strains can cause diarrhea [13].
As much of us use E. coli to connect food poisoning, pneumonia and urinary tract infection may also result from multiple forms of bacteria. E. coli is causing 75% to 95% of urinary tract infections. E. coli is a regular bowel resident, so she passes into the urinary tract.
Some E. coli versions leave you sick with the toxin Shiga. The poison destroys the bowel lining. You can get sick from a particularly weak strain, O157:H7. Abdominal cramps, vomiting, and bloody diarrhea are caused. This is the major cause of children's acute kidney failure. It can even trigger life-threatening signs like:
In a week stable people with E. coli generally feel fine. However, some people have a grave problem called hemolytic uremic syndrome which affects the kidneys. Older persons and children are more likely to do so [13].
Salmonella is the most prevalent food-related cause in the United States of the type of bacterium. It can't be used, scented, or tasted. These bacteria's disease is formally known as salmonella disease. This can lead to an upset of the abdomen, diarrhea, fever, and pain. In 4 to 7 days, most people will get better themselves at home [14][15].
Salmonella is a very common infection, especially when it comes to food poisoning. In fact, it is the most popular infection when people discuss food poisoning. Every year, around the world, tens of millions of cases are registered. You must go to the doctor in acute circumstances. It will rarely threaten people with life. Summer infections are more prevalent than winter infections. This is because salmonella grows fast when food is not refrigerated at higher temperatures [14].
In their intestines and feces, people and animals may bear salmonella. Sometimes, the bacteria spread via contaminated foods. Raw and undercooked meat, including chicken, turkey, duck, beef, and pork are common food sources of salmonella infection.
This is the first step in the process of completing this project. First of all, we have to extract the dataset and import it into the Python environment. As we have two types of datasets (Escherichia Coli and Salmonella). We will load them separately. After the successful importing of datasets, we are ready to proceed with the next step.
Image acquisition in the processing of images may be generally described as retrieval from any source, normally a hardware source, such that any subsequent processes can be passed along.
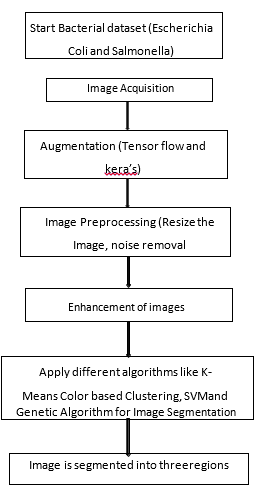
FIGURE 3. Project methodology
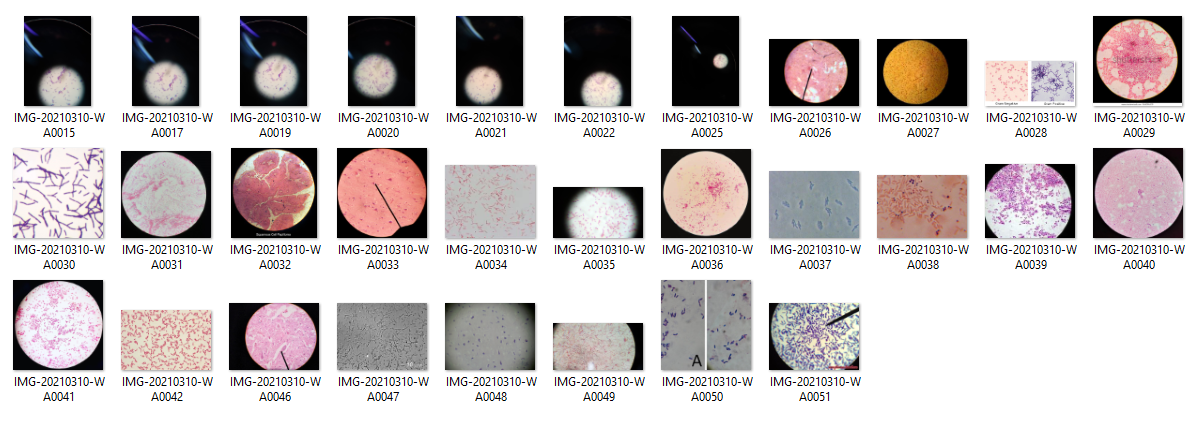
FIGURE 4. Escherichia Coli and Salmonella
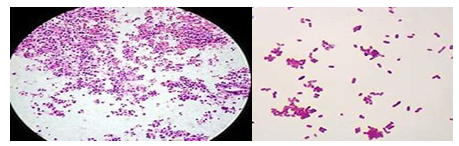
FIGURE 5. Image acquiring
The first step in the image processing workflow series is typically image acquisition, as no processing can be done without the image. The picture obtained is unprocessed and is a product of some hardware that was used to produce it, which in certain fields can be very necessary for a consistent basis. One of the ultimate objectives is to obtain an input source that functions under such regulated and calculated guidelines that the same picture is almost completely reproducible, where possible, under the same conditions such that anomalous variables can be easily found and eliminated [8][16].
In the second step, we will augment the given image by using the tensor flow and Kera. Image data increase is a process that can be used to artificially increase the size of a dataset by generating modified image versions in the dataset. Rainy-deep neural-network-based learning models on more data can lead to better results, and the increased technologies will generate image variations that will enhance the suit model's capacity for generalizing what new pictures have learned. In Keras' deep neural network research library, image data increase through Image Data Generator class will suit models [9][17].
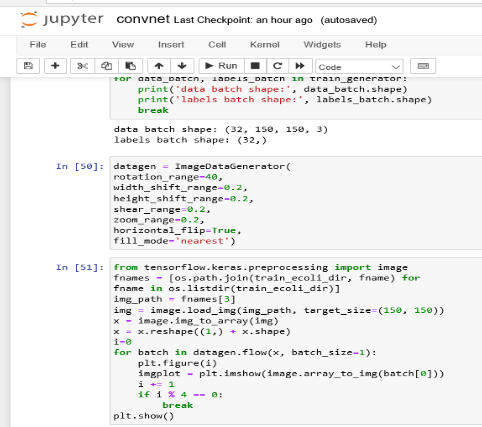
FIGURE 6. Image augmentation
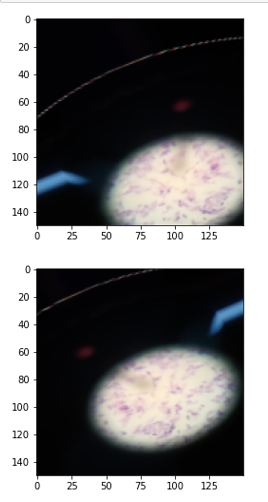
FIGURE 7. Image augmentation 1
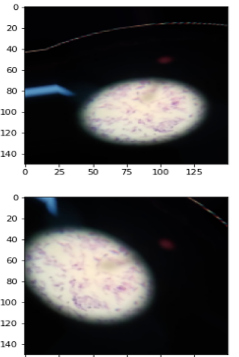
FIGURE 8. Image augmentation 2
After an image is taken, the next step is processing it to retrieve any valuable information from it. Image Processing is a method used to carry out various operations on an image to improve it. It is a form of signal processing in which the input is an image, and the output can be image or image features. The processing of photographs today is one of the fast-growing technologies. It also forms a central area of study in engineering and informatics.
Enhancing images is the way to improve accuracy and content before retrieval of original files. Contrast improvement, spatial filtering, and density slicing are standard practices.
After the image enhancement, we will be applying different algorithms to the image like K-Means Color-based Clustering, SVM, and Genetic Algorithm for Image Segmentation.
Segmenting images is the act of splitting a digital image into many segments (sets of pixels, also known as image objects). Segmentation attempts to make a representation of an image smoother and/or easier to analyse in something more significant. Segmentation of images is usually used for image location of features and borders. More specifically, image segmentation is the process of dividing an image into multiple parts, or segments. Each pixel in an image is assigned a label, and pixels with the same label share similar features [10][18].
Extraction of features is a method of dimensional reduction that reduces an initial collection of raw data to more controlled processing classes. A feature of these massive data sets is a large number of variables requiring intensive use of computational resources
Extracting GLCM Grey Level Co-occurrence Matrices features from images can help to calculate things like contrast, correlation, energy, entropy, and homogeneity. In addition, extracting bacterial types and symptoms and calculating the GLCM texture feature values of standard deviation, homogeneity, contrast, smoothness, correlation, kurtosis, energy, entropy, mean, variance, RMS, and IDM can be very helpful in understanding a sample.
Finally, we will apply the machine learning methods to the selected and processed image to get the final result as shown in the following figure. In this step, we will Apply CNN’s, RCNN’s, fast RCNN’s and RPN’s for classification and types of bacterial detection display results with a higher percentage.
Horak et al (2015) deal with a water quality assessment using an image processing method. Their suggested method for measurement of the water quality uses two well-known biological organisms sensitive to water toxicity. Their names are Daphnia magna and Lemna minor and they are frequently used for a water analysis from an ecotoxicology point of view. They suggested the method for water quality measurement, by designing an autonomous camera-based inspection. In our design, these two organisms are continuously scanned in separated vessels by two cameras and acquired images are then processed autonomously. There are employed methods of a colour-space transformation and analysis and a motion analysis in an image processing stage [11].
Ahmed et al [9] study, we used computer clusters to speed up the feature-extraction process, which enables us to analyse the contribution of different scatter-based features to the overall classification accuracy. A set of 1000 scatter patterns representing ten different bacterial strains was used. Zernike and Chebyshev moments as well as Haralick texture features were computed from the available light-scatter patterns. The most promising features were first selected using Fisher's discriminant analysis, and subsequently a support-vector-machine classifier with a linear kernel was used. The use of distributed computing for scatter-pattern analysis, feature extraction, and selection provides a feasible mechanism for large-scale deployment of a light scatter-based approach to bacterial classification [12].
They brought up the method to identify bacteria automatically. They designed a system as a hardware that contained a microscope, a digital camera, electric system and three step motors. The stage of the microscope was reconstructed and was connected with three step motors out of which two of them were plane motors and one remaining motor was for up and down for this to move three dimensionally in order to see the different regions of the slide. The digital camera was attached at the microscope eye piece for it to visualize the image or for capturing the image. The electric system performs three functions: communicating with PC software, reporting current status of the workstation, driving the step motors, recording the current position information. The slide was stained and diluted at first for the bacteria to be visualize at the microscope, the camera at ocular of the microscope captured the image. They further analysed the image by its colour and after filtering the image with two filters where threshold changes were made. The bacteria were identified by the filter. After that a new method connected to domain was applied in which white pixels were labelled and shape was analysed if the shape is right it was labelled as bacterium .
In Pakistan, the existing water availability is about 79%. Inadequate and inadequate drinking water quality is a significant public health concern. The introduction into water bodies of radioactive products from urban and industrial environments, without any care, damages the consistency of the water and creates harmful effects for people. Water and sanitation agencies in Pakistan focused on water quantity, rather than water quality, because of the growing requirements. This is all due to insufficient knowledge, technology for treatments, facilities, qualified staff, and quality monitoring [11].
Different viruses, microbes, diverse minerals, and organic compounds present in healthy drinking water are adversely affected human health. A substantial number of people in developed countries are impacted by health conditions because of contaminated drinking water and microbial pollution. In developed countries, the polluted drinking water source has caused nearly five million children to die. This condition is growing day by day because of the exponential population increase, which leads inevitably to inadequate water quality management. In Pakistan, 30% of diseases and 40% of all deaths were believed to be attributable to the low quality of water. The most common cause of death in babies and children in Pakistan is diarrhea, which is a waterborne disease, and one in five people in Pakistan suffer from disease and disease caused by contaminated water [19].
Water quality decreases rapidly in most cities in Pakistan. Groundwater availability is the main source of declining water quality. Every year in Pakistan there are about 100 million diarrheal cases. Infections of cholera, typhoidal diseases, dysentery, hepatitis, giardia, cryptosporidiosis, and guinea worm (which include diseases related to sanitation problems) account for nearly 80% of all illnesses and account for 33% of deaths [13].
Machine learning is being rapidly incorporated into almost every research area. The growing number of ML applications and use cases across a broad range of domains is a testament to this technology's potential. applications may no longer be quantifiable. The results show that ML is frequently utilized for microbiological research and focuses on difficulties of categorization and interaction analysis. Many difficulties remain unanswered, however, and researchers from many sectors, such as biology, information technology and medicine, will have to work together to support the development and improvement of microbiological research. The optimal technique may be employed by the microbiologist in his everyday practice according to completed experiments. In addition, when the data base size triples, this approach may also be utilized, as the accuracy of a method diminishes linearly with the database size.
This review documented the research performed in Pakistan on the quality and contamination of potable water as the predominating and main contaminant owing to poor sanitary and sewage system sewerage water (fecal) mixture with drinking water. Chemical pollution from industrial waste toxics, textile dyes, pesticides and nitrogen fertilizers, arsenic and other chemicals is the second cause of the contamination. Regular inspections of existing treatment plants must be maintained and upgraded. Today, Pakistan's government will set up drinking water filters throughout Pakistan. The results showed that sewage pollution with drinking water should be regarded as a major health and environmental problem [19].
ML has a promising future in microbiology, despite these obstacles. As algorithms develop and trustworthy, they will become part of processes that will become available by researchers (for instance in Galaxy or Bioconductor). ML-algorithms of state-of-the-art, particularly neural networks for deeper learning, can handle with picture, text (for example, Pub-Med papers or genome / experimental annotations) and strings (such as genomic sequences). The Internet databases are packed with such data that were before too difficult to use. There is a wonderful chance to mix data from different sources and solve previously uncomfortable challenges. A microbiologist has, in our view, two options: taking up the ML revolution and beginning to become a competent ML practitioner or accepting that ML is something esoteric that mathematicians and IT scientists are better able to do.
The next study will focus on the extension of the DIBaS data set, and the extension of the technique examined by providing colour distribution information. The accuracy of recognition should be further improved.
[1] M. Daud, et al., “Drinking water quality status and contamination in Pakistan,” BioMed Res. Int., vol. 2017, Aug. 2017, Art. no. 7908183, doi: https://doi.org/10.1155/2017/7908183
[2] F. Akova, et al., “A machine‐learning approach to detecting unknown bacterial serovars,” Stat. Anal. Data. Min., vol. 3, no. 5, pp. 289-301, Aug. 2010, doi: https://doi.org/10. 1002/sam.10085
[3] H. Wang, et al., “Early detection and classification of live bacteria using time-lapse coherent imaging and deep learning,” Light Sci. Appl., vol. 9, no. 1, pp. 1-17, July 2020, doi: https:// doi.org/10.1038/s41377-020-00358-9
[4] M. Poladia, P. Fakatkar, S. Hatture, S. Rathod, and S. Kuruwa, “Detection and analysis of waterborne bacterial colonies using image processing and smartphones,” in Int. Conf. Smart Technol. Manag. Comput. Commun. Control., Energy Materials, May 6-8, 2015, pp. 159-164, doi: https://doi. org/10.1109/ICSTM.2015.7225406
[5] H. -w. Shi, Y. -w. Shi, and Y. -g. Yin, “Study on method of bacteria image recognition,” in 4th Int. Cong. Image Signal Proce., Oct. 15-17, 2011, pp. 273-277, doi: https://doi.org/10.1109 /CISP.2011.6099959
[6] B. Zieliński, A. Plichta, K. Misztal, P. Spurek, M. Brzychczy-Włoch, and Ochońska, “Deep learning approach to bacterial colony classification,” PloS one, vol. 12, no. 9, Sep. 2017, Art. no. 0184554, doi: https://doi.org/10. 1371/journal.pone.0184554
[7] J. Brownlee, “How to configure image data augmentation in Keras,” Machine Learning Mastery. https:// machinelearningmastery.com/how-to-configure-image-data-augmentation-when-training-deep-learning-neural-networks/ (accessed Mar. 30, 2021).
[8] E. P., “What is image acquisition in image processing?,”Easy Tech Junkie. https://www.infobloom.com/what-is-image-acquisition-in-image-processing.htm (accessed Mar. 29, 2021).
[9] W. Ahmed, B. Bayraktar, A. Bhunia, E. Hirleman, J. Robinson, and B. Rajwa, “Classification of bacterial contamination using image processing and distributed computing,” IEEE J. Biomed. Health Inform., vol. 17, no. 1, pp. 232-239, Oct. 2012, doi: https:// doi.org/10.1109/TITB.2012.2222654
[10] K. Horak, J. Klecka, and M. Richter, “Water quality assessment by image processing,” in 38th Int. Conf. Telecommun. Signal Process, 2015, pp. 577-581, doi: https://doi.org /10.1109/TSP.2015.7296329
[11] P. Sharma, “Computer vision tutorial: A step-by-step introduction to image segmentation techniques (Part 1),” https://www.analyticsvidhya.com/blog/2019/04/introduction-image-segmentation-techniques-python/ (accessed March 30, 2021).
[12] J. Salzman, “Thirst: A short history of drinking water,” Yale JL & Human, vol. 18, 2005.
[13] S. C. Edberg, E. W. Rice, R. J. Karlin, and M. J. Allen, “Escherichia coli: the best biological drinking water indicator for public health protection,” J. Appl. Microbiol., vol. 88, no. S1, pp. 106S-116S, Nov. 2000, doi: https://doi.org/10.1111/j.1365-2672. 2000.tb05338.x
[14] N. Rosemann, “Drinking-Water crisis in Pakistan and the issue of bottled Water: The case of Nestlé’s ‘Pure Life,” Actionaid Pakistan, pp. 1-37, Apr. 2005. https://www.humanrights. ch/cms/upload/pdf/050829_drinkingwaterpakistan_rosemann2005.pdf
[15] M. F. Chaplin, “Water: its importance to life,” Biochemistry and molecular biology education, vol. 29, no. 2, pp. 54-59, Mar. 2001, doi: https://doi.org/ 10.1016/S1470-8175(01)00017-0
[16] S. Felson, “What is E. Coli?,” WebMD. https://www.webmd.com /food-recipes/food-poisoning/what-is-e-coli (accessed Mar. 29, 2021).
[17] D. Zelman, "What is salmonella?" WebMD. https://www.webmd.com /food-recipes/food-poisoning/what-is-salmonella (accessed Mar. 29, 2021).
[18] lenntech, "History of drinking water treatment,”. https://www.lenntech.com /processes/disinfection/history/history-drinking-water-treatment.htm (accessed Mar. 29, 2021).
[19] L. Huang and T. Wu, “Novel neural network application for bacterial colony classification,” Theor. Biol. Med. Model., vol. 15, no. 1, pp. 1–16, Dec. 2018, doi: https://doi.org/10. 1186/s12976-018-0093-x