Department of Management Sciences, DHA Suffa University, Karachi, Pakistan
* Corresponding Author: [email protected]
The study aims to examine the influence of Liquidity Creation (LC) on Pakistan's Economic Development (GDP) to investigate the moderating role of firm size and its abiding association in this relationship. Banks create liquidity by managing their portfolios of assets and liabilities with various maturities. The current study used an estimated amount of liquidity created by commercial banks in Pakistan using the "Catfat" model over the last twenty-two years. The estimated LC is employed in this study to assess its influence on GDP growth. Additionally, the research examines the moderating role of firm size between LC and GDP. Furthermore, secondary time series data for this research was collected from the financial statements and World Bank Data from 2000-2021. The study employs a regression technique to test the hypotheses. The outcomes indicate that LC has a significant positive impact on GDP. It implies that when commercial banks create liquidity, it boosts economic growth. The results revealed that firm size does not moderate the relationship between the LC and GDP, neither strengthens nor weakens. The study put forward that conventional banks play a substantial role in contributing to Pakistan's economic growth by creating liquidity in the market. The study holds importance in its ability to shape economic policies, provide financial institutions direction, and offer investors advantages. It contributes to academic research, provides practical insights, and has worldwide applicability in enhancing comprehension of financial systems and their influence on economic growth.
Keywords: commercial banks, directions, economic development, economic policies, liquidity creation
JEL Codes: G21, E58
A robust financial system is widely recognized as a reagent for economic growth (Hussain et al., 2023). Banks play a pivotal role in channeling funds from surplus savers to those, which require capital (Kudratova, 2023). Commercial banks, in particular, serve a dual purpose; firstly, they support the payment system and facilitate routine financial transactions to enhance market liquidity (Omete, 2023). Diamond and Dybvig (1983) present the concept of Liquidity Creation (LC), which is key to this process. LC can be defined as a bank's strategy to fund liquid liabilities using illiquid assets or vice versa, ensuring their ability to meet financial obligations. For instance, a commercial bank may offer borrowers committed lending facilities for a specified term, while issuing demand deposits that depositors can withdraw on short notice. By striking a balance between illiquid assets and liquid liabilities, commercial banks fulfill the needs of both depositors and borrowers (Deep & Schaefer, 2004).
The importance of banks in the economy extends to facilitate seamless consumption, sustaining continuous output, and acting as liquidity transformers. The volume of liquidity commercial banks creates a direct role in a country's economic expansion (Berger & Bouwman, 2013). In the Quantitative Asset Transformation Function (QATF), banks serve two vital functions: liquidity creation and transformation of risks. Ali and Ahmad (2022) and Shoaib (2021) highlighted that commercial banks manage risk by offering risk-free liquid deposits to support risky illiquid lending. Conversely, financial institutions create liquidity by leveraging liquid liabilities to invest in illiquid assets. Prior theoretical literature has put forth several models for quantifying the monetary value of liquidity produced by commercial banks, with some focusing on the left side of the balance sheet. In contrast, others concentrate on the right side of the balance sheet.
Deep and Schaefer (2004) contributed to understanding the role of both the asset and liability sides of the balance sheet in creating liquidity. Furthermore, off-balance sheet items, such as forward contracts and comparable dues on a bank's liquid assets, have been identified as contributors to liquidity creation (Kashyap et al., 2002). To assess the level of LC in financial institutions, specifically in the US, Berger and Bouwman (2009) developed four distinct approaches, incorporating both on- and off-balance sheet components. This economic literature serves a broader goal: understanding the relationships between LC and key policy variables, such as inflation, unemployment, and investment. Calculating the expected volume of liquidity generation is the most comprehensive indicator of overall bank productivity, considering all balance sheet elements. LC is crucial in determining per capita GDP, reflecting broader economic outcomes (Berger & Sedunov, 2016).
While the creation of new liquidity is known to boost economic growth, it must be managed carefully to maintain the financial institution's profitability. Commercial banks face significant challenges in liquidity creation, including maturity mismatches between assets and liabilities, early drawing of deposits, and asymmetric information. These challenges can endanger a bank's constancy and expose it to various perils. For example, one bank may enhance market liquidity by altering short-term commitments into long-term loans; however, this approach may upsurge the volatility of its balance sheet (Thakor, 2005). Conversely, another bank struggling to generate liquidity may maintain a more liquid balance sheet, which reduces market liquidity but minimizes risk exposure (Ali & Ahmad, 2022; Mughal et al., 2022).
Furthermore, banks may prioritize solvency over offering long-term loans to support the economy. The composition of the banking industry's asset portfolio, consisting primarily of long-term, illiquid loans and investments, can significantly affect the economy. The objective is to quantify the liquidity created by conventional banks in Pakistan and assess its impact on the country's economic growth. Several key questions guide this research: What is the influence of LC on economic development in Pakistan, and does the size of firms moderate among the constructs? The connection between Liquidity Creation (LC) and its influence on economic growth holds significant importance, particularly when considering Pakistan's specific context. While prior research has delved into the association between LC and economic growth across various regions, a conspicuous research gap exists when comprehending this connection within the unique circumstances of Pakistan. This research problem arises from a genuine inquisitiveness to untangle the intricacies and repercussions of LC on Pakistan's economic growth.
The central research inquiries steering this investigation to evaluate the effect of LC on the economic growth of Pakistan? This inquiry stems from the curiosity surrounding the role of LC, a pivotal facet of the financial sector, in shaping the broader landscape of economic growth in Pakistan. The aim is to scrutinize the impact of LC on economic development in this distinctive regional milieu and its contribution towards the overall development. Does the firm size moderate between LC and economic growth in Pakistan? To comprehensively understand the interplay between LC and economic growth, identifying any factors or mechanisms that may mediate or moderate this relationship is imperative. This curiosity emerges from the acknowledgment that the impact of LC may exhibit variability influenced by a range of contextual elements. The employees' well-being in banks has been ignored over the period, which affects their performance; the perceived diversity influences the employees' well-being, irrespective of the organization (Ali & Khan et al., 2023).
The significance of tackling this research problem is twofold. Firstly, the economic progress of Pakistan holds profound national importance, thereby, discerning the role of LC in this context can furnish valuable insights for policymakers, which may inform strategic decisions within the banking sector, all geared toward promoting sustainable economic growth. Secondly, the research void within the unique context of Pakistan presenting an invaluable opportunity to contribute recent developments to the broader global body of knowledge on LC and its repercussions on economic growth. This understanding of the relationship in the Pakistani setting can serve as a valuable reference point for other economies grappling with analogous challenges and dynamics. To encapsulate this research conundrum endeavors and to demystify the impression of Liquidity Creation (LC) on the GDP growth of Pakistan, endeavoring to bridge a research gap and offer consequential insights with ramifications for policy formulation, banking practices, and a more comprehensive comprehension of this relationship both regionally and globally.
The objective is to inspect the effects of LC on Pakistan's GDP, focusing on commercial banks in Pakistan. Commercial banks must generate liquidity judiciously, as excessive LC can harm the national economy, and the converse can also hold. The rest of the study is distributed into five sub-sections. The first section provides a brief introduction, while the second extensively reviews the literature on LC and GDP. The third section sketches the methodology. The fourth section presents and discusses the study’s outcomes, and the fifth section concludes the overall research.
According to the Financial Intermediation Theory, banks are financial institutions that act as intermediaries between the depositor and borrower. According to the Quantitative Asset Transformation Function, banks have two crucial responsibilities: risk transformation and liquidity creation. By offering risk-free liquid deposits, banks reduce risk by financing risky, illiquid loans. Contrarily, commercial banks generate liquidity by leveraging liquid liabilities to invest in illiquid assets. Deep and Schaefer (2004) established a methodology for calculating the liquidity created by banks. Researchers assess how much liquidity the US banks have produced by taking a sample from the 200 largest US institutions. Liquidity in banking refers to both assets and liabilities.
Deep and Schaefer (2004) established a Liquidity Transformation (LT) gap to determine the discrepancy between liquid obligations and liquid assets as a fraction of total assets. Researchers have claimed that the LT Gap signifies the net liquidity transformation, a bank has experienced relative to its total assets. Due to their contingent nature, loan obligations and other off-balance sheet manoeuvres were overtly removed from the LT Gap measurement. One of the most popular and comprehensive models for evaluating the LC function of American banks was established in prior literature (Berger & Bouwman, 2009).
The first noticeable distinction was including all conventional banks in Berger and Bouwman's (2009) model instead of simply the most well-known ones. Second, their preferred metric loans was grouped by category rather than maturity. They also suggested metrics, which considered off-balance sheet activity. Sabahat (2017) measured and estimated the amount of liquidity created by conventional banks in Pakistan using the measurement method developed by the literatrue (Berger & Bouwman, 2009). The data was gathered between September 2007 and June 2016 and was divided into three clusters, namely large, medium, and small banks. The conventional banks in Pakistan were contacted for data collection in every three months. According to Sabahat (2017), Pakistan's banks contributed 2.55 trillion rupees of liquidity to the country's economy until June 2016.
The affiliation between finance and economic growth has been extensively explored in the previous literature. Various studies, including the work of Greenwood and Jovanovic (1990) and Deidda (2006), have delved into how the bank's liquidity creation function can influence GDP. Financial support is pivotal in stimulating GDP (Levine, 1997). However, contrasting perspectives have been presented by scholars like Stern (1989) and Stiglitz (1994), who contend that it is economic growth that fosters financial development rather than the other way around. Javid et al. (2023) scrutinized the influence of liquidity creation on bank profits and the moderating effect of political instability.
Ali and Mughal et al. (2023) inspected the effect of monetary policy on the bank's liquidity creation. Studies specific to the MENA region have demonstrated a positive influence of finance on economic growth (Almeshari et al., 2023; Boukhatem & Ben, 2018). However, earlier studies, such as those conducted by Beck et al. (2023) and Gazdar and Cherif (2015) and, have indicated either an adverse effect or an inconsequential affiliation between finance and GDP. These inconsistent outcomes can be attributed to variations across studies, including differences in financial indicators, country samples, time, econometric techniques, and the selection of variables.
In recent academic research, there is a growing focus on the notion of Liquidity Creation (LC) and its pivotal role in the operations of banks. For example, a study by Fidrmuc et al. (2015) examined how LC impacts Russia's economic growth. They applied the methodology that Berger and Bouwman (2009) developed for a comprehensive dataset encompassing Russian banks' activities from 1999-2009. Their findings indicated a positive correlation between LC and economic growth, with specific attention drawn to the significant contributions made by state-controlled banks and the largest banks in Russia towards LC. Similarly, Berger and Sedunov (2016) investigated the significance of LC for the US banks and found a noteworthy positive association between LC and economic growth. Beck et al. (2023) explored the connection between LC and investment as a mechanism through which LC affects economic growth, using panel data encompassing 100 countries. They established a relationship between LC and economic growth at national and sectoral levels. Their research indicated that LC promoted tangible investment, while intangible investment did not significantly contribute to the development of economies that rely on intangible assets. However, Umar et al. (2021) discovered a negative correlation between LC and China's economic output based on the data gathered from 377 banks from 2006-2017.
The severity of various financial crises has prompted scholars’ interest in the finance-growth relationship to reassess the connection between finance and growth. Financial instability is often attributed to disrupting production and investment, which can lead to a decline in economic growth. In the aftermath of global financial crises, this relationship has been reconsidered, giving rise to the notion of the "vanishing effect" of finance and a non-monotonic relationship. Several studies have illustrated this with a hump-shaped relationship. The correlation between finance and economic growth, with a specific focus on Liquidity Creation (LC) and its crucial role within the banking financial system, remains a matter of ongoing discussion among academic researchers. The existing body of research plays a pivotal role in providing insights into the influence of LC on economic growth. Nevertheless, whether this linear or nonlinear relationship has yet to receive extensive attention, prior studies have yet to investigate the linearity of LC systematically.
Ilyas and Sarwar (2018) investigated the impact of capital on the emergence of liquidity in Pakistan. Researchers between 2004 and 2013 in Pakistan gathered information from conventional banks. Ilyas and Sarwar (2018) used the Generalized Least Square Method to analyze the banks and divided them into large, medium, and Small groups. The study's findings did conclude that the bank's governance had a favorable impact on LC. Larger firms create less liquidity as compared to smaller banks. To perform his research on the causes of the production of liquidity, Shoaib (2021) collected samples from many nations. According to Yeddou et al. (2020), the ownership structure distresses LC, and top management decisions impact the entire organization's performance. Poor judgment causes the company to fail its banks (Zhao et al., 2010; Zheng & Cronje et al., 2019).
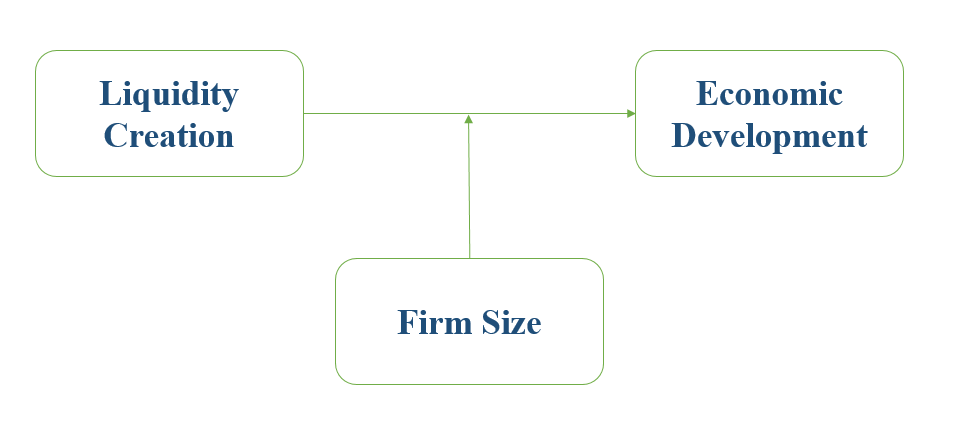
Figure 1
Research Framework
Research Design
Saunders et al. (2012) research defined the research methodology. The positivist philosophy is adopted as the researcher tests the theory, which leads us to use the deductive approach (Tran, 2020). The quantitative Research Design is adopted. The annual time series secondary data is congregated to estimate the impression of LC on Pakistan's GDP. The current study used the estimated amount of liquidity created by commercial banks in Pakistan using the "Catfat" model annually over the last twenty-two years. The estimated LC is employed in this study to assess its influence on Pakistan's economic growth. The Gross Domestic Product growth rate is a proxy for Pakistan's economic growth/development. The firm size is measured using the percentage change in total assets of commercial banks. The secondary data is gathered from the World Bank data and the Financial Statements. The data is gathered from 2000 to 2021. The researcher uses e-view software for the data analysis as it is most appropriate for secondary data analysis. The researcher adopts the measures of LC by using the "Catfat" model (Ali & Ahmad, 2022). Researchers use the Baron and Kenny (1986) method for moderation analysis.
Econometric Model
GDPt = β0 + β1 LCt + εt (1)
GDPt = β0 + β1 LCt + β2 FSt + εt (2)
GDPt = β0 + β1 LCt + β2 FSt + β3 (LC*FS) t + εt (3)
Where
GDP = Gross Domestic Product
β0 = Coefficients
LC = Liquidity Creation
FS = Firm Size
ε = Error Term
t = Time Series
Research Hypotheses
The following research hypotheses are developed to achieve the research objectives:
H1 = Liquidity creation has a positive significant impact on the economy.
H2 = Firm size has a positive significant impact on the economy.
H3 = Firm size moderates the association between LC & the economy.
Measurement Tool
The following are the measurement tools used for measuring the dependent, independent, and moderating variables:
Table 1
Variables & Measurement Tool
|
S.No. |
Variable |
Measurement Tool |
Author |
|
1. |
Liquidity Creation |
= + (1/2) * Illiquid Assets (0) * Semi Liquid Assets - (1/2) * Liquid Assets + (1/2) * Liquid Liabilities (0) * Semi Liquid Liabilities + (1/2) * Illiquid Liabilities + (1/2) * Liquid Equity (0) * Semi Liquid Equity + (1/2) * Illiquid Equity + (1/2) * Illiquid Guarantees (0) * Semi Liquid Guarantees - (1/2) * Liquid Guarantees |
(Berger & Bouwman, 2009) |
|
2. |
Economic Development |
The Gross Domestic Product growth rate is used to measure the Economic Development of a Country |
(Jawaid & Raza, 2013) |
|
3. |
Firm Size |
Percentage Change in Total Assets |
(Ali & Mughal et al., 2023) |
Descriptive statistics are essential for analyzing and summarizing secondary data (Gravetter & Wallnau, 2013). They help researchers understand the data's basic features, such as central tendency, variability, and distribution. By providing a clear and concise summary of the data, descriptive statistics can help to identify patterns and relationships that may not be immediately apparent (Gravetter & Wallnau, 2013). Table 2 contains important statistics such as the total number of observations, the maximum and minimum values of each sample variable, the standard deviation, and the mean of the dataset. Table 2 also shows the values for the Skewness and Kurtosis. All the variables meet the criteria of the Skewness and the Kurtosis.
Table 2
Descriptive Analysis
|
Variables |
Mean |
Standard Deviation |
Min |
Max |
Skewness |
Kurtosis |
Observation |
|
GDP |
0.041 |
0.020 |
-0.012 |
0.075 |
-0.658 |
3.435 |
N=22 |
|
LC |
0.298 |
0.597 |
-0.323 |
2.033 |
2.121 |
6.640 |
N=22 |
|
FS |
0.253 |
0.291 |
0.027 |
1.425 |
3.187 |
13.24 |
N=22 |
|
LC*FS |
0.054 |
0.193 |
-0.461 |
0.614 |
0.596 |
6.730 |
N=22 |
The average liquidity creation for commercial banks in Pakistan is 29.8%, with a minimum of -32.3%, a maximum of 203%, and a standard deviation of 59.7%. The total number of observations for liquidity creation is 22. The GDP growth rate is used as a proxy for the economic development of Pakistan, with a mean value of 4.1%, a minimum value of -1.20%, and a maximum value of 7.50%, with a standard deviation of 2%. The total number of observations for the GDP growth rate is 22. The firm size is measured using the total asset growth rate. The total number of observations for the firm size is 22. The mean value for firm size is 25.3%, with a minimum of 2.7%, a maximum of 142.5%, and a standard deviation of 29.1%. the moderator (LC*FS) has mean value of 5.4%, standard deviation of 19.3%, minimum value of -46.1%, maximum value of 61.4%. The variables' skewness and kurtosis values are within the acceptable range for all the constructs.
Ali and Ahmad (2022) estimated the amount of LC by using the “Catfat” measure of the LC Model (Berger & Bouwman, 2009). The current study adopts the said amount of LC. The “Catfat” model is the most comprehensive model developed by Berger and Bouwman (2009) to estimate the amount of LC. The researchers have developed four models to estimate the amount of LC. However, due to its authenticity and applicability, the researchers preferred the “Catfat” Model over others.
Figure 2
Overall, LC by Conventional Banks in Pakistan from 2000 – 2021
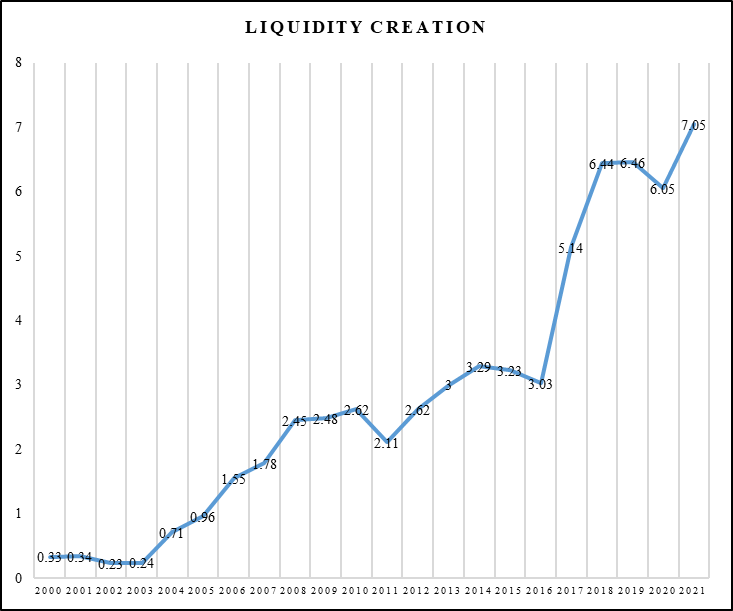
Figure 2 shows the estimated amount of LC measured by Ali and Ahmad (2022), which shows that all the conventional banks created around PKR 7.05 trillion liquidity in the Pakistani economy in 2021. If we see the trend of LC over the last twenty-two years, it is increasing due to the expansion of the banking industry. The trend shows that LC is also affected by COVID-19. The declining trend in 2019 and 2020 is due to COVID-19. The LC growth rate was used to examine the impact of LC on Pakistan's economic development. The liquidity creation mentioned in the line graph is in Trillions of Pakistani Rupees.
The significance of data normality in time series data analysis cannot be overstated. Time series data analysis, widely applied in social sciences and economics, investigates variable dynamics over time. Normality, indicating the distribution of data points, plays a crucial role in the accuracy and validity of statistical inferences within this framework. The researcher applied the unit root test to check the stationary of each variable. For time series data analysis, the data must have a trend, so the researcher also conducts a trend analysis for liquidity creation. The reliability and validity of data are the core before conducting a regression analysis or testing a relationship between the two variables.
Unit Root Test
In time series data analysis, the application of unit root tests serves as a fundamental indicative tool to assess the stationarity properties of variables over time. By applying a unit root test on the independent and dependent variables, the author aims to assess the stationarity of variables accurately. The unit root test is conducted for the dependent variable only. However, the researcher also tests the stationary of the independent variables.
Table 3
Unit Root Test
|
Variables |
Augmented Dickey-Fuller Unit Root Test |
|||
|
I(0) |
I(1) |
|||
|
C |
C&T |
C |
C&T |
|
|
GDP |
0.0339 |
0.0125 |
0.0041 |
0.0280 |
|
LC |
0.0334 |
0.0150 |
0.0004 |
0.0023 |
|
FS |
0.0005 |
0.0141 |
0.0246 |
0.0000 |
Table 3 shows the outcome of the Augmented Dickey-Fuller Unit Root Test for liquidity creation at the level and first difference. The unit root test was conducted with a dependent variable and independent variables to test the stationarity of the variable over a period of time at the level and first difference. As shown in Table 3, all the p-values associated with the test statistics reject the null hypothesis, i.e., 'the variable has a unit root,' and indicate that the variables have stationary time series for variables over time at the level and first difference. The Stationary of the data suggests that the Ordinary Least Square Method is appropriate for the analysis of time series data.
To test the relationship between the dependent and independent variables, the researcher used simple linear regression techniques to predict the dependent variable using the time series data. The regression technique is used to test the hypotheses developed by the researcher; however, before running the regression analysis, there are some issues that need to be tested, such as multi-collinearity, auto-correlation, and heteroscedasticity, and several statistical tests are run to check the existence of the said problems and their severity. While estimating econometric models, some issues may emerge. To investigate these issues, the researcher used different statistical tests.
Table 4
Multi-Collinearity
|
Variable |
Coefficient Variance |
Un-centered VIF |
Centered VIF |
|
C |
1.99 |
1.26 |
NA |
|
LC |
4.63 |
1.261 |
1.000 |
The centered variance inflation factor determines whether the model has a multi-collinearity issue. If the values of the centered VIF are less than 10, the model does not have a multi-collinearity issue. The results of the Variance Inflation Factor show that there is no multi-collinearity in the model. It is concluded that the independent variables do not correlate with one another since the values are less than 10. Therefore, we accept the null hypothesis (Ho: No Multi-collinearity in the Model).
Table 5
Breusch-Godfrey Serial Correlation LM Test
|
F-Statistics |
2.907 |
|
Obs*R2 |
2.919 |
|
Prob. F(1,21) |
0.1045 |
|
Prob. Chi-Square (1) |
0.0875 |
The Durbin Watson is calculated to identify the problem of auto-correlation. The value of Durbin Watson is 1.347, which is less than 2, indicating a positive autocorrelation in the model. However, to check auto-correlation severity, the researcher uses the Serial Correlation LM test with a null hypothesis (H0 = No Auto-correlation). The hypothesis will be accepted if the Prob value exceeds 0.05 and reject it otherwise. Since our model’s Prob value is more significant than 0.05 and is 0.1045, It is concluded that the model has no auto-correlation. Table 6 shows the outcome of the Heteroscedasticity White Test to examine the severity of heteroscedasticity in the model. The heteroscedasticity white test result equals 0.647, which is greater than 5%, respectively. Therefore, it implies that the model has no heteroscedasticity issues.
Table 6
Heteroscedasticity Test: White
|
F-Statistics |
0.445 |
|
Obs*R2 |
0.985 |
|
Prob. F(1,21) |
0.647 |
|
Prob. Chi Square (1) |
0.611 |
Equation - 1: GDPt = β 0 + β 1 LCt + еt
Estimated Equation - 1: GDPt = 3.67+ 1.53LCt + еt
Table 7
Simple Linear Regression (Eq-1)
|
Coefficientsa |
|||||
|
Model |
Unstandardized Coefficients |
t |
Sig. |
||
|
B |
Std. Error |
||||
|
1 |
(Constant) |
0.0367 |
0.0044 |
8.2306 |
0.0000 |
|
Liquidity_Creation |
0.0153 |
0.0068 |
2.2582 |
0.0353 |
|
|
R2 |
0.2031 |
||||
|
Adjusted R2 |
0.1633 |
||||
|
Prob (F-Statistic) |
0.0352 |
||||
|
Durbin Watson |
1.3474 |
||||
|
a. Dependent Variable: Gross_Domestic_Product |
|||||
After the diagnostic analysis, the assumptions of the Ordinary Least Square Method were met. The model has no issue of multi-collinearity, auto-correlation, and heteroscedasticity. The researcher estimates the first equation by considering liquidity creation as an independent variable and GDP as the dependent variable to meet the first assumption of Barron and Kenny's (1986) approach to moderation analysis. Commercial banks have a significant positive impact on Pakistan's gross domestic product, which means that LC by commercial banks results in the country's economic development. This finding is significant at the level of 0.05. Therefore, Hypothesis 1 was accepted because GDP increases by 1.53% with the change in LC. The r-square is 0.2031, which means that the variation in dependent variables is 20.31%, explained by the independent variable.
Equation - 2: GDPt = β 0 + β 1 LCt + β 2 FSt + еt
Estimated Equation - 2: GDPt = 3.43 + 1.59 LCt + 0.88 FSt + еt
Table 8
Multiple Regression (Eq-2)
|
Coefficientsa |
|||||
|
Model |
Unstandardized Coefficients |
t |
Sig. |
||
|
B |
Std. Error |
||||
|
2 |
(Constant) |
0.0343 |
0.0059 |
5.7440 |
0.0000 |
|
Liquidity_Creation |
0.0159 |
0.0069 |
2.2826 |
0.0341 |
|
|
Firm_Size |
0.0088 |
0.0143 |
0.6158 |
0.5453 |
|
|
R2 |
0.2187 |
||||
|
Adjusted R2 |
0.1365 |
||||
|
Prob (F-Statistic) |
0.0095 |
||||
|
Durbin Watson |
1.337 |
||||
|
a. Dependent Variable: Gross_Domestic_Product |
|||||
In equation 2, the moderator is included as an independent variable, such as firm size, to meet the second assumption of Barron and Kenny's (1986) approach. The equation is estimated by using multiple regression techniques. The results showed that the model's r-square value is 0.2187, indicating that LC accounts for just 21.87% of the variation in Pakistan's gross domestic product. In comparison, the other 78.13% could be attributed to other factors. The results of multiple regression showed that the LC by commercial banks has a significant positive impact on Pakistan's gross domestic product when the moderator is used as the independent variable. It means that the LC by commercial banks results in the country's economic development. A one-unit change in liquidity creation brings a 1.59% positive change in Pakistan's economic growth. This finding is significant at the level of 0.05. Therefore, Hypothesis 2 was rejected, and the alternative hypothesis was accepted, which indicated that the LC has a positive significant impact on GDP. The firm size has a positive insignificant impact on GDP, which means that the firm size change does not affect a country's economic growth.
Equation - 3: GDPt = β 0 + β 1 LCt + β 2 FSt + β 3 (LC*FS)t + еt
Estimated Equation - 3: GDPt = 3.34 + 0.58 LCt + 1.61 FSt + 3.72 (LC*FS)t + еt
Table 9
Multiple Regression (Eq-3)
|
Coefficientsa |
|||||
|
Model |
Unstandardized Coefficients |
t |
Sig. |
||
|
B |
Std. Error |
||||
|
2 |
(Constant) |
0.0334 |
0.0062 |
5.3689 |
0.0000 |
|
Liquidity_Creation |
0.0058 |
0.0169 |
0.3427 |
0.7358 |
|
|
Firm_Size |
0.0161 |
0.0183 |
0.8796 |
0.3906 |
|
|
Moderator (LC*FS) |
0.0372 |
0.0570 |
0.6534 |
0.5217 |
|
|
R2 |
0.2368 |
||||
|
Adjusted R2 |
0.1096 |
||||
|
Prob (F-Statistic) |
0.0172 |
||||
|
Durbin Watson |
1.4170 |
||||
|
a. Dependent Variable: Gross_Domestic_Product |
|||||
In equation 3, the researcher estimates the equation by taking LC, firm size, and moderator (LC * firm size) as an independent variable and gross domestic product as a dependent variable. The equation is estimated by using multiple regression techniques. The results showed that the model's r-square value is 0.2368, indicating that LC accounts for just 23.68% of the variation in Pakistan's gross domestic product. In comparison, the other 76.42% could be attributed to other factors. The results of multiple regression showed that the LC, firm size, and moderator (LC*FS) have an insignificant positive impact on Pakistan's gross domestic product. Furthermore, the moderator has a positive but insignificant impact on GDP, which means that the firm size, does not moderate the relationship between LC and economic development. LC by commercial banks results in the country's economic development and the firm size does not moderate the relationship between variables. This finding is insignificant at the level of 0.05. Therefore, the researchers have rejected the Hypothesis 3, as the firm size does not moderate the relationship between LC and GDP.
The growing body of economic literature must explore the potential significance of models used to measure liquidity creation (LC). Multiple studies have recognized these models as valuable indicators of the financial system’s performance. They have also been associated with various economic metrics, such as GDP growth and performance indicators within the banking industry, including the crises of 2008, capital adequacy, and bank failures. Sahyouni and Wang (2019) asserted that the performance of commercial banks is intricately tied to their capacity to generate liquidity.
To underscore the significance of liquidity creation (LC) in fostering economic growth, Berger and Sedunov (2016) provided compelling evidence of a substantial and positive correlation between per capita LC and per capita economic growth. Their study underscored the need for diverse channels to facilitate economic liquidity creation, encompassing advances, deposits, and investments. Total gross assets, equity, and liabilities were identified as more effective predictors of per capita GDP than other bank-specific variables. Similar observations regarding the relationship between GDP and LC indicators within the Russian economy were reported by Fidrmuc et al. (2015). The findings suggested that liquidity creation has a significant positive impact on GDP, which means that when banks create liquidity in the market by financing illiquid assets and by utilizing liquid liabilities, it boosts Pakistan's economy. The firm size does not matter, as the outcome suggests that the firm size does not moderate between liquidity creation and the economic development of Pakistan.
While the generation of surplus liquidity has been associated with financial crises, research has also highlighted its positive impact on overall economic growth. A liquidity surplus suggests that commercial banks take on excessive liquidity through short-term deposits and long-term loans. These measures have also been employed as predictors of bank failure. When commercial banks significantly increase a nation's liquidity, the probability of failure concerning the bank industry also rises. The analysis identified institutions with LC rates exceeding 90% are among the high liquidity creators. The research proposed a screening process to rank banks based on the liquidity they generated in a specific quarter. The amount that banks contribute to a country’s GDP is largely determined by its LC. Sabahat (2017) aimed to determine how increasing liquidity influences economic growth. This study sought to establish a relationship between the contributions of the banking and financial industries to national income.
Economies characterized by low savings and high investments typically exhibit robust domestic demand, which can lead to inflationary pressures. While the relationship between LC and micro/macroeconomic determinants has yet to be thoroughly explored, this study faced limitations in investigating meaningful connections between these significant macro variables. As mentioned, the literature is still in its early stages when examining the broader implications of liquidity creation (LC) for the overall economic system.
The study examined the influence of Liquidity Creation (LC) on economic growth in Pakistan to access whether the firm size moderates the relationship between LC and GDP growth of the economy. The banks notably created liquidity by managing their portfolios of assets and liabilities with various maturities. Ali and Ahmad (2022) measure the amount of liquidity created by commercial banks in Pakistan by using the "Catfat" model (Berger & Bouwman, 2009). The current study adopted the projected amount of LC to examine its effect on Pakistan's economic growth. For this purpose, economic growth was measured using the country's gross domestic product growth rate. Several hypotheses were formulated to achieve the research objectives. Furthermore, the study deployed Barron and Kenny's (1986) model to identify the moderating role of firm size between the construct. The time series secondary data was congregated from 2000-2021. Thus, the findings suggested that LC has a significant positive impact on Pakistan's economic development. The findings also suggested that firm size does not moderate the relationship between LC and Pakistan's economic development. Hence, the study concluded that conventional banks contribute to Pakistan's economy by creating market liquidity.
Ali, A., & Ahmad, U. (2022). LC by Conventional Banks in Pakistan. Global Management Journal for Academic & Corporate Studies, 12(2), 14–14. https://doi.org/10.59263/gmjacs.12.02.2022.254
Ali, A., Khan, S. K., Rais, M., & Gul, H. (2023). Impact of perceived diversity & organizational justice on employee well-being: Mediating role of inclusion. International Journal of Social Science & Entrepreneurship,3(1), 85–106. https://doi.org/10.58661/ijsse.v3i1.76
Ali, A., Mughal, R., Minhas, A. A., & Abbas, Q. (2023). Nexus between monetary policy & liquidity creation: Study from the perspective of Pakistan.International Journal of Finance Research,4(1), 62–76. https://doi.org/10.47747/ijfr.v4i1.1212
Almeshari, A., Bin Dato Haji Yahya, M. H., Bin Kamarudin, F., & Abd Hamid, S. A. (2023). Liquidity creation and economic growth: Are they monotonically related? Evidence from MENA countries.Economies,11(1), Article e24. https://doi.org/10.3390/ economies11010024
Baron, R. M., & Kenny, D. A. (1986). The moderator–mediator variable distinction in social psychological research: Conceptual, strategic, and statistical considerations. Journal of Personality and Social Psychology, 51(6), 1173–1182. https://doi.org/10.1037/0022-3514.51.6.1173
Beck, T., Dottling, R., Lambert, T., & Van Dijk, M. (2023). Liquidity creation, investment, and growth.Journal of Economic Growth,28(2), 297–336. https://doi.org/10.1007/s10887-022-09217-1
Berger, A. N., & Bouwman, C. H. (2009). Bank liquidity creation.The Review of Financial Studies,22(9), 3779–3837. https://doi.org/10. 1093/rfs/hhn104
Berger, A. N., & Bouwman, C. H. (2013). How does capital affect bank performance during financial crises?Journal of Financial Economics,109(1), 146–176. https://doi.org/10.1016/j.jfineco.2013.02.008
Berger, A. N., & Sedunov, J. (2016). Bank liquidity creation and real economic output. Journal of Banking & Finance, 81, 1–19. https://doi.org/10.1016/j.jbankfin.2017.04.005
Boukhatem, J., & Moussa, F. B. (2018). The effect of Islamic banks on GDP growth: Some evidence from selected MENA countries.Borsa Istanbul Review,18(3), 231–247. https://doi.org/10.1016/j.bir.2017.11.004
Deep, A., & Schaefer, G. K. (2004). Are banks liquidity transformers? (KSG Working Paper No. RWP04-022) http://dx.doi.org/10. 2139/ssrn.556289
Deidda, L. G. (2006). Interaction between economic and financial development.Journal of Monetary Economics,53(2), 233–248. https://doi.org/10.1016/j.jmoneco.2005.03.007
Diamond, D. W., & Dybvig P. H. (1983). Bank runs, deposit insurance, and liquidity. Journal of Political Economy, 91, 401–419. https://doi.org/10.1086/261155
Fidrmuc, J., Fungáčová, Z., & Weill, L. (2015). Does bank LC contribute to economic growth? Evidence from Russia. Open Economies Review, 26(3), 479–496. https://doi.org/10.1007/s11079-015-9352-1
Gazdar, K., & Cherif, M. (2015). Institutions and the finance–growth nexus: Empirical evidence from MENA countries.Borsa Istanbul Review,15(3), 137–160. https://doi.org/10.1016/j.bir.2015.06.001
Gravetter, J. & Wallnau, L., (2013). Statistics for the behavioral sciences. Cengage Learning.
Greenwood, J., & Jovanovic, B. (1990). Financial development, growth, and the distribution of income.Journal of Political Economy,98(5 Part 1), 1076–1107. https://doi.org/10.1086/261720
Hussain, S., Gul, R., Ullah, S., Waheed, A., & Naeem, M. (2023). Empirical nexus between financial inclusion and carbon emissions: Evidence from heterogeneous financial economies and regions.Heliyon,9(3), Article e13164. https://doi.org/10.1016/j.heliyon.2023.e13164
Ilyas, H., & Sarwar, S. (2018). Relationship between bank capital and LC: A disaggregated analysis of banking industry of Pakistan. Pakistan Journal of Applied Economics, 28(1), 177–190.
Javid, M., Chandia, K. E., Zaman, Q. U., & Akhter, W. (2023). Examining the effect of liquidity creation on banking profitability and stability: Moderating role of political instability.Kybernetes,52(10), 4061–4080. https://doi.org/10.1108/K-01-2022-0021
Jawaid, S. T., & Raza, S. A. (2013). Effects of terms of trade on growth performance of India.Economic Modelling,33, 940–946.
Kashyap, A. K., Rajan, R., & Stein, J. C. (2002). Banks as liquidity providers: An explanation for the coexistence of lending and deposit‐taking. The Journal of Finance, 57(1), 33–73. https://doi.org/10.1111/1540-6261.00415
Kudratova, M. (2023). The role of banks in the development of financial relations of regions.Conferencea, 38–41. https://conferencea.org/ index.php/conferences/article/view/2813
Levine, R. (1997). Financial development and economic growth: Views and agenda.Journal of Economic Literature,35(2), 688–726. https://www. jstor.org/stable/2729790
Mughal, R., Ali, A., Tariq, M., & Saleem, TB., (2022). Nexus between risk management and financial performance of commercial bank in Pakistan. IBT-Journal of Business Studies, 18(2), 198–215.
Omete, F. I. (2023).Financial intermediation efficiency and performance of commercial banks listed on the Nairobi securities exchange in Kenya[Doctoral dissertation]. Jomo Kenyatta, University of Agriculture and Technology, Digital Repository. http://localhost/xmlui /handle/123456789/6090
Sabahat, S. (2017). Estimating liquidity created by banks in Pakistan (State Bank of Pakistan Working Paper No. 86]. https://econpapers.repec.org /paper/sbpwpaper/86.htm
Sahyouni, A., & Wang, M. (2019). LC and bank performance: Evidence from MENA. ISRA International Journal of Islamic Finance, 11(1), 27–54. https://doi.org/10.1108/IJIF-01-2018-0009
Saunders, M., Lewis, P., & Thornhill, A. (2012). Research methods for business students. Pearson.
Shoaib, A. (2021). Antecedents of LC: Empirical evidence from developed, developing and emerging economies (Doctoral dissertation]. International Islamic University.
Stern, N. (1989). The economics of development: A survey.The Economic Journal,99(397), 597–685. https://doi.org/10.2307/2233764
Stiglitz, J. E. (1994). Economic growth revisited.Industrial and Corporate Change,3(1), 65–110. https://doi.org/10.1093/icc/3.1.65
Thakor, A. V. (2005). Do loan commitments cause over lending? Journal of Money, Credit and Banking, 37(6). 1067–1099. https://www.jstor. org/stable/3839028
Tran, D. V. (2020). Bank business models and LC. Research in International Business and Finance, 53, Article e101205. https://doi.org/10.1016/j.ribaf.2020.101205
Umar, M., Sial, M. S., & Xu, Y. (2021). What are the channels through which bank liquidity creation affects GDP? Evidence from an Emerging Country.SAGE Open,11(2), 1–11. https://doi.org/10.1177 /21582440211022325
Yeddou, N., & Pourroy, M. (2020). Bank LC: Does ownership structure matter? The Quarterly Review of Economics and Finance, 78, 116–131. https://doi.org/10.1016/j.qref.2020.01.003
Zhao, T., Casu, B., & Ferrari, A. (2010). The impact of regulatory reforms on cost structure, ownership and competition in Indian banking. Journal of Banking & Finance, 34(1), 246–254. https://doi.org/10.1016 /j.jbankfin.2009.07.022
Zheng, C., & Cronje, T. (2019). The moderating role of capital on the relationship between bank LC and failure risk. Journal of Banking & Finance, 108, Article e105651. https://doi.org/10.1016/ j.jbankfin.2019.105651