Bha Aldan Abdul sattar Faraj1* and Gokhan Ovenc2
1Faculty of Economics Department of Economics, Istanbul University, Turkey
2Faculty of Economics, Department of Management Information Systems, Istanbul University, Turkey
*Corresponding Author: [email protected]
Even though the commercial banks in Iraq faced various issues, especially after the banking sector in Iraq gained recognition in 2004. The scarcity of empirical evidence on the real issues facing the banking sector makes it difficult for decision-makers and policymakers to take adequate measures to address potential problems. This paper contributes to the empirical literature by measuring and analyzing cost efficiency in addition to the Lerner index to measure the power of the banking market in Iraq. A sample of panel data is utilized from 20 Iraqi commercial banks for the period 2010-2020. The data envelope analysis DEA is used to measure banks' cost efficiency. The empirical results gave evidence of a decrease in the price cost efficiency index in the banking sector during the transitional period, and the Lerner index gave negative results, which is an indication of the decline in the market power of Iraqi banks. This paper suggests that studies should be expanded to measure the power and weaknesses of the banking sector, which led to a decrease in the cost-price efficiency and the strength of the behavior.
Keywords: banking sector, cost efficiency, commercial banks, Lerner index, market power
The banking sector plays a crucial role in the financial system as a catalyst for economic growth in both developed and developing economies; however, its importance has become more prominent during periods of economic transition in which several countries are trying to develop an integrated economic system for strong production supported by effective financial systems. During the transition of market economy, governments, and central banks adopted many policies that supported the transformation of the financial and banking sector from central control to a market economy. For example, liberalizing interest rates, transferring some activities to commercial banks, restructuring and privatizing some government banks, especially those lagging in their work, in addition to supporting the private banking sector by enacting laws and regulations that facilitate the work of this sector (Fries & Taci, 2005).
Chick (1993) provided a time frame for the assumed development stages of the transition towards a market economy. In the first stage, cash is used as the primary instrument for payment operations, and deposits are part of the accumulation of savings and not among transaction balances. In the second stage, banks work to gain customer confidence and establish themselves so that banks' obligations become a means of payment, while the third stage includes developing the interbank borrowing system, which increases the availability of financing and facilitates economic movement and the —growth process. The fourth stage represents a turning point regarding the role of the central bank when it assumes full responsibility for enhancing confidence in the banking system, primarily by providing lending facilities of last resort. In the fifth stage, banks enter the new stage of managing liabilities by restoring public confidence in the efficiency of transactions based on deposits and increases versus decreases in cash transactions, and there is an improvement in the payment clearing mechanism for banking services as electronic clearing of payments (debit and credit cards, direct debit tools). This results in efficient deposit-based transactions, which results in more money flowing into the economy (Dow et al., 2008).
The effectiveness and efficiency of the banking system is a social goal in itself, to reduce the average transaction cost and enhance social welfare. Its importance increases, especially during transition periods for a gradual and smooth transition toward a market economy. The characteristics of economies and implementation mechanisms may impose themselves as a catalyst or an obstacle to the rapid transition towards a market economy in all of those economies during the transition period, including the Iraqi economy. The Iraqi banking sector was not immune to these transformations, as financial liberalization measures prompted the expansion of the Iraqi private banking sector after 2004.
The literature on cost efficiency and competition has developed rapidly in the developed regions, however, studies have indicated that developing regions still struggle to maintain cost efficiency in the Middle Eastern countries. This paper aims to narrow the gap in studies on the trends in the financial performance of banks during the transition period by evaluating cost-efficiency price and competition in the commercial banking sector of Iraq for 2010-2020. The significance of this study lies in estimating price cost efficiency and the Lerner Competition Index simultaneously, as price cost efficiency is an important factor in knowing the behavior and trends of the banking performance in light of the increasing intensity of competition between commercial banks during the transition period of a market economy.
Most of the previous literature has dealt with cost efficiency and market power in advanced economies, as compared to the lack of studies in transitional economies, especially in the Middle Eastern region. This paper contributes to the empirical banking literature in several ways. Firstly, this research study measures the cost efficiency in the banking sector of Iraq during its transitional period. Secondly, it assesses the strength of the banking market of Iraq by calculating the Lerner Banking Competition Index during 2010-2020. Thirdly, to determine the optimal levels of cost efficiency for the private banks of Iraq and the optimal economic size that maximizes their profits. The present study aimed to analyze whether banks in Iraq are achieving optimal cost efficiency and technical efficiency. Moreover, to analyze if market mechanisms control the market mechanism of banks in Iraq. To answer these questions, the present study uses the learner index to measure the efficiency estimations.
The rest of the paper is organized as follows. The second section shows an overview of Iraq's economy in the transition phase and a subsequent literature review, the third section shows the methodology, the fourth section shows the results and discussion, and the fifth section concludes the above discussion.
The year 2003 is considered a turning point in Iraq, in both its political and economic aspects, and the beginning of the transition towards a market economy. In 2003, the Banking Law was enacted, as the new structure conforms to international standards. The legislation of the Central Bank of Iraq in 2004 contributed to its status in its current form as an institution independent of the government. The Iraqi individual still prefers to keep cash in the first place, as according to World Bank data, only 23% of adult individuals maintain bank accounts, which is a small number compared to neighboring countries. There are a total of 74 banking institutions in Iraq, However, it contributed to only 1.94% of the national GDP in 2021. These banks have 904 branches spread all over the country, however, the bulk of these branches are concentrated in the economic centers of Baghdad and Basra with 37.1% and 9.3%, respectively. According to the World Bank, the number of commercial bank branches per 100,000 adults was 5.63 in 2020, which is much lower compared to figures from neighboring countries, for example, 16.1 in Turkey, 31.1 in Iran, and 13.6 in Kuwait. State banks own 78.6% of the banking sector's assets, control 84% of the cash-paid credit, and have 87% of the total deposits. This may be due to the extensive branch network throughout the country (currently it constitutes 45.5% of the total number of bank branches in Iraq) and in fact, it is guaranteed by the government itself. However, they constitute only 9% of the total number of banks in the country (meaning the banks themselves, not the branches). Iraqis do not trust their banking institutions and do not view them as a safe place to house their money. There are many reasons for this, one of which is the weakness and scarcity of its services, which do not attract entrepreneurs and companies. Additionally, high-interest rates, huge payment guarantees, due collateral requirements, and weak penetration into the market are all stifling the growth of the sector. Moreover, due to the many calamities that the Iraqis witnessed, the Iraqi individual thought that keeping his cash safely hidden in his home was a guarantee of its security and availability in times of crisis and need.
The institutional difference hypothesis (IDH) refers to the impact of institutional differences between developing and developed countries in supporting products, capital, markets, and the impact of their loss on the development of emerging economies (Julian & Ofori‐dankwa, 2013). Therefore, it is necessary to understand the financial system of the banking sector within the transitional phase when studying efficiency due to the different circumstances surrounding those countries. Therefore, with the mechanisms of transition from a planning economy towards a market economy, it has become necessary to restructure the financial sectors, especially the banking sector. The restrictions imposed on the financial sectors vary according to the progress of the economy, while we find that emerging economies are more restrictive than transitional economies (Djalilov & Piesse, 2019).
Over the past decade, many studies have dealt with banking efficiency, especially for those countries that have witnessed the transition towards a liberal economy. They have dealt with different dimensions of the factors affecting efficiency during periods of transition. The theoretical basis includes two types of factors that affect banking efficiency (internal factors and external factors). Internal factors include ownership, productivity, and bank size, while external factors include economy and technology (Zhao, 2019).
Kasman (2005) used the stochastic frontier model (SFA) to estimate cost efficiency and economies of scale in several Eastern European countries during the transition period. The results showed a variation in the impact of new environmental changes on banking efficiency, as it gave evidence of economies of scale for small and medium banks, while there is a lack of economies of scale for large banks. Fries and Taci (2005) shed light on the post-communist transition. By evaluating the cost efficiency of 289 banks in 15 Eastern European countries, the results of their study showed that the banks with the largest share of foreigners recorded lower costs and that the effect is not uniform between banking reform and cost reduction. Spulbăr and Niţoi (2014) estimated the impact of financial crises on the efficiency of banks during the transitional periods by using the sample of 481 commercial banks over the period 2005 to 2011 in 16 middle-income countries, from three countries developing regions. The results showed that banks with a prudent strategy and lower risks have higher cost efficiency.
Djalilov and Piesse (2019) estimated the banking efficiency and the restrictions that limit it during transitional periods by using a sample of 319 banks from 21 transitional economies for the period 2002-2014. The study found a difference in the effect of regulations on banking efficiency during transition periods. From the above literature, the different effects of transitional periods on the efficiency of banks appear, due to the different infrastructure of the financial sector and the ability of emerging economies to adapt to the transition mechanism.
Many previous studies have dealt with the cost efficiency of banks during the transitional period (Anwar, 2019; Asaftei & Kumbhakar, 2008; Blankson et al., 2022; Kasman and Yildirim, 2006). Some studies have analyzed the relationship between cost efficiency and Loans in banks (Abd-Karim et al., 2010; Berger & DeYoung, 1997; Fukuyama & Weber, 2008; Shamshur & Weill, 2019). However, other studies have dealt with the impact of co-ownership on the efficiency of banks in different countries (Hasan & Marton, 2003; Havrylchyk & Finance, 2006; Jemric & Vujcic, 2002; Kyj & Isik, 2008). Other literature included the relationship between Mergers & Acquisitions and efficiency (Akhavein et al., 1997; Borodin et al., 2020; Cuesta & Orea, 2002; Singh, 2009; Singh & Das, 2018). Commercial banks focus primarily on measuring cost efficiency to maximize profit, in contrast to the goals set by central banks that focus on financial stability (Goncharov et al., 2023). Therefore, we find many literatures that have addressed the importance of cost efficiency and its relationship with other variables. Some studies analyzed the relationship between cost efficiency and Loans in banks (Abd-Karim et al. 2010; Berger & DeYoung et al., 1997; Fukuyama & Weber., 2008; Rossi et al., 2005; Shamshur & Weill., 2019). Several studies documented the impact of co-ownership on the efficiency of banks in different countries (Hasan & Marton., 2003; Havrylchyk & Finance, 2006; Jemric & Vujcic, 2002; Kyj & Isik., 2008). Other literature included the relationship between Mergers & Acquisitions and efficiency (Akhavein et al., 1997; Borodin et al., 2020; Cuesta et al., 2002; Singh, 2009; Singh & Das, 2018). Previous studies dealt with the cost efficiency of banks during the transitional period (Anwar, 2019; Asaftei & Kumbhakar, 2008; Blankson et al., 2022; Kasman & Yildirim, 2006). In the next section, we include only some studies that measured cost efficiency.
Studies of industrial organizations have analyzed the relationship between concentration and profitability in banks to ascertain whether the market structure and its characteristics have a direct impact on bank performance and setting prices higher than the competition, such as higher loan limits and lower deposit rates (Gilbert & Banking, 1984). According to the hypothesis of structure-conduct-performance (SCP), there is a direct relationship between market power and profitability, as companies can set prices that are less favorable to consumers in more concentrated markets as a result of competition (Bain, 1956). It shows an increase in market concentration as a result of the gains achieved by companies. In other words, higher efficiency of companies leads to a higher percentage of profits, not as the sustainable traditional SCP model indicates (Edwards et al., 2006). According to the market power hypothesis that depends on the relevant theory (RMP), companies with large market shares exercise pricing advantages and desire a higher level of profits than those achieved from competition, in addition to the existence of evidence and a positive relationship between concentration and profits (Vennet, 2002).
Efficiency studies on the banking system, especially during the last two decades, gained importance through estimating the relative efficiency and volume savings that depend on the type of technological improvements (Amel et al., 2004). Efficiency studies of the banking system, especially during the last two decades, gained importance. It became an estimate of relative efficiency and volumetric savings, which depend on the type of technological improvements. Various methodologies were taken, such as the use of accounting ratios (return on assets, return on equity, cost-income ratio, etc.) Measurement of efficiency was taken in two directions and as a reaction to the interaction of market prices and the degree of competition by analyzing the bank's cost structure or profitability, adopting two approaches (maximizing profits or reducing costs) (Berger & Humphrey, 1997). The process of measuring cost efficiency allows for verifying that the bank has taken optimal behaviors and avoiding any deviations that may entrench inefficiency (Berger et al., 1993).
It was first formulated in the early works of (Edgeworth, 1881). From a practical point of view, the basis for measuring efficiency and productivity at the micro level begins with Farrell (1957). His contribution is highlighted by a new insight into two issues (defining efficiency and productivity) and (calculating benchmark technology and measures of efficiency) (Fiorentino et al., 2006).
The definition of banking efficiency is the extent to which banks succeed in allocating their resources (inputs) to produce products (outputs) to achieve their target objectives (Kumbhakar & Lovell, 2003). Within the general framework, efficiency is measured through two perspectives: technical efficiency and allocation efficiency. Technical efficiency refers to how well a certain set of inputs is utilized to achieve the desired level of output. A firm is said to be technically efficient if the firm produces maximum output from a minimum quantity of inputs, such as labor, capital, and technology. Allocation efficiency refers to the optimum conditions for input and output under a fixed product.
Banks aim to allocate input and output in their plans to reduce costs with certainty or increase profits. Banks aim to minimize costs and maximize revenues and profits by allocating inputs and outputs to achieve economic efficiency (cost, revenue, profit) within the frameworks of the two concepts of efficiency Berger and Humphrey (1997). While the nature of the methodologies for determining the efficiency of banks is distinct, in general, it includes two main methods (production and mediation) (Sathye, 2003). In the next part, we will explain some methodologies for measurement methods.
Efficiency Measurement
There are two main methods for measuring efficiency that are widely used in the literature parametric statistical methods that are based on econometrics and non-parametric methods that are modeled through linear programming techniques. Both of which have been adopted in banking studies are Stochastic Frontier Analysis (SFA) for the parametric method and data envelope analysis (DEA) for the non-parametric method. the differences between the two approaches are about assumptions of functional form and random errors (Fiorentino et al., 2006). Blankson et al. (2022) measured and evaluated the technical efficiency and cost-effectiveness of a sample of Ghanaian banks for the period between 2008-2019 by adopting data envelopment analysis (DEA), in addition to the determinants of efficiency. The results empirically showed a decrease in the average technical efficiency and cost efficiency during the study period and also showed that the size of the bank and the growth rate of output GDP plus inflation are the most important variables that determine cost efficiency.
Table 1
Efficiency Method
|
Deterministic methods |
Stochastic methods |
||
|
Ordinary least squares |
(OLS) |
Stochastic Frontier analysis |
(SFA) |
|
Corrected ordinary least squares |
(COLS) |
Thick Frontier Analysis |
(TFA) |
|
Modified ordinary least square |
(MOLS) |
Distribution free analysis |
(DFA) |
Non-Parametric Approaches
The non-parametric approach is based on the analysis of linear programming and is classified into two approaches. Envelopment analysis (DEA) and Free Disposal Hull (FDH). Data Envelopment Analysis (DEA) appeared in the literature by Charnes et al. (1978) paraphrasing research that has been suggested by Farrell (1957) a single-output, single-input radial measure of technical efficiency to the multiple-output, multiple-input case. Many followed this as a study (Charnes et al., 1994; Ray, 2004; Seiford & Thrall, 1990). The DEA calibrates the Technical Proficiency (TE) level which consists of a set of effective Pareto decision-making units (DMUs) in every case and these Pareto-efficient banks are situated on the efficient frontier (An et al., 2021).
Data Envelopment Analysis
Data Envelope Analysis (DEA) was introduced by Charnes et al. (1978) as a technique for measuring efficiency units (DMU) by comparing them with the most efficient units. This method makes it easier to obtain a relative measure of performance. The base model assumes input orientation and assumes a constant return to scale. This model uses notation as (CCR). Linear programming shows any of the decision-making (DMU) units determining the envelopment surface. The CCR model methodology focuses on the technical aspect of production through the behavioral assumption of companies based on (cost reduction and profit maximization). This model is characterized by simplicity, assuming a constant return to scale, and this assumption is appropriate when all units (banks) work on an optimal scale, but when looking at the environment surrounding banks, there is no optimal environment for work. These assumptions and limitations led to the proposal of an extension of the model for calculating variable returns to scale (VRS). VRS technology envelops data more closely than CRTS technology (Banker et al., 1984). It results in higher technical efficiency scores than CRTS Efficiency scores. After introducing the concept of efficiency and the DEA technique, in the next section, the methodology, data, and variables are presented in the analysis.
Cost efficiency is classified as a type of economic efficiency, which is a representation of what banks can achieve by reducing the cost of certain outputs or maximizing outputs for a specific cost (Kumbhakar & Lovell, 2003). There are many differences between cost and technical efficiency, such as the adoption of the price of inputs and the mechanism of dealing with banks that have multiple outputs. Data envelope analysis (DEA) can be used to determine the efficiency of allocation, which is used to determine the goal of banks in reducing the costs, that is why this study considered the efficiency-oriented to inputs. Cost-effectiveness measures how close the bank is to adopting best practices to get a lower cost (Charnes et al., 1978).
Suppose we have N banks that depend on inputs represented by a vector, we denote the inputs and the outputs , and the model is represented by linear programming as follows:
Minimize (γi,xi*) w ́xi* (1)
Subject to -yi+Yγ ≥ 0 (2)
xi* -Xγ ≥ 0 (3)
NI ́γ=1 (4)
γ ≥ 0 ,i=1 ,…,N
xi* refer to the Cost Reduction Vector for Input Quantities of First and Second Bank, i=1 ,…,N , γ is N x 1 constant vector. cost efficiency can be calculated by the ratio of minimum cost to actual cost, it is between zero and one. The cost efficiency DMU0can be defined as
CE=(w ́i xi**)/(w ́i xi) (5)
In this function, the vector xi* is the vector referred to as banks output production can we represented as follows xi*=x1*,,,,,,,,,,xn*)∈ R+n and xi is the vector referred to as banks input represented as follows, xi=x1 ,,,,,,,,xn)∈ R+n while w ́i =(w1 ,,,,,,,,wn)∈ R+n) is the price of input. Cost efficiency is measured by the distance between the actual cost of banks and the cost limits of best practices. The level of efficiency is between 0 and 1 The degree of homogeneity for inputs is 1, while the degree of homogeneity for outputs is 0. In other words, wasting all the inputs will lead to doubling the cost and cutting cost efficiency in half, and if all input prices are doubled, there will be no impact on cost efficiency. The level of cost efficiency depends on the input change prices.
This study analyzes the data of 20 Iraqi commercial banks from the years 2010-2020, depending on the availability of the data that could be accessed. Governmental banks and some private banks were excluded due to lack of data. The sample of the study is balanced data collected from the banks' balance sheets, the profit and loss account, and the annual bulletins of the Iraq Stock Exchange. We employ the intermediation approach to measure bank cost efficiency. Therefore, banks can be seen as primarily intermediating funds between savers and investors (Sealey & Lindley, 1977).
According to Ahn and Le (2014), the intermediation approach gains the widest application in DEA-based studies, followed by the production approach, while the value-added approach and the user cost approach are still of limited use. The number of applications of the intermediation approach overwhelmingly dominates that of the production approach for studies of banking institutions, while at the branch level, the production approach is a little more widely applied than the intermediation approach.
To determine the inputs and outputs for cost efficiency, Input-oriented by adopting Data Envelopment Analysis (DEA) model was utilized to conduct the research. in line with the literature (Adjei-Frimpong et al., 2014). Three categories of inputs and outputs are identified choose variables for calculating the cost efficiency of Iraqi banks, as in Table 2.
Table 2
Description of the Study Variables
|
Variable |
Description |
|
Inputs |
|
|
Deposits |
Customers deposits |
|
Labor |
Personnel expenses of bank staff such as salaries, wages, and benefits |
|
Assets |
total fixed assets |
|
Input prices |
|
|
Price of deposits |
Interest expenses divided by total deposits |
|
Price of labor |
Personnel expenses divided by the total assets |
|
Price of capital |
Capital-related expenses (operating expenses - personnel expenses) divided by total fixed assets |
|
Outputs |
|
|
Loans |
Total customers' loans |
|
Other earning assets |
Banks' investments in different types of securities (e.g. government securities, bonds, Treasury bill, and equity investment) |
Table 3
Descriptive Statistics of Inputs and Outputs
|
Observations |
Mean |
Maximum |
Minimum |
Std. Dev. |
|
|
Loans |
215 |
136544.20 |
537759.0 |
12352.0 |
111800.2 |
|
Other earning assets |
215 |
61252.53 |
698695.0 |
106.0000 |
111730.8 |
|
Deposits |
215 |
286507.10 |
1491599. |
975.0000 |
272887.1 |
|
Labor |
215 |
4689.14 |
16833.00 |
497.0000 |
3295.835 |
|
Price of capital |
215 |
0.18 |
5.956185 |
0.008933 |
0.483230 |
|
Price of deposits |
215 |
0.01 |
0.085009 |
0.000432 |
0.015944 |
|
Price of labor |
215 |
0.62 |
0.708696 |
0.552118 |
0.031844 |
Notes. All variables are measured in millions of Iraqi dinars, Price of capital, Price of deposits, and Price of labor measured in precent
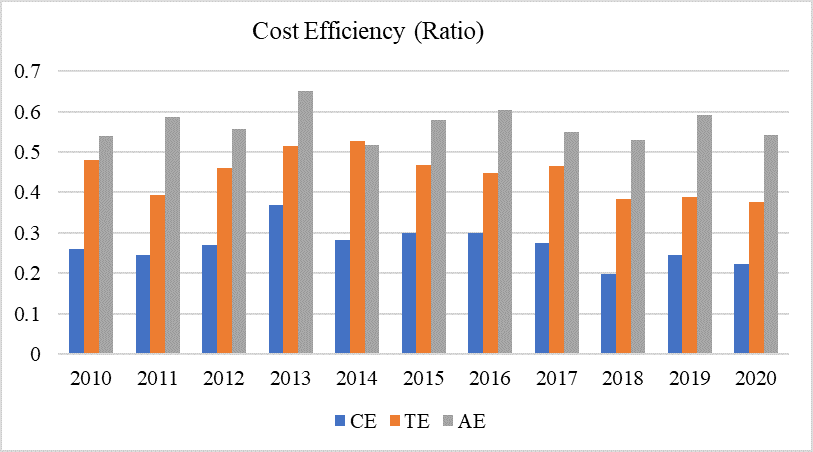
Cost efficiency is measured within the range of 0 and 1. As the number is closer to 1, this is an indication of the least efficiency of the bank, while closer to 0 indicates an increase in the cost efficiency of the bank. In this study, the cost efficiency of 20 Iraqi banks was measured for 2010-2020. Table 4 displays the results of Cost Efficiency (CE), which shows that the degree of cost efficiency of Iraqi scheduled commercial banks was 0.2608 in 2010, while technical efficiency (TE) degree was 0.4811 for the same year. Furthermore, Allocative efficiency (AE) was 0.54065 in 2010. The rates of price efficiency, technological efficiency in addition to allocation efficiency are close to the scores of 2010. It was also noted that the average cost efficiency of banks remained stable at a good level, considering the geopolitical crises in Iraq during the year 2014 as well as for the year 2019-20 during the COVID-19 pandemic.
Table 4
Cost Efficiency Results for Iraqi Commercial Banks 2010-2020
|
Year |
CE |
TE |
AE |
|
2010 |
0.2608 |
0.4811 |
0.5406 |
|
2011 |
0.2462 |
0.3940 |
0.5872 |
|
2012 |
0.2703 |
0.4594 |
0.5567 |
|
2013 |
0.3696 |
0.5153 |
0.6501 |
|
2014 |
0.2818 |
0.5273 |
0.5186 |
|
2015 |
0.299 |
0.4691 |
0.5803 |
|
2016 |
0.3003 |
0.4471 |
0.6041 |
|
2017 |
0.2748 |
0.4652 |
0.5491 |
|
2018 |
0.1992 |
0.3825 |
0.5286 |
|
2019 |
0.2444 |
0.3878 |
0.5914 |
|
2020 |
0.2227 |
0.3758 |
0.5411 |
Note. Values for cost efficiency (CE), technical efficiency (TE), and allocative efficiency (AE)
Figure 1
Clustered Columns Chart for Cost Efficiency
A clustered column chart for cost efficiency was presented to compare the value of cross categories of cost efficiency during 2010-2020 as indicated in Figure 1. Allocation efficiency showed the highest level in 2013. However, the technical efficiency was highest in the year 2014. Moreover, cost efficiency gave very similar results during the study period.
Analyzing and measuring the market power of banks was and still is an important topic in economic literature. The argument is that increasing competition in the market would lead to an increased efficiency of the market. On the other hand, alternative views considered that there is a positive -relationship between market power and interest rates, as a result, it will be difficult for customers to recover loans, the volume of negative effects will increase, ensuring competition and more advantages for both banks and customers (Coccorese, 2014). Prior literature has provided diverse research concerning the strength of the market, and many indicators have been used by empirical and theoretical interests, such as the Lerner index (Lerner, 1934) , Four-firm (or k-firm) concentration ratio (Saving, 1970), and Herfindahl-Hirschman index (Cowling & Waterson, 1976)
The Lerner Index is a measure of market power widely used in economic literature. A discussion began historically (Landes & Posner, 1981, Lerner 1934) and theoretically through various studies and followed by Elzinga and Mills (2011), Giocoli (2012), and Shaffer and Spierdijk (2017). Subsequently, many studies on banks adopted the Lerner index to measure the power of the market and the index of competition (Biswas, 2019; Clerides et al., 2015; Feng & Wang, 2018; Hainz et al., 2013; Hirata & Ojima, 2020; Memanova & Mylonidis, 2020). Lerner index is a measure by which the gap between price and cost is monotonically related to consumer welfare losses from the market power of specific cost and demand functions.
The Lerner Index is measured as (P - MC)/P, which is often used as a measure variable of a company's power in the marketplace.
To measure the divergence of the industry from the competition, Lerner proposed an index to measure the market power. The value of the Lerner index ranges from 0-1. It takes a value of zero where P = MC, which indicates that there is no pricing power for the company. A Lerner index that is closer to one denotes a bigger price markup above marginal costs, thus, indicating that the company has more market power (Ariss, 2010). A Lerner index = 0 often denotes perfect competition, whereas a Lerner index = 1 denotes a monopoly. A higher Lerner index indicates less competition because it is an inverse measure of it (Pruteanu et al., 2007).
In this study, follow up on some previous literature to measure the power of the industry index (Clerides et al., 2015; Rakshit & Bardhan, 2022; Tan & Floros, 2018). The LI calculation to Measurement of bank competition (banking industry power) can be written as follows:
Lerner indexit = (p(i,t)-mc(i,t))/(mc(i,t)),i=1,….,N,T=1 ,….,N (6)
Where Pi, t denotes the output prices set by the bank i at the time t and MCi,t represents the marginal cost of the bank i at time t. The marginal cost of the bank cannot be observed directly, so the total cost is determined first, and then the marginal cost. The following table shows the inputs and outputs. Table 4 shows the inputs and outputs.
Table 4
Inputs and Outputs
|
Price |
the ratio of total revenues to total earning assets total revenues = interest income + non-interest operating income +equity-accounted profit/loss operating income |
|
marginal cost |
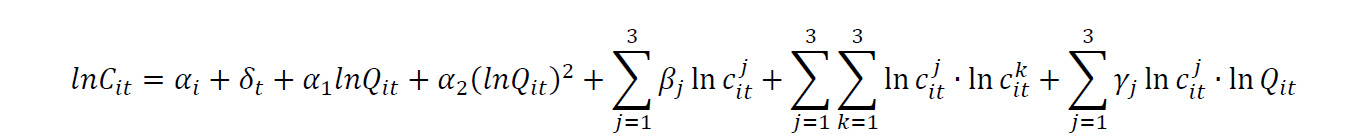
the estimation of a translog production function at the bank level for each bank, including bank and time fixed effects |
|
denotes the total operating costs |
|
|
defines the amount of total assets |
|
|
The price of labor is constructed as the ratio of personnel expenses over total assets |
|
|
The price of fixed assets is computed as the ratio of other operating expenses to total assets. |
|
|
The price of funding is defined as the ratio of total interest expenses to the total amount of deposits, money market, and short-term funding |
the input prices indicate the price of fixed assets c^(fixed )the price of labor (c^(labor )r), and the price of funding c^(fund )
The marginal cost is computed as follows:: MC=TC/Q [α1+α2 lnQ+∑(i=1)3γi lnwj] (8)
The following table shows some descriptive statistics.
Table 5
Variables Descriptive Statistics
|
Variables |
Mean |
Maximum |
Minimum |
Std. Dev. |
|
PRICE |
0.0542 |
0.1615 |
0.0020 |
0.0304 |
|
Q |
5.7201 |
6.2642 |
4.8740 |
0.2521 |
|
TC |
19951.3 |
115524 |
2115 |
15547.0 |
|
0.0163 |
0.0850 |
0.0030 |
0.01594 |
|
|
0.0206 |
0.1277 |
0.0004 |
0.01505 |
|
|
0.0078 |
0.0239 |
0.0018 |
0.00333 |
|
|
Observations |
215 |
215 |
215 |
215 |
Note. All variables are measured in percent, TC is measured in millions of Iraqi dinars
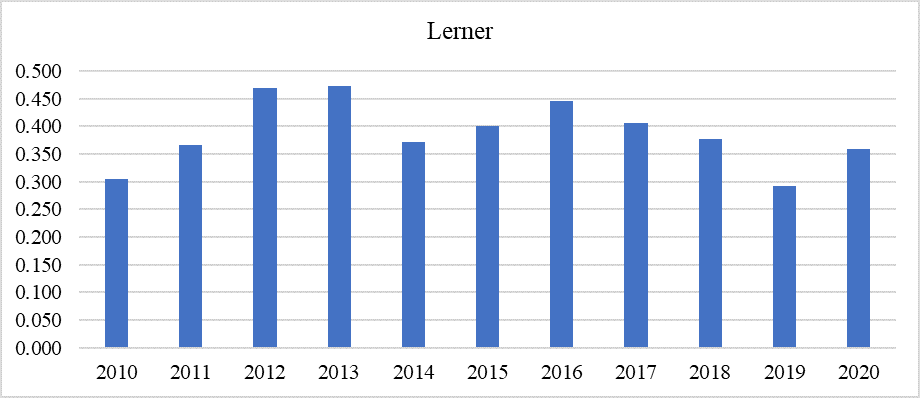
At first glance, the results cannot discern a clear trend in the evolution of the Lerner index. The competition index, indicated that the market power of the banking sector in Iraq kept on fluctuating, and sometimes it dealt with perfect competition, and sometimes it goes up. This is an indication of the inability of any banks to fully influence the trends of competition between the banking sector in Iraq and more than that it is also an indication of the possibility of entering banks with greater weight in the sector. The following Table 6 shows the results of the Lerner index to measure the power of the banking market in Iraq.
Table 6
Lerner Index Results
|
Years |
2010 |
2011 |
2012 |
2013 |
2014 |
2015 |
2016 |
2017 |
2018 |
2019 |
2020 |
|
Lerner |
0.304 |
0.365 |
0.470 |
0.473 |
0.372 |
0.400 |
0.445 |
0.406 |
0.377 |
0.293 |
0.360 |
Clustered columns chart for market power were used to compare the value of cross categories of market power from 2010-2020. The results of the market power index show that there is no concentration in the market and that the market competition indexes range between 0.30 and 0.45, which shows that the market is competitive and price elasticity is greater than 1. Moreover, it was also identified that from 2010 to 2017, there was a slight increase in the value of the learner index, which means that there was a slight decrease in competition. However, in 2019, the competition was higher as the value of the learner index dropped down from 0.30. In general, the results of the study give the impression that the mechanisms of competition or monopoly did not control the direction of the banking sector in Iraq.
Figure 2
Lerner Index
Cost-effectiveness is essential to the banking sector because it boosts profitability, increases customer value, manages risks, ensures regulatory compliance, encourages innovation, and adds value to shareholders. It is a crucial component of sustainable banking operations and aids banks in maintaining their competitiveness in a financial environment that is continually changing. Therefore, this study analyzes cost efficiency, price, and market power during the economic transitional period of Iraq. The study relied on the annual data of 20 commercial banks of Iraq for the period 2010-2020. Measuring the cost-effectiveness and strength of the banking sector during their transitional periods requires verification of environmental impacts and degrees of the efficiency varying according to the environmental influences. The results of the study found that the degrees of cost inefficiency of commercial banks in Iraq are very high. The Lerner index to measure the power of behavior showed varying results for the preceding years, which is an indication of financial instability in the banking sector of Iraq. The learner index depicts that banks are more competitive and stable in 2019 and 2020. A previous study also suggest that Islamic banks are more stable in the time of crisis than the conventional banks (Fakhfekh et al., 2016). The empirically achieved results gave indications of the importance of financial stability in enhancing the efficiency of the financial sector, especially the banking sector. Additionally, they indicated the inevitability of gradual transitional economies to reach optimal markets.
This study recommends policymakers and those interested in developing the financial sectors about the importance of the banking sector to adopt beneficial mechanisms to achieve a balance between return and continuous development. It was also observed that it important to conduct studies on the efficiency of the banking sector and to establish a database that serves as a robust system for the decision-makers and investors. This research also directs policymakers to invest in digital technologies and self-services of customers to operate at low cost. This study is limited only to commercial banks of Iraq and measured their cost efficiency. Moreover, the current study measured cost efficiency through the market power index. In the future, researchers can extend this study to other Middle Eastern regions by using panel data and can compare and contrast the banking sector efficiency of Middle Eastern countries.
Adjei-Frimpong, K., Gan, C., & Hu, B. (2014). Cost efficiency of Ghana's banking industry: Panel data analysis. The International Journal of Business and Finance Research, 8(2), 69–86. https://ssrn.com/abstract=2322961
Ahn, H., & Le, M. H. (2014). An insight into the specification of the input-output set for DEA-based bank efficiency measurement. Management Review Quarterly, 64, 3–37. https://doi.org/10.1007/s11301-013-0098-9
Akhavein, J. D., Berger, A. N., & Humphrey, D. B. (1997). The effects of megamergers on efficiency and prices: Evidence from a bank profit function. Review of Industrial Organization, 12, 95–139. https://doi.org/10.1023/A:1007760924829
An, Q., Tao, X., & Xiong, B. (2021). Benchmarking with data envelopment analysis: An agency perspective. Omega, 101(2), Article e102235. https://doi.org/10.1016/j.omega.2020.102235
Amel, D., Barnes, C., Panetta, F., & Salleo, C. (2004). Consolidation and efficiency in the financial sector: A review of the international evidence. Journal of Banking & Finance, 28(10), 2493–2519. https://doi.org/10.1016/j.jbankfin.2003.10.013
Anwar, M. (2019). Cost efficiency performance of Indonesian banks over the recovery period: A stochastic frontier analysis. The Social Science Journal, 56(3), 377–389. https://doi.org/10.1016/j.soscij.2018.08.002
Ariss, R. T. (2010). On the implications of market power in banking: Evidence from developing countries. Journal of Banking & Finance, 34(4), 765–775. https://doi.org/10.1016/j.jbankfin.2009.09.004
Asaftei, G., & Kumbhakar, S. C. (2008). Regulation and efficiency in transition: The case of Romanian banks. Journal of Regulatory Economics, 33, 253–282. https://doi.org/10.1007/s11149-007-9041-0
Bain, J. S. (1956). Advantages of the large firm: Production, distribution, and sales promotion. Journal of Marketing, 20(4), 336–346. https://doi.org/10.1177/002224295602000402
Banker, R. D., Charnes, A., & Cooper, W. W. (1984). Some models for estimating technical and scale inefficiencies in data envelopment analysis. Management Science, 30(9), 1078–1092. https://doi.org/10.1287/mnsc.30.9.1078
Berger, A. N., & DeYoung, R. (1997). Problem loans and cost efficiency in commercial banks. Journal of Banking & Finance, 21(6), 849–870. https://doi.org/10.1016/S0378-4266(97)00003-4
Berger, A. N., Hancock, D., & Humphrey, D. B. (1993). Bank efficiency derived from the profit function. Journal of Banking & Finance, 17(2–3), 317–347. https://doi.org/10.1016/0378-4266(93)90035-C
Berger, A. N., & Humphrey, D. B. (1997). Efficiency of financial institutions: International survey and directions for future research. European Journal of Operational Research, 98(2), 175–212. https://doi.org/10.1016/S0377-2217(96)00342-6
Biswas, S. S. (2019). Creditor rights and the market power-stability relationship in banking. Journal of Financial Stability, 40, 53–63. https://doi.org/10.1016/j.jfs.2017.10.001
Blankson, N., Anarfo, E. B., Amewu, G., & Doabil, L. (2022). Examining the determinants of bank efficiency in transition: Empirical evidence from Ghana. Heliyon, 8(8), Article e10156. https://doi.org/10.1016/j.heliyon.2022.e10156
Borodin, A., Sayabek, Z. S., Islyam, G., & Panaedova, G. (2020). Impact of mergers and acquisitions on companies' financial performance. Journal of International Studies, 13(2), 32–47. https://doi.org/10.14254/2071-8330.2020/13-2/3
Charnes, A., Cooper, W. W., Lewin, A. Y., & Seiford, L. M. (1994). Data envelopment analysis: Theory, methodology and applications. Spinger.
Charnes, A., Cooper, W. W., & Rhodes, E. (1978). Measuring the efficiency of decision making units. European Journal of Operational Research, 2(6), 429–444. https://doi.org/10.1016/0377-2217(78)90138-8
Chick, V. (1993). The evolution of the banking system and the theory of monetary policy. In S. F. Frowen (Ed.), Monetary theory and monetary policy. Palgrave Makmillan. https://doi.org/10.1007/978-1-349-23096-9_6
Clerides, S., Delis, M. D., & Kokas, S. (2015). A new data set on competition in national banking markets. Financial Markets, Institutions & Instruments, 24(2-3), 267–311. https://doi.org/10.1111/fmii.12030
Coccorese, P. (2014). Estimating the Lerner index for the banking industry: A stochastic frontier approach. Applied Financial Economics, 24(2), 73–88. https://doi.org/10.1080/09603107.2013.866202
Cowling, K., & Waterson, M. (1976). Price-cost margins and market structure. Economica, 43(171), 267–274. https://doi.org/10.2307/2553125
Cuesta, R. A., & Orea, L. (2002). Mergers and technical efficiency in Spanish savings banks: A stochastic distance function approach. Journal of Banking & Finance, 26(12), 2231–2247. https://doi.org/10.1016/S0378-4266(01)00184-4
Djalilov, K., & Piesse, J. (2019). Bank regulation and efficiency: Evidence from transition countries. International Review of Economics & Finance, 64, 308–322. https://doi.org/10.1016/j.iref.2019.07.003
Dow, S. C., Ghosh, D., & Ruziev, K. (2008). A stages approach to banking development in transition economies. Journal of Post Keynesian Economics, 31(1), 3–33.
Edgeworth, F. Y. (1881). Mathematical psychics: An essay on the application of mathematics to the moral sciences (Vol. 10). CK Paul.
Edwards, F., & Mishkin, F. S. (1993). The decline in the traditional role of banks: implications for financial stability and regulatory policy (National Bureau of Economic Research Working Paper No. w4993). https://papers.ssrn.com/sol3/papers.cfm?abstract_id=226591
Edwards, S., Allen, A. J., & Shaik, S. (2006). Market structure conduct performance (SCP) hypothesis revisited using stochastic frontier efficiency analysis. Agricultural and Applied Economics Association (AAEA). https://ideas.repec.org/p/ags/aaea06/21350.html
Elzinga, K. G., & Mills, D. E. (2011). The Lerner index of monopoly power: Origins and uses. American Economic Review, 101(3), 558–564. https://doi.org/10.1257/aer.101.3.558
Fakhfekh, M., Hachicha, N., Jawadi, F., Selmi, N., & Cheffou, A. I. (2016). Measuring volatility persistence for conventional and Islamic banks: An FI-EGARCH approach. Emerging Markets Review, 27, 84–99. https://doi.org/10.1016/j.ememar.2016.03.004
Farrell, M. J. (1957). The measurement of productive efficiency. Journal of the Royal Statistical Society: Series A (General), 120(3), 253–281. https://doi.org/10.2307/2343100
Feng, G., & Wang, C. (2018). Why European banks are less profitable than US banks: A decomposition approach. Journal of Banking & Finance, 90, 1–16. https://doi.org/10.1016/j.jbankfin.2018.02.017
Fiorentino, E., Karmann, A., & Koetter, M. (2006). The cost efficiency of German banks: a comparison of SFA and DEA. SSRN. http://dx.doi.org/10.2139/ssrn.947340
Fries, S., & Taci, A. (2005). Cost efficiency of banks in transition: Evidence from 289 banks in 15 post-communist countries. Journal of Banking & Finance, 29(1), 55–81. https://doi.org/10.1016/j.jbankfin.2004.06.016
Fukuyama, H., & Weber, W. L. (2008). Estimating inefficiency, technological change and shadow prices of problem loans for regional banks and Shinkin banks in Japan. The Open Management Journal, 1(1), 1–11. https://doi.org/10.2174/1874948800801010001
Gilbert, R. A. (1984). Bank market structure and competition: A survey. Journal of Money, Credit and Banking, 16(4), 617–645. https://doi.org/10.2307/1992096
Giocoli, N. (2012). Who invented the Lerner index? Luigi Amoroso, the dominant firm model, and the measurement of market power. Review of Industrial Organization, 41, 181–191. https://doi.org/10.1007/s11151-012-9355-7
Goncharov, I., Ioannidou, V., & Schmalz, M. C. (2023). (Why) do central banks care about their profits? The Journal of Finance, 78(5), 2991–3045. https://doi.org/10.1111/jofi.13257
Hainz, C., Weill, L., & Godlewski, C. J. (2013). Bank competition and collateral: Theory and evidence. Journal of Financial Services Research, 44(2), 131–148. https://doi.org/10.1007/s10693-012-0141-3
Hasan, I., & Marton, K. (2003). Development and efficiency of the banking sector in a transitional economy: Hungarian experience. Journal of Banking & Finance, 27(12), 2249–2271. https://doi.org/10.1016/S0378-4266(02)00328-X
Havrylchyk, O. (2006). Efficiency of the Polish banking industry: Foreign versus domestic banks. Journal of Banking & Finance, 30(7), 1975–1996. https://doi.org/10.1016/j.jbankfin.2005.07.009
Hirata, W., & Ojima, M. (2020). Competition and bank systemic risk: New evidence from Japan's regional banking. Pacific-Basin Finance Journal, 60, Article e101283. https://doi.org/10.1016/j.pacfin.2020.101283
Jemric, I., & Vujcic, B. (2002). Efficiency of banks in Croatia: A DEA approach. Comparative Economic Studies, 44, 169–193. https://doi.org/10.1057/ces.2002.13
Julian, S. D., & Ofori‐dankwa, J. C. (2013). Financial resource availability and corporate social responsibility expenditures in a sub‐Saharan economy: The institutional difference hypothesis. Strategic Management Journal, 34(11), 1314–1330. https://doi.org/10.1002/smj.2070
Karim, M. Z. A., Chan, S., & Hassan, S. (2010). Bank efficiency and non-performing loans: Evidence from Malaysia and Singapore. Prague Economic Papers, 2, 118–132. https://doi.org/10.18267/j.pep.367
Kasman, A., & Yildirim, C. (2006). Cost and profit efficiencies in transition banking: The case of new EU members. Applied Economics, 38(9), 1079–1090. https://doi.org/10.1080/00036840600639022
Kasman, A. (2005). Efficiency and scale economies in transition economies: Evidence from Poland and the Czech Republic. Emerging Markets Finance and Trade, 41(2), 60–81.
Kumbhakar, S. C., & Lovell, C. K. (2003). Stochastic frontier analysis. Cambridge university press.
Kyj, L., & Isik, I. (2008). Bank x-efficiency in Ukraine: An analysis of service characteristics and ownership. Journal of Economics and Business, 60(4), 369–393. https://doi.org/10.1016/j.jeconbus.2007.05.002
Landes, W. M., & Posner, R. A. (1981). Market power in antitrust cases. Harvard L.
Lerner, A. P. (1934). The concept of monopoly and the measurement of monopoly power. Macmillan Education UK.
Memanova, T., & Mylonidis, N. (2020). Exploring the nexus between bank market power and exports. Economic Modelling, 84, 222–233. https://doi.org/10.1016/j.econmod.2019.04.012
Pruteanu-Podpiera, A., Weill, L., & Schobert, F. (2007). Market power and efficiency in the Czech banking sector. CNB.
Rakshit, B., & Bardhan, S. (2022). An empirical investigation of the effects of competition, efficiency and risk-taking on profitability: An application in Indian banking. Journal of Economics and Business, 118, Article e106022. https://doi.org/10.1016/j.jeconbus.2021.106022
Ray, S. C. (2004). Data envelopment analysis: Theory and techniques for economics and operations research. Cambridge university press.
Rossi, S. P. S., Schwaiger, M., & Winkler, G. (2005). Managerial behavior and cost/profit efficiency in the banking sectors of Central and Eastern European countries (Oesterreichische National Bank Working Paper No. 96). https://www.oenb.at/dam/jcr:0c81fef8-c381-4dc8-a527-7462da792b43/wp96_tcm16-27319.pdf
Sathye, M. (2003). Efficiency of banks in a developing economy: The case of India. European Journal of Operational Research, 148(3), 662–671. https://doi.org/10.1016/S0377-2217(02)00471-X
Saving, T. R. (1970). Concentration ratios and the degree of monopoly. International Economic Review, 11(1), 139–146. https://doi.org/10.2307/2525343
Sealey, C. W., Jr., & Lindley, J. T. (1977). Inputs, outputs, and a theory of production and cost at depository financial institutions. The Journal of Finance, 32(4), 1251–1266. https://doi.org/10.1111/j.1540-6261.1977.tb03324.x
Seiford, L. M., & Thrall, R. M. (1990). Recent developments in DEA: The mathematical programming approach to frontier analysis. Journal of Econometrics, 46(1–2), 7–38. https://doi.org/10.1016/0304-4076(90)90045-U
Shaffer, S., & Spierdijk, L. (2017). Market power: Competition among measures. In J. A. Bikker & L. Spierdijk (Ed.), Handbook of competition in banking and finance (pp. 11–26). Edward Elgar Publishing.
Shamshur, A., & Weill, L. (2019). Does bank efficiency influence the cost of credit? Journal of Banking & Finance, 105, 62–73. https://doi.org/10.1016/j.jbankfin.2019.05.002
Singh, P. (2009). Mergers in Indian banking: Impact study using DEA analysis. South Asian Journal of Management, 16(2). 7–27.
Singh, S., & Das, S. (2018). Impact of post-merger and acquisition activities on the financial performance of banks: A study of Indian private sector and public sector banks. Revista Espacios Magazine, 39(26), Article e25. https://doi.org/10.1177/23197145211053400
Spulbăr, C., & Niţoi, M. (2014). Determinants of bank cost efficiency in transition economies: Evidence for Latin America, Central and Eastern Europe and South-East Asia. Applied Economics, 46(16), 1940–1952. https://doi.org/10.1080/00036846.2014.889806
Tan, Y., & Floros, C. (2018). Risk, competition and efficiency in banking: Evidence from China. Global Finance Journal, 35, 223–236. https://doi.org/10.1016/j.gfj.2017.12.001
Vennet, R. V. (2002). Cost and profit efficiency of financial conglomerates and universal banks in Europe. Journal of Money, Credit and Banking, 34(1), 254–282. https://doi.org/10.1353/mcb.2002.0036
Zhao, B. (2019). Efficiency and productivity of Chinese national and regional banks [Doctoral dissertation, Loughborough University]. Loughborough University Repository. https://doi.org/10.26174/thesis.lboro.10315994.v1