A Low-Risk vs. Market-Based Portfolio in Equity Market: Evidence from Global Financial Crisis and Global Pandemic Crisis in Pakistan
Muhammad Wajid Raza1, Bahrawar Said2*, and Ijaz Hassan1
1Department of Management Sciences, Shaheed Benazir Bhutto University, Sheringal Dir, Pakistan
2Department of Management Sciences, University of Wah, Wah Cantt, Pakistan
Abstract
The study tests the characteristics of a low-risk-based portfolio compared with a broader market-capitalization weighted portfolio (benchmark portfolio) in Pakistan Stock Exchange (PSX). This study considers all listed stocks at PSX as an investment universe. Low-risk stocks were assessed by measuring the idiosyncratic risk. Extensive back-tests were performed to compare the financial performance for 2005-2022. Results show that the market-capitalization-based portfolio outperforms the low-risk-based portfolio in terms of annualized returns. However, the latter significantly reduces the risk and leads to superior risk-adjusted performance. The low-risk portfolio indicates resilience to market turmoil and reduces the downside risk of the market portfolio. The risk-return relationship appears to be stronger in the case of idiosyncrasies. The effect of the GFC-2008 and the GPC-2020 are also investigated; the results indicate that a low-risk-based portfolio carries higher returns while the market capitalization portfolio carries relatively higher risk. Both individuals and institutional investors can enhance the risk-adjusted performance of their portfolios by adopting a low-risk-based strategy.
JEL Codes: G11 Portfolio Choice & Investment Decision
1. Introduction
The finance theory assumes a positive link between risk and return. It means that the higher the risk, the higher the return, which infers that bearing a higher risk will be rewarded with a higher return. This illustrious risk return trade-off remained the focus of theoretical and empirical research in financial markets for the last several decades (Lintner, 1965; Markowitz, 1965; Sharpe, 1964). To measure the risk factor, Harry Markowitz, the founder of the "Modern Portfolio Theory," in his article Markowitz (1952), developed his pioneering portfolio model known as "Markowitz Portfolio Selection." He derived the expected rate of return and risk for a portfolio of assets. Markowitz (1952) measured risk as volatility in stock prices. He assessed volatility with the help of standard deviation and concluded that while making investment decisions, investors maximize expected returns for a given amount of portfolio risk, which leads to the positively sloped and concave efficient frontier.
Capital Market Theory and Asset Pricing Theory are two famous theories for evaluating risky assets. CMT builds on portfolio theory to develop models for pricing risky assets, including the CAPM introduced by Sharpe (1964), Lintner (1965), and Mossin (1966), which posits a positive linear relationship between risk and return. However, in the 1970s, CAPM was criticized by researchers like Black et al. (1972), Fama and French (1993), and Banz (1981), who identified anomalies indicating that factors such as firm size, book-to-market ratio, price-to-earnings ratio, and past performance also affect stock returns. Over the years, many anomalies have suggested that CAPM fails to explain differences in returns adequately. Empirical studies have shown that low-beta stocks may outperform predictions of the CAPM under borrowing constraints, while high-beta stocks may underperform. Additionally, the relationship between beta stocks and returns appears flatter than the model implies. These limitations have led to numerous papers proposing extensions to the model by including additional risk factors and critiquing its assumptions.
The CAPM was developed by Sharpe (1964) and expanded by Lintner (1965), while Black et al. (1972) posited a positive linear relationship between beta (systematic risk) and expected stock returns. While diversification is the main essence of CAPM, which aims to minimize idiosyncratic risk and maximize returns, empirical evidence shows that portfolios often remain poorly diversified. This leads to the notion that unsystematic risk, combined with beta stocks, positively correlates with expected returns. Studies have found a strong linkage between average returns and value at risk, consistent across different investment periods and loss probabilities (Chen et al., 2014; Yang & Ma, 2021). The CAPM was criticized when researchers, such as Black et al. (1972) and Fama and French (1993), reported anomalies, saying that firms' characteristics such as firm size, price-to-earnings ratio, book-to-market value, and prior return performance are also key factors in explaining the cross-section returns. A firm's low price-to-earnings ratio (P/E) yields higher returns than a high P/E ratio. According to Fama and French (1992) and Bradrania et al. (2023), anomalies indicate that beta is not the only factor that describes the returns. The existence of many anomalies questions the explanatory power of CAPM and suggests that it fails to explain the cross-section of stock returns fully. Several studies, such as Black et al. (1972) and Fama and French (1992), have empirically shown that the relationship between beta and returns in the CAPM is flatter than the model suggests. These findings suggest that beta alone does not fully explain stock returns, and studies indicate that the relationship between beta and returns is less steep than CAPM initially suggested.
Stocks with low volatility have outperformed high-volatility stocks during the last several decades. At the same time, the low-risk anomaly has gained remarkable interest. The low-risk anomaly in equity markets refers to the experiential phenomenon in which assets with low risk, regarded as having lower volatility, tend to provide higher risk-adjusted returns related to high-risk assets. This phenomenon contradicts the traditional financial theory (CAPM). One of the key features: Investing in lower volatility (beta) is that investors can achieve better returns without taking on the expected level of risk. CAPM suggests a positive linear relationship between beta and expected returns. The low-risk anomaly challenges this assumption, showing that low-beta stocks often yield higher returns than predicted. This phenomenon has been observed across several market conditions, i.e., crises, in which investors seek safety and stability. The low-risk anomaly has led to the popularity of low-volatility investment strategies, where portfolios favor low-risk stocks, aiming to achieve better returns with lower risk. The anomaly has been documented in several stock markets globally, indicating its robustness across different economic environments. Low-volatility investing provides high returns at lower risk as compared to traditional market-cap-weighted indexing. The anomaly persists across time and countries, as Ang et al. (2009) explains how low-volatility investing may lead to high returns. Since the market factor is reduced, volatility is lower, whereas returns are high because of Sharpe's ratio factors like beating beta (BAB), value, and duration; for example, Frazzini and Pedersen (2014). The persistence of low-risk anomaly has been perceived in international bonds, stocks, currencies, and credit derivatives (Frazzini & Pedersen, 2014; Traut, 2023). Blitz and Groot (2014) provide empirical evidence from commodities markets, while Cao and Han (2013) focus on options markets. Frazzini and Pedersen's (2014) article tries to illuminate this anomaly with leverage constraints.
To conclude the discussion, it is stated that a low-risk anomaly exists, as confirmed by many studies conducted in different geographical locations (USA and other emerging and developed markets) with different periods using various methodological choices. Most of the previous studies, e.g., Black et al. (1972), Blitz and Van Vliet (2007), Boudt et al. (2019), Chow et al. (2014), Fama and French (1992), Haugen and Heins (1975), Raza and Ashraf (2019), and Traut (2023) focus on developed countries, where equity markets are relatively stable. However, fewer studies have been conducted in the context of emerging markets; for example, (Baker & Haugen, 2012; Blitz et al., 2013; Joshipura & Joshipura, 2019). A review of the literature reveals a few reasons for conducting this study. First of all, this study acts as a pioneer in the field by focusing specifically on PSX. Furthermore, PSX shows tremendous growth, and the index has reached 70000 points in 2024. This indicates that the PSX exhibited relatively high volatility in this period. This study aims to address significant gaps in the literature on low-risk anomalies and investigate this phenomenon within the context of the PSX. This study offers insights into how distinct characteristics, such as high volatility, specific governance challenges, and unique investor behavior, influence the performance of low-risk investment strategies. By focusing on these aspects, the research seeks to contribute eloquently to understanding the low-risk anomaly, thereby enhancing our grasp of how emerging markets operate under different risk-return dynamics. This research is timely and essential for investors and policymakers navigating the complexities of equity markets in emerging economies.
The equity markets in developed economies are relatively stable compared to less developed economies. Bekaert et al. (2006) argue that the market integration process increases in capital flows after implementing economic and financial liberalization policies, and the cost of capital in emerging markets leads to different risk and return characteristics. There is a substantial difference in market microstructure and the level of corporate governance between developing and developed markets (Raza et al., 2023; Said et al., 2021; 2024). This leads emerging markets to experience higher volatility. The governance structures in Pakistan differ from those in developed markets, and examining how these issues, including regulatory frameworks and corporate governance, influence market efficiency can provide valuable insights (Zia-ur-Rehman, 2023). Investor behavior in emerging markets often deviates from traditional finance theories due to cultural influences, risk perception and behavioral biases. Analyzing these behaviors further clarifies the low-risk anomaly (Almansour, 2023). Comparative analyses highlight unique factors influencing the low-risk anomaly, enriching the literature on market characteristics. Examining the relationships between macroeconomic factors and PSX performance can shed light on how external influences shape market behavior. Finally, longitudinal studies on PSX are needed to track changes over time and their effects on the low-risk anomaly, which is crucial for understanding evolving investment strategies. Due to a lack of research on emerging markets, a deeper examination of PSX is essential. A significant amount of volatility affects investor sentiment and decision-making, and its unique growth trajectory reflects broader economic and social dynamics. In order to avoid mispricing and unpredictable returns, it is essential to understand how this volatility contributes to the low-risk anomaly.
The current study is primarily different from studies on emerging equity markets (Joshipura & Joshipura, 2019). They constructed equally weighted decile portfolios to separate volatility from other effects by ranking stocks based on their three-year standard deviation of monthly returns and applying the Fama-French three-factor model and the Carhart (1997) four-factor model. Blitz et al. (2013) constructed equally-weighted quintile portfolios by ranking stocks based on the past three-year volatility using the standard deviation of monthly returns and applying single and multifactor models. This study (Alighanbari et al., 2016; Bishwal, 2022; Raza & Ashraf, 2019) and follows a heuristic approach by taking annualized returns and calculating a past two-year volatility by standard deviation. A low-risk-based strategy improves both the selection and weighting methods of a portfolio. In this approach, the portfolio is constructed following a series of steps. First, the risk of all stocks is estimated. Literature shows two main approaches to estimating the risk of each stock, i.e., volatility and systematic risk. Volatility is estimated with the help of the standard deviation. In the second method, beta is a proxy for systematic risk. In the second step, all stocks are ranked based on relative risk. In the third step, a specific number of stocks with the lowest risk are selected. The number of stocks to be selected in a portfolio is arbitrary and it depends on the choice of the portfolio manager. However, as a standard practice, 100 less risky stock(s) are selected by a world-renowned index, e.g., the S&P 500 low volatility index. In the last step, weights are assigned to the finally selected stocks based on their inverse volatility, or beta, i.e., stocks with lower risk receive higher weights within the portfolio. Lastly, this study also investigates the impact of GFC and GPC. This study set the following objectives to achieve:
- To compare the relative riskiness of a low-risk-based portfolio with a benchmark portfolio (market-capitalization-based portfolio).
- To compare the performance of a low-risk-based investment strategy with a market-capitalization-based investment strategy
Sections 2 and 3 offer literature review and the study's methodologies. Sections 4 and 5 provide results and a conclusion.
Literature Review
Risk-Return Trade-off Theories
An important academic literature shows the existence of low-risk based anomaly in the equity markets globally. The existing literature shows that low-risk-based portfolios outperform the market-capitalization-based portfolios over the market cycle on a risk-adjusted as well as on an absolute basis. This puzzling situation is referred to as low-risk in portfolio management theories. This anomaly contradicts traditional finance theories like CAPM, which states that an asset's expected return is directly proportional to its systematic risk (beta). This anomaly has been empirically documented across different markets using different methodological tools. This section aims to contribute to the existing literature by highlighting and linking the modern portfolio theories as background for studying low-risk anomaly. Furthermore, it presents related literature on how low-risk anomalies evolved and identifies different methodological tools of analysis. It also reviews current research on low-risk anomalies in developing markets. Finally, the need for the study to find low-risk anomalies in PSX, an emerging equity, leads to developing a hypothesis that needs to be tested.
Theoretical Background
Modern Portfolio Theory (MPT) highlights a positive link between risk and return, central to theoretical and empirical research. In the 1950s, investors recognized the importance of risk in the risk-return trade-off, although specific measurement techniques were lacking. Quantifying risk became essential to building effective portfolio models. Markowitz's "Portfolio Selection" model (1952) pioneered this effort by establishing a framework for measuring risk and calculating expected returns. He identified the variance of returns as a meaningful measure of portfolio risk and suggested that risk is integral to achieving higher returns. Risk-averse investors can optimize expected returns based on specific risk levels, leading to a positively sloped and concave efficient frontier. Markowitz's work laid the groundwork for two significant finance theories: "Capital Market Theory (CMT)" and "Asset Pricing Theory (APT)," which focus on the valuation of risky assets.
The CMT expanded the MPT by developing models for pricing risky assets, including the CAPM introduced by Lintner (1965), Mossin (1966), and Sharpe (1964). The CAPM posits a positive relationship between risk (beta) and expected returns, distinguishing between systematic and unsystematic risk, and assumes rational investors in competitive markets. However, it has faced criticism due to empirical evidence revealing anomalies. Black et al. (1972) and Haugen and Heins (1975) identified a low-risk anomaly, suggesting the risk-return relationship might be negative. Banz (1981) challenged the CAPM by demonstrating that small-cap stocks outperformed large-cap stocks on a risk-adjusted basis. The consensus is that the CAPM does not adequately explain stock prices.
Until the 1990s, the CAPM's failure to explain stock prices became visible. Haugen and Baker (1991) highlighted an inverse relationship between risk and return, while Fama and French (1992) found a flat correlation between beta and returns in U.S. markets from 1963 to 1990. They introduced size and book-to-market value as additional factors to explain stock return variations better. In response to CAPM's limitations, Ross developed the APT in the mid-1970s. APT operates on fewer assumptions and does not require a specific market portfolio. It suggests that stock returns are linearly related to multiple macroeconomic risk factors, allowing for market mispricing, that arbitrageur can exploit. However, APT is criticized for not clearly identifying the nature and number of risk factors affecting security returns.
Fama published three key papers (1965a, 1965b, 1970) that eventually developed EMH. In his first paper, Fama (1965a) provided empirical support for the RWH. His second paper (1965b) defended the RWH against critics who used technical and fundamental analyses for stock price predictions. In his influential 1970 paper, he introduced EMH, asserting that markets are efficient and that investors cannot consistently outperform without insider information. Efficient Market Hypothesis (EMH) suggests that stocks trade at their intrinsic value, and a direct relationship exists between risk and return (Malkiel, 2003). Critics argue that certain market anomalies, which EMH fails to explain (Yalcin, 2010), show that behavioral factors influence stock returns. Studies by Le Roy and Port (1981) highlighted excess market volatility, revealing greater price instability as compared to the assertion of traditional models. Thaler (1999) identified various financial anomalies related to trading volume, volatility, and predictability of stock returns. This study explores the low-risk anomaly in equity markets, which occurs when stock performance deviates from EMH. These unexplained deviations, known as financial market anomalies, can be exploited for superior investment returns, with empirical evidence drawn from the PSX.
Low-Risk-Based Anomaly in Equity Markets
The low-risk anomaly viewpoint directly contrasts the standard financial theory, which assumes a risk-return tradeoff, i.e., the higher the risk, the higher the asset's expected return and vice versa. It is well discussed and evidenced that low-risk assets are inclined to outperform their high-risk counterparts across different asset classes (Traut, 2023). This anomaly was reported at the beginning of the 1970s by Black et al. (1972), challenging the CAPM model. In addition, many studies have recognized that the low-risk factor exists in almost all types of equity markets. The low-risk anomaly exhibited a strong negative association between the expected returns and historical volatility (measured over 1, 3, 6, and 12 months). Blitz et al. (2013) showed that the low-risk anomaly is independent and cannot be explained by value, momentum and size factors/anomalies etc. Haugen and Heins (1975), taking data on US equities for 1926-1971, indicated that equity portfolios with lower variance have achieved higher average returns w.r.t portfolios with higher variance. Haugen and Baker (1991) suggested that it is possible to design low-risk portfolios (with the same or higher average returns) having significantly lower risk than market-capitalization weighted portfolios (i.e., Wilshire 5000) using data of US equities from 1972-1989. Han et al. (2020) utilized the same factor construction approach for A-shares Chinese listed firms and showed that the BAB factor also achieves a significant alpha in this region.
Fama and French (1992) found that beta alone does not explain stock returns and added size and book-to-market value factors, significantly improving the CAPM model. Blitz and Van Vliet (2007) showed that low-volatility portfolios globally provided higher risk-adjusted returns than market-capitalization portfolios. Ang et al. (2009) observed a negative correlation between expected returns and historical volatility in 23 developed markets. Haugen and Baker (2008) reported that risky equities yielded the lowest returns from 1963 to 2007 in the US. Baker et al. (2011) confirmed the low-risk anomaly, showing that low-risk equities performed better than high-risk equities from 1968 to 2008. Traut (2023) supports the low-risk anomaly as a valid factor and calls for further research. Li et al. (2014) demonstrated that low-volatility portfolios outperformed high-volatility while Asness et al. (2014) found that low-risk strategies are more effective. Dimson et al. (2017) validated that low-risk stocks in the UK and the US outperformed riskier stocks. Kothe et al. (2021) discovered a 0.77% annual excess return in non-US developed bond markets. Frazzini and Pedersen (2014) revealed lower risk-adjusted returns with higher leverage and significant abnormal returns from "Betting Against Beta" portfolios. Adhami et al. (2023) identified an inverse relationship between risk and return in crowdlending markets. Jensen et al. (2022) confirmed the replicability of the "Low Risk" theme across multiple countries, while Hou et al. (2020) and Pyun (2021) noted limitations in the low-risk anomaly, highlighting the need for further critical analysis.
The low-risk anomaly has been comprehensively studied in the US and other developed markets, while fewer studies are available in emerging and developing markets. Baker and Haugen (2012) discovered that low-volatility outperformed high-volatility equities across all 21 developed and 12 emerging markets from 1990 to 2011. Blitz et al. (2013) also investigated the relationship between risk and return in emerging equity markets and found it flat or negative. The results of their study are contrary to CAPM. Chen (2017) documented a negative relationship between investment and expected returns in the Chinese stock market. Gupta (2018) reported the empirical evidence of low-risk anomaly in the Indian stock market and proved that low-volatility portfolio returns outperformed the returns on high-volatility portfolios. Joshipura and Joshipura (2019) used the data from the Nifty 500 index and find that the portfolios having low volatility outperform the high-volatility stocks. They further proved that the volatility effect is unique irrespective of size, value and momentum factors. Similarly, Saengchote (2017) provided evidence of low-risk anomaly and showed that abnormal returns with low-beta stocks are robust and significant using data from the Thai stock market for the period 2004-2015. Regardless of the myriad studies noted above, there is a dearth of such research in the context of Pakistan. However, related studies, i.e., Ghufran et al. (2016) and Hussain and Khan (2023), analyze the causes of stock market volatility in Pakistan and find persistent high volatility along with a negative leverage effect. Mubarak et al. (2019) discussed the reasons for fluctuations in stock prices in Pakistan. Hussain and Uppal (1999) predicted that the volatility of PSX is long-term.
The Resilience of Portfolios during Financial Crises
The global financial crisis in 2008 and onward, resulted in a large drawdown in investments in the equity markets starting from USA, Europe, Asia, and emerging economies of the world. As confirmed by Bordo and Landon-Lane (2010) who showed that the global financial crisis of 2008 also resulted into the stock market crashes, engulfing many countries including USA and other countries, within a few months of its start. The investors in USA faced a fall in their portfolios over time. The S&P 500 index declined by more than 50% from its peak in October 2007 to the bottom in March 2009. Similarly, there was a decline of more than 40 % alone in the global equity market represented by MSCI AC World in 2008. However, there are studies which confirm that in comparison to broader market portfolios, the low-risk based portfolios show resistance to financial crisis and result in relatively lower value at risk. Furthermore, they also suffer fewer losses as measured by drawdowns, as observed by Boudt et al. (2019).
Evidence from Emerging Markets
The emerging equity markets are vital for international diversification due to higher economic growth and profit opportunities, as described by Blitz et al. (2013). They reported that the emerging market weight has enlarged in the composition of the MSCI All Countries Index from approximately 1% in 1988 to about 15% in 2013. This increase in weight in MSCI is due to the issuance of new shares, listing of new companies, higher realized returns, financial liberalization and deregulation policy measures. Furthermore, market demand due to the growing population, increased foreign direct investment, and global financial integration of the emerging markets are also included in the factors responsible for the increase in weight in MSCI (Blitz et al., 2013). The emerging markets have been subject to market turmoil, high volatility, and various financial and economic crises, such as Mexico in 1994, the Asian Financial Crisis in 1997 and Russia in 1998. Most of the other previous studies, for example, Fama and French (1998), Patel and Sarkar (1998), Rouwenhorst (1999), and Van Der Hart et al. (2003) examine stock returns in emerging markets, confirming value, size, and momentum effects. An exception is Rouwenhorst (1999), who showed that beta is unrelated to returns in developing markets using data from 1982 to 1997. A significant gap in the literature can be observed as there is little information available regarding the performance of low-risk-based strategies in equity markets of developing countries.
Methodology
This study constructs a low-risk weighted portfolio and compares its performance with the market-capitalization weighted portfolio. The study considers all the firms on PSX as the reference investment universe, , where each firm listed at PSX is denoted by . The selection of each stock at the time is carried out in multiple steps. First, returns are estimated from the adjusted closing prices of each firm and the estimate relative riskiness of each stock at time " is calculated. The risk component of each stock " " can be calculated by following a minimum-variance optimization approach used by Alighanbari et al. (2016) or by using the heuristic approach used by Alighanbari et al. (2016), Boudt et al. (2019), and Raza and Ashraf (2019) etc. The study used the ADF and PP Unit Root test first to check the stationarity in data. The former method of low-risk optimization required complex mathematical estimations such as a variance-covariance matrix (Raza & Ashraf, 2019). The latter has the advantage of simplicity as it calculates risk via standard deviation and then assigns weights to less risky stocks (Raza & Ashraf, 2019).
The heuristic approach then screens the whole investment universe at the time and selects less risky stocks. The low-risk stock numbers in a portfolio or index are random and can fluctuate depending on funds and indices.[1] It is imperative here that the relative risk for every stock can be calculated either through Beta from CAPM, Lee (2011) or with standard deviation. Some studies favor using downside measures of risk such as value at risk (VaR), drawdowns, or expected shortfall. The selection of the estimation method is also arbitrary. This study estimates the risk by following the methodology of Boudt et al. (2019). It estimates the volatility of stocks based on a rolling window of two years' returns. After screening the investment universe, the second important step is to assign weights to stocks that are included in the low-risk weighted portfolio. The weights of each portfolio component are inversely proportional to its risk characteristics such that stocks with lower risk receive higher weights.
In the first step, 100 stocks with the lowest volatility among all the investment universe were selected. This technique is used by world-leading indices such as the S&P 500 low volatility index. The weights of each stock at the time respectively were implemented as:
w(i,t)LR= ( 1/σ(i,t) ×L(i,t))/(∑(i=1)N 1/σ(i,t) ×L(i,t), (1)
where is the inverse of the volatility for stock at time and is the dummy representative that the stocks are among the l00 least volatile stocks.
The analysis of this study is based on a large secondary data set covering the period 2005-2022 to construct low-risk and market-capitalization weighted portfolios. For this purpose, this study obtains price data from the PSX-100. To construct a market-capitalization-based portfolio, this study estimates the market capitalization of each firm "𝑖" at time "𝑡."
Data Analysis Techniques
This study compares the financial performance of both portfolios by conducting extensive back-tests ranging from 2005-2022. The period leading up to 2022 is significant for several reasons. First, it spans a complete market cycle, which includes the GFC-2008. This allows for a comprehensive portfolio performance assessment during market stress. Additionally, this timeframe captures the recovery and growth following the crisis and the recent impacts of the COVID-19 pandemic, providing valuable insights into how portfolios respond to both economic downturns and periods of growth. Furthermore, this period includes essential data on Pakistan's stock market, especially after the market reforms and modernization that occurred in the mid-2000s, making it relevant for analyzing portfolio dynamics in an emerging market context like Pakistan.
First of all, closing historical prices of both portfolios were obtained from investng.com and yahoofinance.com and then annualized returns of both portfolios were reported by calculating returns monthly and then annualizing by using the compounding rule. Rebalancing occurs at the close of each calendar year to maintain the portfolio's alignment with its original asset allocation and risk profile, regardless of market fluctuations. The annualized risk/volatility of both portfolios was further estimated with the help of standard deviation monthly which was then annualized with the square root of the time rule. The semi-deviation and gain-deviation was also reported to analyze the volatility and risk process further. In addition to this, the downside measures of risk, such as Value at Risk (VaR), maximum drawdowns (MD), and expected shortfall (ES) were also reported. The risk-adjusted performance (Sharpe ratio) and the relative measure of performance, commonly known as the coefficient of variation (a measure of relative variability), were also reported. For performance comparison, a paired t-test was also reported. In robustness check, the study also used quantile regression estimates, offering a detailed view of return and loss distributions beyond the mean. It helped analyze how return and risk profiles varied across quantiles, enhancing the understanding of portfolio performance influenced by market factors for both low-risk and market-based portfolios.
Data Analysis
Let's first see the most commonly used keywords and their frequency distribution. Figure 1 employs a cartographic analysis (WordCloud).
In the realm of research, a "cloud picture" denotes a visual representation that encapsulates intricate data and interconnections within a study. In this method, words are sized in proportion to their occurrence in a text, providing a prompt overview of prevailing themes and trends. To exemplify the most commonly utilized keywords and their frequency distribution, a cartographic analysis (WordCloud) has been employed. This article discusses key market themes such as economics, volatility, portfolio returns, risk, performance, stocks, value, and emerging markets. Economic conditions, such as GDP growth, inflation, and interest rates, significantly influence market performance and portfolio returns. As market volatility increases, drawdowns and recovery times are often longer. As a result of the stability of the underlying assets, portfolios with different risk profiles exhibit drawdowns and recoveries. Due to political instability, currency fluctuations, and lower liquidity, emerging markets offer high potential returns but with increased risks. Understanding how these factors relate to historical portfolio trends may help investors navigate risk and maximize returns by providing a comprehensive view of how different portfolios respond to market conditions. The outcomes detailed in Figure 5 show all the relevant and important words like Portfolios, Journals, Financial, Economics, and Volatility.
Figure 1
Most Frequently Used Keywords in the Cloud Picture in the field.
<Socially Responsible Investment (SRI) has gained importance as global concerns pertaining to Environmental, Social, and Governance (ESG) issues have grown. Financial Institutions (FIs) are leading the growing need for ethical and sustainable business practices. FIs have incorporated investment decisions pertaining to social and environmental factors which has also driven the FIs to change the money-keeping responsibilities. The research conducted on SRI is relevant for FIs to be able to align with stakeholder values, mitigate risks, support long-term performance, and promote responsible corporate activity. Therefore, it addresses the global issues in an effective way, facilitating a sustainable future. The act of including social and environmental factors in making investment decisions has changed the face of financial sector. It is encouraging for firms to reconsider their roles as custodians of financial resources. SRI research compliments stakeholder values; helps mitigate risks, supports long-term performance, and fosters responsible corporate activity which is important for FIs. This effectiveness would ensure a sustainable future at targeting and resolving global issues.
Recent researches have observed a remarkable engagement of the policymakers, the researchers, and the practitioners towards environmental issues and sustainable development, with particular attention paid to SRI for FIs (Arjaliès et al., 2023; Sciarelli et al., 2021). SRI is an investment strategy that not only considers financial returns, however, also the broader social, environmental, and ethical impacts of investments (Chiapello, 2023). It can be summed up by choosing an investment that observes particular ESG criteria or moral principles. SRI strategies are aimed at bringing social and environmental change while ensuring it meets its financial objectives as well (Revelli, 2017). Moreover, SRI strategies can either involve investing in companies that highly practice ESG standards, promoting technologies for sustainability, avoiding investments in industries with adverse impacts, or exerting pressure through shareholder activism to make a positive contribution to the company’s behavior (Barko et al., 2022; Crifo & Forget, 2013; Dawkins, 2018; Wagemans et al., 2013).
This research provided novel perspectives through a comprehensive analysis of SRI within the FIs, while also highlighting the emergence of interdisciplinary and worldwide collaborative efforts. Therefore, the role of SRI was examined in FIs by considering the research gaps and future directions using bibliometric analysis.
Moreover, this study followed the centrality of SRI in FIs and provided a bibliometric analysis of academic contributions to this burgeoning topic. The researcher used bibliometric tools to uncover patterns, trends, and significant themes in SRI research. The bibliometric analysis comprised influential articles, names of authors, and countries that assessed the impact of SRI on FIs. Furthermore, the study aimed to understand the main developments of SRIs’ financial integration, knowledge gaps, and future opportunities through published data and collaborative networks.
Historical ethical movements led to the development of SRI in the 18th century with the Quakers who avoided morally doubtful investments (Richardson, 2013). The modern SRI movement started in 1971 following the establishment of Pax World Fund (Renneboog et al., 2008). Furthermore, the seminal academic research conducted by Moskowitz (1972) discovered the financial benefits of SRI. The UN’ Principles for Responsible Investments (PRI) in 2006 took SRI to the international platform (Puaschunder, 2016). As a result of increased awareness about environmental and social issues and the relevance of ethical portfolios, SRI has become a mainstream research concern (Revelli, 2017). Presently, it is an essential leader in responsible investment policies creating a positive environmental and social impact.
Consequently, in the face of stakeholder scrutiny concerning operations that are both ethical and sustainable, SRI is increasingly relevant to all organizations and institutions (Ullah et al., 2014). Recent studies have further proved that a robust set of ESG factors strongly enhances an organization’s financial performance. This would motivate an institution to add ESG factors to minimize risk and improve profitability (Moskowitz, 1972). The PRI of UN has played a vital role in promoting SRI by facilitating institutions to contribute positively toward societal and environmental objectives and seeking financial returns (Puaschunder, 2016). Furthermore, SRI enables institutions to differentiate themselves competitively through making more clients and enhancing their brand reputations (Louche & Hebb, 2014). A number of firms have already intended to adopt the required ESG disclosures and others in near future (Scholtens & Sievänen, 2013). This initiative has motivated other firms to adopt SRI as well. Adopting SRI may enable the financial institutions to demonstrate responsible investment practices, encourage long-term sustainability, and contribute to a more equitable and environmentally-conscientious global economy (Arco Castro et al., 2023; Rehman et al., 2021; Risi, 2018).
The remaining part of this study comprises three sections. The second section of the current study discusses methodology which comprises the framework applied from data collection for analysis. Significant findings in the form of highly cited articles, names of authors, journals, and countries contributed to SRI-related research, contextual to financial institutions across the world. The fourth section covers a comprehensive discussion. Lastly, the fifth section comprises conclusion.
Data and Methodology
This section includes the detail about data and information sources, selection of sample data, and some details about bibliometric analysis as a part of methodology of this study.
Data and Information Source
In this study, the primary source for bibliometric analysis is the Elsevier Scopus Database. Scopus is preferred over other databases, such as Web of Science (WOS), due to its global reputation for quality and reliability (Nobanee et al., 2021). The utilization of this particular record provides a more thorough and uniform dataset, rendering it a suitable option for performing bibliometric analysis (Tunger & Eulerich, 2018).
Selection of Sample Data/Information
Data was retrieved from Elsevier-Scopus on November 29th 2023. The current study limited its search to titles and abstracts comprising the word 'SRI' and 'FIs'. This is because the review was aimed at updating the studies representing the point of intersection of the previously mentioned two key concepts. 'SRI' is a core topic in that the study is concerned with sustainable investment practices, while 'FIs' are central in the sense that they represent those mechanisms through which such strategies are applied. These are also keywords of choice to collect the relevant literature in line with the objective of this study pertaining to the role of FIs in promoting SRI. The author first used the advance search option in Scopus to include 12 alternative phrases for “SRI” and 17 for “FIs” to maximize the search procedure (Figure 1). Finally, 3571 materials were produced as results of articles, review papers, books, and conference papers. These resources were generated from 11 subjects. Afterwards, the search term was extended into business, management, accounting, economics, econometrics, finance, and social sciences in conjunction with the environmental sciences. This produced 3238 documents. These documents covered 70% of the publications on this research domain. Thirdly, the researcher analyzed "articles" as the document type, yielding 2364 articles. Afterwards, the search was restricted to the "Top 10 ABCD" journals. It yielded 658 publications for this study's detailed bibliometric analysis. The reason for not using 'Sustainable Finance' as a keyword was that it is a broader term and might include areas outside of the specific scope of this study. This is done to gather literature that directly relates to the integration of SRI within FIs for a more congruent dataset.
Figure 1
Flow Chart of Final Sample Data for Analysis
Bibliometric Analysis
Bibliometric analysis utilizes mathematical and statistical techniques to comprehend the interconnections of journal citations and to provide a concise overview of research subjects (Abdelwahab et al., 2023). Data can be acquired from citation indexes, such as Scopus and WOS which may act as data sources. The current study utilized two primary methodologies, namely performance analysis and scientific mapping, as discussed by Nobanee et al. (2021). Figure 2 indicates the overall flow of analysis (performance analysis and scientific mapping).
Figure 2
Flow Chart of Bibliometric Analysis
Results and Interpretations
Bibliometric Performance Analysis
Scientific publications and citations are used to evaluate individuals, organizations, journals, and countries in bibliometric performance analysis (Nobanee et al., 2021). This method is useful in decision-making and performance comparisons. The increase in time-series analysis research papers has shown an advancement towards sustainable finance and SRI since 1990. Figure 3 shows three stages including a considerably increasing trend between 1990 and 2010, indicating a growing recognition of the subject matter. Interconnected research has increased steadily between 2011 and 2019, driven by climate change concerns. This research boom has necessitated sustainable financial practices and SRI techniques. Research activity increased between 2019 and 2023 which led to the production of 800 articles. The growing importance of sustainability and social responsibility in finance explains this research rise.
Figure 3
Yearly Publication Growth
Figure 4 provides significant insights regarding the distribution of publications within the specific study domain under consideration. Data analysis indicates that scholarly articles pertaining to SRI, sustainable finance, impact investment, and other pertinent subjects are distributed throughout the 11 distinct sub-domains. In order to conduct a comprehensive analysis of the multifaceted subject matter, the researchers directed their attention on four principal domains. These domains include business, management, and accounting (21.7%); economics, econometrics, and finance (19.8%); social science (17.8%); and environmental science (12.2%). Significantly, these four domains jointly account for more than 70% of the documents within the specified research field. Therefore, it is essential to conduct a multidisciplinary analysis that encompasses various disciplines in order to achieve a thorough comprehension of the research issue.
Figure 4
Subject Distribution
Figure 5 provides significant findings on the distribution of documents across several categories, encompassing articles (71.8%), book chapters (12.9%), reviews (6.2%), conference papers (4.7%), books (2.9%), and other forms. Considering that most of the documents within the designated research areas may be classified as articles, the researchers determined it suitable to employ the sample data to analyze the study.
Journal productivity is measured by publication count and average citations (Small, 1999). Table 1 shows that sustainable finance and SRI research are multidisciplinary, with the top 10 journals focusing on sustainability or the environment. MDPI's Sustainability Switzerland leads 2023 with 250 articles (38% of total) and a 5.8 cite score. Springer's Journal of Business Ethics has a solid cite score of 12 (14% publications). Elsevier's Journal of Cleaner Production has 61 articles (9% of total) with a cite score of 18.5. Business strategy and the environment, sustainable development, and corporate social responsibility (CSR) and environmental management have cite scores of 15.2 to 17.8, providing 5% to 6% of total publications. These periodicals demonstrate the influence of sustainable finance and SRI research.
Figure 5
Document Type
Table 1
Summary of Top 10 Journals with Total Publications and Cite Score
|
Source Title |
ABDC Category |
Number of Publications |
Cite Score (2022) |
Publisher |
|
Sustainability Switzerland |
N/A |
250/658 = 38% |
5.8 |
MDPI |
|
Journal Of Business Ethics |
A |
89/658 = 14% |
12 |
Springer |
|
Journal Of Sustainable Finance and Investment |
N/A |
74/658 = 11% |
7.4 |
Tylor & Francis |
|
Journal Of Cleaner Production |
A |
61/658 = 9% |
18.5 |
Elsevier |
|
Business Strategy and The Environment |
A |
40/658 = 6% |
17.8 |
Wiley Blackwell |
|
Sustainable Development |
C |
38/658 = 6% |
15.2 |
Wiley Blackwell |
|
Corporate Social Responsibility and Environmental Management |
C |
32/658 = 5% |
15.6 |
Wiley Blackwell |
|
Environmental Science and Pollution Research |
N/A |
32/658 = 5% |
7.9 |
Springer |
|
Finance Research Letters |
A |
23/658 = 3.5% |
10.8 |
Elsevier |
|
Sustainability Accounting Management and Policy Journal |
B |
19/658 = 3% |
7 |
Emerald |
Table 2 showcases the ten top journals together with their highly cited papers, offering unique insights into the prevailing subjects within the domains of sustainability, CSR, finance, and environmental management. Significantly, there has been a considerable scholarly interest in investigating the effects of the COVID-19 epidemic on students in higher education. This is evident by the substantial citation count of 3841 for the study published in the esteemed journal "Journal of Cleaner Production". Additional noteworthy subjects encompass ideas on CSR in the "Corporate Social Responsibility and Environmental Management" with a total of 2153 citations, as well as the "Journal of Business Ethics" with a total of 2106 citations.
Table 2
Influential Journals and their Articles
|
Journal Name |
Most Cited Article |
Time Cited |
|
Journal Of Cleaner Production |
From a literature review to a conceptual framework for sustainable supply chain management |
3841 |
|
Corporate Social Responsibility and Environmental Management |
How corporate social responsibility is defined: An analysis of 37 definitions |
2153 |
|
Journal Of Business Ethics |
Corporate social responsibility theories: Mapping the territory |
2106 |
|
Business Strategy and The Environment |
Beyond the business case for corporate sustainability |
2080 |
|
Environmental Science and Pollution Research |
Eutrophication of freshwater and coastal marine ecosystems: A global problem |
1531 |
|
Sustainable Development |
Sustainable development: Mapping different approaches |
1234 |
|
Finance Research Letters |
Financial markets under the global pandemic of COVID-19 |
1163 |
|
Journal Of Sustainable Finance and Investment |
ESG and financial performance: aggregated evidence from more than 2000 empirical studies |
855 |
|
Sustainability Switzerland |
Impacts of the COVID-19 pandemic on life of higher education students: A global perspective |
803 |
|
Sustainability Accounting Management and Policy Journal |
What are the drivers of sustainability reporting? A systematic review |
208 |
Table 3 shows the rankings of ten most influential researchers in the domain of sustainable finance and SRI research, covering the time period from 1990-2023. Aibar-Guzmán and García-Sánchez, from Spain, have achieved prominence in their field with a total of 8 articles each in the field of sustainable finance and SRI. In close pursuit is Scholtens, from the Netherlands, who has contributed significantly with 7 publications. Additionally, García-Sánchez, I.M. are distinguished by their remarkable H-index of 52, which serves as a strong indicator of significant influence and acknowledgement within their respective area of research.
Bibliometric Scientific Mapping
Bibliometric scientific mapping uses statistical and mathematical methodologies to examine scientific literature, thereby uncovering research trends and identifying key authors, countries, and keywords (Abdelwahab et al., 2023; Nobanee et al., 2021; Tanwar et al., 2022; Tunger & Eulerich, 2018).
Table 3
Influential Authors
|
Rank |
Author Name |
No of Doc in SRI |
Scopus Author Id |
Year Of 1st Publication |
Total Publication |
Document H-Index |
Total Citation |
Current Affiliation |
Country |
|
1 |
Aibar-Guzmán, B. |
8 |
36241172000 |
1999 |
41 |
16 |
784 |
Universidad de Santiago de Compostela, Santiago de Compostela |
Spain |
|
2 |
García-Sánchez, I.M. |
8 |
57193363767 |
2006 |
209 |
52 |
5851 |
Universidad de Salamanca, Salamanca |
Spain |
|
3 |
Scholtens, B. |
7 |
17344623500 |
1992 |
124 |
39 |
4515 |
Rijksuniversiteit Groningen, Groningen |
Netherlands |
|
4 |
Aibar-Guzmán, C. |
6 |
56819011400 |
2004 |
26 |
13 |
373 |
Universidad de Santiago de Compostela, Santiago de Compostela |
Spain |
|
5 |
Escrig-Olmedo, E. |
5 |
55450203500 |
2013 |
21 |
10 |
534 |
Universidad Jaume I, Castellon de la Plana |
Spain |
|
6 |
Weber, O. |
5 |
7004486571 |
1998 |
90 |
28 |
1850 |
University of Waterloo, Waterloo |
Canada |
|
7 |
Klein, C. |
4 |
35734464800 |
2005 |
30 |
11 |
649 |
Universität Kassel, Kassel |
Germany |
|
8 |
Moneva, J.M. |
4 |
14119993400 |
1996 |
54 |
25 |
2367 |
Universidad de Zaragoza, Zaragoza |
Spain |
|
9 |
Muñoz-Torres, M.J. |
4 |
15751052500 |
2006 |
45 |
19 |
1124 |
Universidad Jaume I, Castellon de la Plana |
Spain |
|
10 |
Orsato, R.J. |
4 |
8727661100 |
2002 |
31 |
20 |
1682 |
Università Bocconi, Milan |
Italy |
Co-author Country Analysis
Bibliometric co-author country analysis examines global research collaboration (Fu et al., 2022). VOS viewer graphs countries' collaboration networks to show co-authorship (Gao et al., 2022; Guleria & Kaur, 2021; Shahmoradi et al., 2021). The data shows connected nations and cooperative groups. More nations with larger nodes indicate stronger co-authorship relationships in Figure 6(a). China, the UK, the USA, Spain, India, Italy, Germany, and France collaborate heavily. The author created Table 4 using VOS viewer to rank co-author countries by connections, connection strength, papers, and citations for complete analysis. This table shows detailed analysis of joint research and collaboration among significant nations in the study's topic.
Figure 6 (a)
Co-author Country Analysis (Network Visualization)
Table 4 shows nations ranked by SRI research co-authorship. China has 33 collaborations and a substantial influence (82 link strength) and has published 86 papers with 1334 citations. The UK has 32 links, 84 strength, 84 documents, and 2044 citations. The US ranks third with 26 links, 48 link strength, 56 publications, and 1660 citations. Spain has 23 links, 46 link strength, and 2391 citations from 92 sources, ranking fourth. With 19 links, 30 link strength, 23 documents, and 743 citations, India ranks sixth. Malaysia ranks sixth with 19 connections, 33 link strength, 22 documents, and 331 citations. Italy ranks sixth with 18 links, 33 link strength, 57 documents, and 1263 citations. A total of 49 documents and 1197 citations match Italy's metrics in Australia. France ranks tenth with 17 links, 32 strength, and 906 citations. Germany ranks 10th with 16 links, 19 link strength, 34 documents, and 1613 citations.
Table 4
Co-author Countries’ Rankings
|
Ranks |
Countries |
Links |
Total Link Strength |
Documents |
Citations |
|
1 |
China |
33 |
82 |
86 |
1334 |
|
2 |
United Kingdom |
32 |
84 |
84 |
2044 |
|
3 |
United States |
26 |
48 |
56 |
1660 |
|
4 |
Spain |
23 |
46 |
92 |
2391 |
|
5 |
India |
19 |
30 |
23 |
743 |
|
6 |
Malaysia |
19 |
33 |
22 |
331 |
|
7 |
Italy |
18 |
33 |
57 |
1263 |
|
8 |
Australia |
18 |
33 |
49 |
1197 |
|
9 |
France |
17 |
32 |
26 |
906 |
|
10 |
Germany |
16 |
19 |
34 |
1613 |
Table 4 overlays VOS viewer's bibliometric data with geographical nation representation, based on publications or citations (Huang et al., 2017; Oladinrin et al., 2023). This helps evaluate nation contributions to various scientific fields (Guleria & Kaur, 2021). In this study, co-author country analysis has been shown in Figure 6(b). The darker nodes, such as the USA, France, Belgium, Canada, the UK, and Netherlands have more citations than publications. In SRI, sustainable finance, allied topics, and lighter-colored nodes, such as Pakistan, Saudi Arabia, Egypt, Iran, Hungary, Sri Lanka, India, Bangladesh, and Ghana, suggest more collaborative research with lower citations.
Figure 6 (b)
Co-author Country Analysis (Overlay Visualization)
Figure 6 (c)
Co-author Country Analysis (Density Visualization)
The use of density visualization, specifically density maps, within VOS-viewer software facilitates the depiction of geographical arrangement of scientific collaboration among nations (Cobo et al., 2011; Moral-Muñoz et al., 2020). This tool facilitates the analysis of international research collaborations by identifying clusters of nations that exhibit significant levels of collaborative activities (Markscheffel & Schröter, 2021). Figure 6(c) indicates the density visualization of co-author country analysis of this study. It indicates that the countries, such as Spain, Italy, China, the UK, as well as the USA, France, Germany, and Netherlands are exhibiting a greater concentration of co-authorship on SRI and FIs.
Co-occurrences of Keyword Analysis
Figure 7(a) indicates top 5 nodes as per their size on the basis of co-occurrences of keywords as: SDGs, sustainability, SRI, sustainable finance, and ESG. It indicates that SDGs co-occurred 86 times with 45 other words, significantly. Additionally, sustainability co-occurred 69 times with 47 other words, significantly. Moreover, SRI co-occurred 61 times with 25 other words, significantly. The current study aimed to identify the role of SRI in FIs, therefore, it is needed to identify that how many times the SRI has co-occurred with FIs as per Scopus database.
Figure 7 (a)
Keywords Co-occurrence Analysis (Network Visualization)
The keyword co-occurrence analysis in Table 5 is noteworthy. The strongest correlation is between SRI and CSR in FIs. SRI subjects include "mutual funds," "sustainable development," "responsible investment," and "SDGs," emphasizing financial ethics and sustainability. The current study aimed to examine SRI's ESG impact, financial market impact, and performance assessment. "Impact investing", "ethical investing", "pension funds", "governance", and "environmental performance" highlight SRI's financial aspects. The report shows SRI's interaction with financial sectors, emphasizing sustainability and responsibility.
Table 5
SRI Links with other Keywords and Domains
|
Ranks |
SRI Links with |
Link Strength |
Ranks |
SRI Links with |
Link Strength |
|
1 |
CSR |
9 |
14 |
Impact Investing |
1 |
|
2 |
Mutual Funds |
6 |
15 |
Social Finance |
1 |
|
3 |
Sustainable Development |
5 |
16 |
Strategy |
1 |
|
4 |
Responsible Investment |
4 |
17 |
Institutional theory |
1 |
|
5 |
SDG |
3 |
18 |
Institutional Investors |
1 |
|
6 |
Financial Markets |
3 |
19 |
Pension funds |
1 |
|
7 |
Sustainable Investment |
3 |
20 |
Sustainability Reporting |
1 |
|
8 |
Performance Evaluation |
2 |
21 |
Governance |
1 |
|
9 |
Responsible Investing |
2 |
22 |
Corporate Sustainability |
1 |
|
10 |
Sustainability |
2 |
23 |
Environmental |
1 |
|
11 |
ESG |
2 |
24 |
Environmental Performance |
1 |
|
12 |
Fiduciary Duty |
2 |
25 |
CSR |
1 |
|
13 |
Ethical Investing |
2 |
Figure 7(b) shows darker-colored nodes with higher citations than publications for SRI, responsible investment, ethical investment, ethical investing, mutual funds, financial markets, and CSR. The lighter nodes imply lesser citations than publications for SDGs, ESG, green finance, AI, Agenda 2030, green bonds, economic growth, green innovation, financial development, and Fintech.
Figure 7 (b)
Keywords Co-occurrence Analysis (Overlay Visualization)
Figure 7 (c)
Keywords Co-occurrence Analysis (Density Visualization)
Table 6
Keywords Co-occurrence Analysis
|
Cluster & Color |
Keywords |
Links |
Total Link Strength |
Occurrences |
Cluster & Color |
Keywords |
Links |
Total Link Strength |
Occurrences |
|
1. Red |
Green Finance |
15 |
22 |
15 |
4. Yellow |
Sustainability |
47 |
109 |
69 |
|
Renewable Energy |
13 |
20 |
13 |
|
Corporate Social Responsibility |
22 |
35 |
17 |
|
|
Artificial Intelligence |
11 |
16 |
7 |
|
Sri |
20 |
29 |
17 |
|
|
Sdg |
13 |
16 |
10 |
|
Sustainable Investment |
18 |
24 |
20 |
|
|
Economic Growth |
10 |
15 |
8 |
|
Environmental |
16 |
22 |
12 |
|
|
Financial Development |
11 |
15 |
10 |
|
Socially Responsible Investing (Sri) |
9 |
14 |
9 |
|
|
Green Bonds |
11 |
14 |
10 |
|
Financial Institutions |
13 |
13 |
5 |
|
|
Emissions |
9 |
11 |
6 |
|
Corporate Social Performance |
10 |
12 |
5 |
|
|
Fintech |
10 |
11 |
5 |
|
Covid-19 Pandemic |
9 |
10 |
8 |
|
|
Financial Inclusion |
7 |
10 |
7 |
|
Risk |
7 |
7 |
7 |
|
|
Sustainable Investments |
7 |
8 |
10 |
|
Circular Economy |
6 |
6 |
5 |
|
|
Financial Literacy |
7 |
7 |
5 |
|
Performance |
4 |
4 |
5 |
|
|
Technological Innovation |
3 |
7 |
6 |
5. Purple |
Socially Responsible Investment |
29 |
75 |
61 |
|
|
Carbon Emissions |
4 |
6 |
5 |
|
Corporate Social Responsibility |
36 |
66 |
38 |
|
|
Green Innovation |
6 |
6 |
7 |
|
Ethical Investment |
18 |
31 |
13 |
|
|
2. Green |
Sustainable Development |
47 |
93 |
60 |
|
Mutual Funds |
13 |
28 |
14 |
|
Pension Funds |
20 |
29 |
11 |
|
Socially Responsible Investing |
15 |
24 |
16 |
|
|
Responsible Investment |
13 |
22 |
9 |
|
Institutional Investors |
18 |
21 |
9 |
|
|
Impact Investing |
12 |
16 |
19 |
|
Ethical Investing |
10 |
19 |
9 |
|
|
Strategy |
15 |
16 |
6 |
|
Fiduciary Duty |
11 |
16 |
9 |
|
|
Agenda 2030 |
8 |
13 |
7 |
|
Socially Responsible Investments |
10 |
14 |
11 |
|
|
Finance |
12 |
13 |
7 |
|
Financial Markets |
11 |
13 |
7 |
|
|
Responsible Investing |
8 |
11 |
8 |
|
Performance Evaluation |
7 |
11 |
5 |
|
|
Esg Investing |
8 |
9 |
5 |
6. Sky-Blue |
Corporate Social Responsibility |
18 |
29 |
16 |
|
|
Social Finance |
6 |
8 |
7 |
|
Corporate Sustainability |
15 |
22 |
15 |
|
|
Social Entrepreneurship |
3 |
4 |
5 |
|
Stakeholder Theory |
16 |
22 |
8 |
|
|
3. Blue |
Sustainable Development Goals |
45 |
123 |
86 |
|
Socially Responsible Investment (Sri) |
11 |
19 |
13 |
|
Sustainability Reporting |
23 |
49 |
22 |
|
Environment |
13 |
14 |
6 |
|
|
Sustainable Development Goals (Sdgs) |
26 |
34 |
27 |
|
Stakeholder Engagement |
12 |
13 |
6 |
|
|
Governance |
16 |
23 |
9 |
|
Gri |
9 |
12 |
6 |
|
|
Non-Financial Reporting |
15 |
21 |
8 |
|
Sustainability Performance |
10 |
12 |
6 |
|
|
2030 Agenda |
11 |
18 |
8 |
|
Legitimacy Theory |
7 |
11 |
5 |
|
|
Corporate Governance |
12 |
17 |
13 |
7. Orange |
Esg |
40 |
85 |
47 |
|
|
Sdg Compass |
9 |
17 |
5 |
|
Sdgs |
29 |
59 |
35 |
|
|
Stakeholders |
13 |
16 |
5 |
|
Sustainable Finance |
29 |
56 |
48 |
|
|
Institutional Theory |
12 |
15 |
6 |
|
Financial Performance |
19 |
34 |
21 |
|
|
Sdg Reporting |
8 |
14 |
5 |
|
Covid-19 |
13 |
26 |
17 |
|
|
Sustainable Investing |
11 |
14 |
11 |
|
Climate Change |
6 |
7 |
5 |
|
|
Innovation |
10 |
12 |
9 |
|
Environmental Performance |
5 |
5 |
5 |
Figure 7(c) shows keyword co-occurrence density. SRI, SDGs, sustainable development, sustainability, and ESG are more concentrated on sustainable finance. Mutual funds, AI, green finance, green bonds, climate change, non-financial reporting, sustainability reporting, financial innovation, impact investing, and Agenda 2030 are less concentrated in sustainable finance.
Keywords Cluster Analysis
Based on the co-occurrence analysis of author keywords as provided in Table 6, it is possible to discern the primary themes associated with the function of SRI within FIs.
Cluster-1 (Red) Green Finance and Sustainability. This cluster focuses on "green finance" and sustainable financial practices. The words emphasize environmentally-friendly investments, sustainable technologies, and financial strategy that incorporates SDGs. It indicates a growing preference for sustainable financing, renewable energy, and cutting-edge technologies to boost economic growth and address environmental challenges.
Cluster-2 (Green) Sustainable Development and Responsible Investment. This cluster emphasizes "sustainable development" and responsible investing. Moreover, it emphasizes aligning investing strategies with sustainability goals. It explores how pension funds integrate ESG issues into sustainable and responsible investing. The concepts of "Agenda 2030" and "ESG investing" emphasize sustainability and ESG concerns in investing decisions.
Cluster – 3 (Blue) SGDs and Reporting. This cluster focuses on SDGs and FIs’ reporting criteria. It evaluates how financial firms integrate UN SDGs and report ESG performance. Furthermore, it explores how governance structures and institutional frameworks affect sustainability initiatives and stakeholder involvement. It suggests finance industry’s transparency and responsibility to increase sustainable practices.
Cluster – 4 (Yellow) Sustainable CSR and SRI. This cluster examines sustainable CSR and SRI in FIs, focusing on ethical practices in their operations. The text focuses on "sustainable investment" and "environmental" dimensions, evaluates financial organizations’ corporate social performance, and examines how the pandemic affected sustainable finance. The uncertainty of sustainable investment is addressed in relation to "risk".
Cluster -5 (Purple) Socially Responsible Investment (SRI). This cluster covers SRI, CSR, and ethical investments. The strategy emphasizes socially and ethically responsible investing. The areas of "mutual funds" and "financial markets" examine SRI in financial environments. The terms "institutional investors" and "fiduciary duty" refer to institutional investors' SRI and ethical practices. SRI performance is assessed by "performance evaluation".
Cluster - 6 (Sky-Blue) Sustainable CSR and Stakeholder Engagement. This cluster focuses on sustainability, CSR, and stakeholder engagement. "Corporate reporting," "corporate sustainability," and "stakeholder theory" explain how companies engage stakeholders and meet social and environmental goals. "SRI" invests with CSR in mind. "Stakeholder engagement" and “Global Reporting Initiative” (GRI) study sustainable reporting and stakeholder interaction for GRI. "Sustainability performance" and "legitimacy theory" evaluate firms' sustainability and credibility through responsible practices.
Cluster – 7 (Orange) Environment, Social, and Governance (ESG). This cluster examines ESG, sustainable finance, and financial performance. The key phrases include "ESG," "SDGs," and "sustainable finance," emphasizing ESG and sustainability in capital markets. "Financial performance" examines how sustainable finance affects businesses and FIs’ finances. " COVID-19’ explores the pandemic's impact on ESG and sustainable financing. "Climate change" and "environmental performance" discuss corporate and financial institutions’ climate change strategies and ecological footprints.
The co-occurrence analysis of author keywords shows FIs’ SRI themes. It emphasizes "green finance" and sustainable investments, technologies, and financial methods that incorporate sustainable development. Moreover, it emphasizes "sustainable development" and responsible investing, aligning strategies with sustainability goals and pension fund involvement. SDG integration, sustainability reporting, and governance's influence are examined. Furthermore, it emphasizes ethical inclusion, "sustainable investment," and pandemic repercussions in CSR and SRI. Likewise, it explores SRI's broad scope through "mutual funds" and "financial markets". Additionally, it emphasizes CSR, sustainability, stakeholder involvement, and "sustainability performance". Moreover, it focuses on "ESG," "SDGs," "sustainable finance", "financial performance", "COVID-19 pandemic”, and "climate change". These clusters illustrate SRI's significance in financial institutions' sustainability, responsible practices, stakeholder engagement, and ESG integration.
Discussion
Bibliometric Performance Analysis
This bibliometric analysis illuminates SRI and sustainable finance research. The studies conducted during the time period (1990–2023) show climate change and finance research's relevance. A total of 11 subdomains examined SRI, sustainable finance, and impact investment, focusing on business, economics, social science, and environmental science. Especially, transdisciplinary understanding is important. Journal of Cleaner Production dominates publications and citations. Comparing prolific Spanish scholars, Aibar-Guzmán and García-Sánchez stand out. This analysis sheds light on sustainable finance and SRI research.
Bibliometric Scientific Mapping
The inter-country co-authorship relationships in the field of SRI within FIs. The data demonstrates a greater incidence of co-authorship relationships in countries, such as China, the UK, the USA, Spain, India, Italy, Germany, and France. These countries are ranked according to co-authorship metrics, wherein China holds the highest position in terms of link count (33) and link strength (82), followed by the UK and the USA. The findings demonstrate substantial collaboration and influence exerted by these nations in the field of SRI inside FIs. Exploring keyword co-occurrences revealed five critical nodes linking SRI, sustainability, and other pertinent words. It stressed "mutual funds," "sustainable development," and "SDGs". FIs' SRI and CSR were strongly linked. The study addresses green finance, responsible investing, SDGs, sustainability reporting, and stakeholder engagement. It emphasizes incorporating ESG factors into financial choices and evaluating sustainable finance's success. The study highlighted SRI's importance and ethical practices in financial institutions’ sustainability.
Knowledge Gap
The discussion section highlighted sustainable finance and SRI research gaps. It analyzed temporal patterns, however, did not investigate the causes of these trends, indicating a need for more research. The predominance of some nations raises doubts regarding their geographical causes. Promoting multidisciplinary inquiry shows a knowledge gap in transdisciplinary issues. The publication metrics debate emphasizes the necessity to evaluate research's practical impact. Measurement frameworks for aligning investments with sustainability goals, ethical financial decision-making, and COVID-19's long-term influence on sustainable finance need to be explored.
Directions for Future Research
The current bibliometric study suggested several possible sustainable finance and SRI research directions. Understanding research trends, country collaborations, and multidisciplinary contributions are crucial. Moreover, developing stronger research impact assessments and studying ethical issues in sustainability financing are crucial. Technology, macroeconomics, and COVID-19's consequences provide valuable research insights. Assessing practical challenges to sustainable financial solutions and ethical decision-making demands detailed exploration. Addressing these gaps may help academia, industry, and policymakers comprehend sustainable finance, societal values, and economic dynamics.
Limitations
The debate highlighted many shortcomings pertaining to the study. It analyzed bibliometric data to identify sustainable finance and SRI patterns and relationships, however, it did not analyze the underlying factors, which may restrict its answers. The study did not investigate contextual factors that boost some countries' popularity. Using publication metrics and citations alone may not accurately reflect research quality and impact. Although, admitting the need for multidisciplinary inquiry, the study did not thoroughly discuss interdisciplinary collaboration problems and rewards. A confined temporal scope, reliance on a single data source possibly adding bias, absence of qualitative insights, such as interviews, and static analysis not capturing the subject's dynamic character are other drawbacks.
Conclusion
The current study aimed to investigate the role of SRI in FIs through a thorough bibliometric analysis, in accordance with the objectives of the research. The findings revealed a dynamic ecosystem in which research on SRI has undergone evolutionary changes throughout time. Discernible changes have arisen, specifically the escalating focus on climate change investigation between 2011 and 2019, indicating the increasing significance of SRI in tackling present-day difficulties. The increasing emphasis on sustainability and social responsibility in the field of finance has been observed through a notable rise in finance research from 2019-2023. The research highlighted multidisciplinary role of SRI, which encompasses several subdomains, such as business, management, economics, and environmental science. This stresses the importance of employing interdisciplinary methodologies.
Research Implications
The research gaps that have been explored have significant implications for the advancement of knowledge within the discipline. The study shed light on temporal patterns, indicating a strong necessity to delve deeper into the fundamental factors driving these changes. The examination of contextual factors that contribute to the popularity of some nations in the study of SRI is of utmost importance. This investigation revealed geographical intricacies that play an important role in their leadership. Furthermore, the study highlighted the importance of interdisciplinary inquiry, hence offering a research opportunity to explore the intricacies and obstacles of collaborative endeavors within many fields of study.
Table 1
Augmented Dickey-Fuller (ADF) Unit Root Test for Data Stationarity
|
Variable |
Level |
1st Difference |
Critical Values (Mackinnon) for Rejection of Hypothesis of a Unit Root |
Decision |
Order of Integration |
||
|
1.00% |
5.00% |
10.00% |
|||||
|
Low-Risk Portfolio Returns |
-1.15 |
-8.454 |
-3.596 |
-4.624 |
-3.205 |
Shows Stationarity at first difference |
I (1) |
|
Market-Based Portfolio Returns |
-1.33 |
-9.365 |
-4.654 |
-2.243 |
-3.102 |
Shows Stationarity at first difference |
I (1) |
|
GFC (2007-09) |
-2.34 |
-2.245 |
-3.962 |
-4.204 |
-4.950 |
Non-Stationarity |
I (0) & I (1) |
|
GPC (2019-21) |
-3.90 |
-4.062 |
-6.152 |
-6.840 |
-7.524 |
Non-Stationarity |
I (0) & I (1) |
Table 2
Phillips-Perron (PP) Unit Root Test
|
Variable |
Level |
First Difference |
Mackinnon Critical Values for Rejection of Hypothesis of a Unit Root |
Decision |
Order of Integration |
||
|
1% |
5% |
10% |
|||||
|
Low-Risk Portfolio Returns |
1.684 |
10.845 |
3.961 |
3.411 |
3.127 |
Non-stationary at level but stationary at first difference |
I (1) |
|
Market-Based Portfolio Returns |
1.265 |
9.128 |
2.906 |
3.160 |
4.109 |
Non-stationary at level but stationary at first difference |
I (1) |
|
GFC (2007-09) |
-5.674 |
-3.220 |
-7.225 |
-9.419 |
-7.055 |
Non-Stationarity at |
I (0) & I (1) |
|
GPC (2019-21) |
-6.270 |
-3.902 |
-8.741 |
-8.690 |
-9.600 |
Non-Stationarity at |
I (0) & I (1) |
Note. *- GFC stands for Global Financial Crisis and GPC stands for Global Pandemic Crisis
Tables 1 and 2 apply unit root tests to RWH using the low-risk and market-based portfolio returns. As a result, the returns of the Low-Risk and Market-Based Portfolios show non-stationarity at 1% and 5% levels. The tests were also carried out for the GFC and GPC, and the results show non-stationary during both periods. For the purpose of comparative analysis, we report annualized returns and risk in Table 3.
Table 3
Raw Performance
|
Types of portfolios |
Annualized returns (%) |
Annualized risk (%) |
Skewness |
Kurtosis |
GFC Returns (%) |
GPC Returns (%) |
GFC Risk (%) |
GPC Risk (%) |
|
Market-capitalization weighted portfolio |
8.342 |
22.150 |
-1.056 |
5.483 |
1.247 |
2.547 |
0.396 |
0.315 |
|
Low-risk weighted portfolio |
6.553 |
14.262 |
-0.336 |
1.405 |
1.307 |
2.744 |
0.297 |
0.130 |
Note. GFC stands for Global Financial Crisis (2008-09), and GPC (2020-21) stands for Global Pandemic Crisis
Table 3 indicates that the market-capitalization-based portfolio results in 8.34% annualized returns for the span of 2005-2022. The low-risk-based portfolio results in 6.55% annualized returns in the same period. This means the market-capitalization-based portfolio produces higher returns than the low-risk-based portfolio by 179 basis points. These results are consistent with (Boudt et al., 2019; Chow et al., 2014; and Raza & Ashraf, 2019). Investors do not only care about returns but also consider risk when assessing any investment opportunity. It can be observed that a market-capitalization weighted portfolio results in a relatively high standard deviation compared to a low-risk weighted portfolio. This means that market-capitalization-weighted portfolio returns are more volatile than the low-risk-weighted portfolio. Thus, we conclude that investors who invest in market-capitalization-weighted portfolios bear higher risk than low-risk investors. Upon comparing the portfolio returns during the GFC and the GPC, the tabulated values distinctly indicate higher returns for the low-risk-based portfolio. Furthermore, the standard deviations for both portfolios have been calculated, confirming that the market capitalization portfolio carries relatively higher risk.
Cumulative Performance
To compare the cumulative performance, the returns are on the vertical axis and the period on the horizontal axis.
Figure 2
Cumulative Performance and Relative Performance
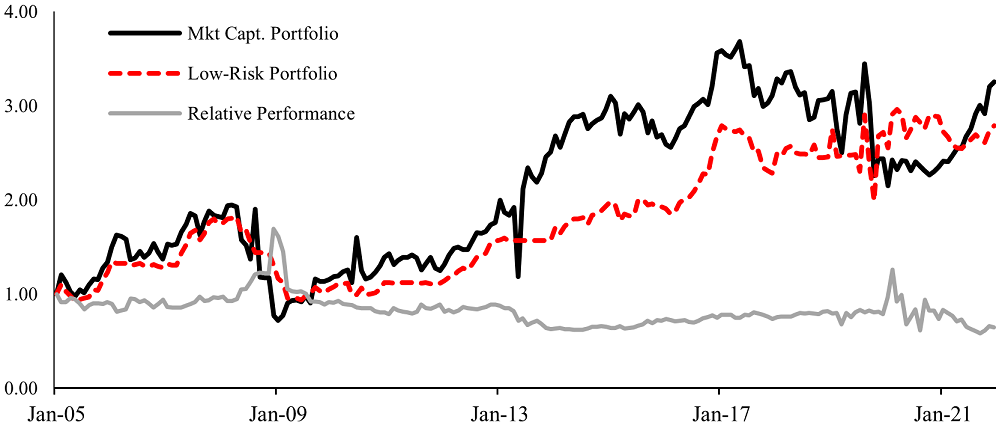
The black line indicates the raw performance of market-capitalization-weighted portfolios, while the dotted line shows the low-risk weighted portfolio performance. The cumulative performance is estimated by investing $1 in both portfolios in 2005, letting the investment mature until 2022. The results are reported in Figure 2.
The results in Figure 2 show an exciting trend. It can be observed that prior to the GFC in 2008, the market-capitalization weighted strategy resulted in superior cumulative financial performance compared to the low-risk weighted strategy. However, in the GFC and the GPC, the market capitalization strategy incurred significant losses. It is the low-risk weighted strategy that shows resistance to the crisis. In the post-crisis periods of GFC and GPC, the low-risk weighted strategy showed an upward trend compared to the market-capitalization-based portfolio. It is also important to mention that in both post-crisis periods, the line that represents the returns of the low-risk weighted portfolio is well above the market-capitalization weighted portfolio, and this is a clear indication of the superior performance.
With upward sloping, the investment strategy mentioned in the study (low-risk weighted portfolio) outperforms the benchmark strategy and vice versa. It is observed that at the start of 2005, the line was downward sloping minutely, rising again, showing that the MC investment strategy was performing better than the LR investment strategy and vice versa. This trend continues till December 2006. The line rises upward in the GFC (2007-2009) and the GPC (2020-22). In this period, the LR was relatively more successful in absorbing the shocks and almost outperformed the MC investment strategy. In the post-crisis period, the MC portfolio performed superiorly to the LR Portfolio. Though there are a few corrections periods, overall, the LR investment strategy can perform better than its counterpart. This observation of the outperformance of the LR strategy is consistent with the findings of Boudt et al. (2019).
From the above graph, one can say that the maximum drawdowns in both low-risk and market-based portfolios during the global financial crisis (2007-09) declined gradually and flatly, taking more time to recover. However, the end of the graph shows more sudden and huge drawdowns caused by the global pandemic crisis (2019-21) but recovers more quickly.
Risk-Adjusted Performance, Semi Deviation and Gain Deviation
Sharpe ratio provides results in relative terms, which are reported in Table 4. This ratio is 0.37, which means that the investor receives 0.37 units of returns for each unit of risk. In comparison, the low-risk weighted portfolio results in a 0.45 Sharpe ratio. These results show that in terms of risk-adjusted performance, the low-risk weighted portfolio outperformed the market capitalization portfolio by 80 basis points.
Semi-deviation only shows the extent to which portfolio returns have shown downward moments. The result indicates that the low-risk based investment strategy positively affects the semi deviation of the market-capitalization based investment strategy and it has reduced the semi-deviation from 0.04 to 0.02.
It can be seen that the market-capitalization strategy has a high gain deviation compared to the low-risk strategy's gain deviation. This shows that a market-capitalization portfolio has more winning periods than a low-risk strategy's winning periods. These results are consistent with the previous findings of annualized returns in the study.
Table 4
Risk-Adjusted Performance and Semi Deviation
|
S.No. |
Types of Portfolios |
Sharpe Ratio |
|
1 |
Market capitalization-weighted portfolio |
0.37 |
|
2 |
Low-risk weighted portfolio |
0.45 |
|
|
|
Semi deviation |
|
1 |
Market capitalization-weighted portfolio |
0.04 |
|
2 |
Low-risk weighted portfolio |
0.02 |
|
|
|
Sharpe Ratio |
|
1 |
Market capitalization weighted portfolio |
0.03 |
|
2 |
Low-risk weighted portfolio |
0.02 |
|
|
Coefficient of variation |
|
|
1 |
Market-capitalization weighted portfolio |
0.265 |
|
2 |
Low-risk weighted portfolio |
2.177 |
In addition to the standard Sharpe ratio, the COV reported in the last three rows of Table 4 was also estimated. A small COV value indicates little variability, and vice versa. Thus, it is used as the criterion for the consistent performance of both portfolios.
The GFC-2008 pushed many portfolios into significant losses, therefore, in the last decade, fund managers and academia alike stressed the use of additional risk assessment measures as compared to the traditional measures of risk. The primary purpose of such an analysis is to answer important questions, such as the number of resources a portfolio needs to recover from the worst losses. One may wonder how deeply a fund is affected by market drawdowns as well as the loss a portfolio may incur during a single rebalancing period. The following tests were conducted to answer the above questions.
Value at Risk, Drawdown Analysis and Expected Shortfall
This study estimates the VaR of both portfolios at a 95% confidence interval. Table 5 indicates that the market-capitalization weighted portfolio results in a VaR value of -9.37%. In comparison, the low-risk weighted portfolio results in relatively lower VaR statistics, i.e., -6.98 %. This means the manager must keep about 7% of its assets in reserves to deal with fund redemption. The result concludes that the low-risk weighted portfolio is less exposed to fund redemption risk than the market-capitalization weighted portfolio by a difference of 3%. Table 5 indicates that the portfolio based on market capitalization results in a VaR value of -9.37%.
The drawdown analysis shows when a portfolio needs to recover from the previous losses. Drawdown also shows a temporary decline in a fund's net asset value. This technique has gained popularity and is widely accepted as a practice risk assessment measure. Table 5 indicates that the market-cap portfolio has a historical drawdown of 62.85% for the said period. This indicates the maximum level of fund redemption for the market-cap strategy. Most of the world markets suffered significant losses due to the spillover effects of GFC-2008. PSX is based on market capitalization, therefore, huge losses in 2007-08 were expected if the investors had followed the market-cap strategy.
In comparison to the MC-weighted portfolio, the LR-weighted strategy has a maximum drawdown of 48.50 %. Therefore, one may conclude that the LR-weighted portfolio has experienced fewer losses and a shorter period underwater. However, the drawdowns for the latter are still significantly high and exposed to the spillover effect of the crisis.
One of the possible reasons for lower drawdowns of the lower-risk weighted portfolio is its ability to identify stocks of firms having low volatility. These firms are less risky and result in lower volatility; therefore, they can be used as a possible hedge against a financial crisis. The expected shortfall estimates the worst losses based on a mostly arbitrary benchmark. This study estimates VaR on a 95% confidence interval, therefore, the expected shortfall will estimate the average outcomes of the worst 5% of cases. Lastly, the GFC and GPC further intensify VaR results in almost all cases with little variations.
Table 5
Value at Risk, Maximum Drawdowns, and Expected Shortfall
|
S.No. |
Types of portfolios |
Value at Risk |
GFC |
GPC |
|
1 |
Market-capitalization weighted portfolio |
-9.3701 |
-9.8552 |
-9.5730 |
|
2 |
Low-risk weighted portfolio |
-6.9805 |
-7.3506 |
-7.0051 |
|
Maximum drawdowns |
|
|
||
|
1 |
Market-capitalization weighted Portfolio |
0.6285 |
0.5708 |
0.5823 |
|
2 |
Low-risk weighted portfolio |
0.4850 |
0.4235 |
0.4133 |
|
Historical Expected Shortfall (95%) |
|
|
||
|
1 |
Market-capitalization weighted Portfolio |
-0.1508 |
-0.1928 |
-0.2053 |
|
2 |
Low-risk weighted portfolio |
-0.0940 |
-0.09843 |
-0.0998 |
The result shows that a market-capitalization-based portfolio has an expected shortfall of -15.08%, shown in column 3. In comparison, a low-risk weighted portfolio resulted in an average expected shortfall of -9.40% in column 3. A low-risk weighted portfolio has a positive effect on the shortfall, and it reduces the worst losses by almost 6%.
Relative Performance
To highlight the performance of low-risk strategy in market turmoil, the relative performance of low-risk strategy for 2005-2022 has been plotted. To obtain the relative performance, the market-cap weighted portfolio is considered as a benchmark portfolio. By assuming that one invests $1 in a low-risk weighted portfolio and $1 in a market-capitalization weighted portfolio, the relative performance is obtained by taking the returns in relative terms. Such a comparison enables the research to investigate the relative performance in different periods. The results are presented in Figure 4.3.
Before discussing the graph in Figure 4.3, it is important to analyze the slope and direction of the line graph. Simply, if the line graph showing relative performance moves up, it means the low-risk portfolio is outperforming the market-capitalization portfolio.
Inferential Analysis by Applying Paired T-test
To assess whether the differences in the performance of both portfolios significantly contradictory, the inferential statistics have been presented using a Paired t-test; the results are reported in Table 6.
Table 6
Paired t-Test
|
S.No. |
Types of portfolios |
Mean |
DIM |
Pair t test |
p value |
|
1 |
Market-capitalization weighted portfolio |
8.341 |
1.82 |
2.451 |
0.000 |
|
2 |
Low-risk-based weighted portfolio |
6.543 |
Note. DIM shows difference in mean of both portfolios.
The results in Table 6 show that a market-capitalization portfolio's mean value is higher than a low-risk strategy's mean returns. This implies that the means of both portfolios are equal to 1.8. The results of the "t" test and "p" value prove that there is a significant difference in the mean returns of both portfolios.
Robustness Check
Table 7
Quantile Regression
|
S.no. |
Types of Portfolios |
Quantile |
Coefficient |
Standard Error |
p-Value |
|
1. |
Low-Risk based Portfolio |
10th |
0.115 |
0.023 |
0.053 |
|
90th |
0.165 |
0.041 |
0.035 |
||
|
2. |
Market-capitalization weighted Portfolio |
10th |
0.195 |
0.045 |
0.031 |
|
90th |
0.315 |
0.063 |
0.025 |
Table 8
Wilcoxon Signed-Rank Test
|
S.No. |
Types of portfolios |
Mean |
Wilcoxon S-RT |
p value |
|
1 |
Market-capitalization weighted portfolio |
8.351 |
0.000 |
0.000 |
|
2 |
Low-risk weighted portfolio |
6.550 |
Quantile regression estimates conditional quantiles, assesses how return and risk profiles vary across quantiles and examines the impact of market factors on portfolio returns. The 10th percentile indicates the performance of stocks with the lowest returns, generally reflecting weak results in adverse market conditions. In contrast, the 90th percentile highlights stocks with the highest returns, showcasing resilience in volatile equity markets. Low-risk portfolios typically show smaller coefficients, indicating lower sensitivity to market factors, while market-based portfolios exhibit larger coefficients, reflecting greater risk exposure. The study used the Wilcoxon Signed-Rank Test alongside the Paired T-test, yielding consistent results that support the study's conclusions.
Conclusion
Diversification is the main essence of CAPM, and investors hold different stocks within their portfolios to minimize risk and maximize returns. In practice, market anomalies challenge the traditional CAPM and indicate that beta is not the only factor that explains the cross-section of equity returns. One such anomaly is the persistent performance of low-risk stocks in both the long and short run. Low-volatility stocks have outperformed those with high volatility over the last several decades. Low-volatility investing provides high returns at lower risk than traditional market-cap-weighted indexing and is persistent across time and countries. The lower volatility originates from reduced exposure to the market factor, while the high returns come from assessing high Sharpe's ratio factors such as beating against Beta, value, and duration. The performance of low-risk stocks has been tested in different asset classes.
The study initially checked for the normality of the data using different stationary unit root tests, which allow to perform further analyses. The results show that the MC portfolio is better in terms of annualized returns, however, the LR portfolio can reduce the risk of the broader market portfolio. Due to the lower risk, the LR portfolio results in a higher Sharpe ratio. Furthermore, the LR portfolio also has an advantage in terms of downside risk and exhibits lower drawdowns and VaR. In addition to recovery periods, the study also analyzed decline periods and quick recovery periods for GFC and GPC. To sum up the discussion, it can be inferred that LR Portfolio has fewer chances of fund redemption and requires relatively less amount of assets to recover the losses. Finally, one may confirm that the low-risk-based strategy underperforms the market-capitalization-based strategy in a bearish market(s). At the same time, it can be used as a hedging tool against market downturns in developing economies like Pakistan.
Practical Implications of the Study
The results emphasize how portfolios respond under various economic conditions, offering valuable insights for creating more resilient investment strategies. Investors can better anticipate potential risks and make informed portfolio adjustments by analyzing Value at Risk (VaR) metrics, semi-deviation, drawdown, and recovery dynamics. These findings also guide asset allocation strategies. A diversified approach can help optimize risk-adjusted returns, while regular rebalancing ensures that the portfolio remains aligned with the investor's risk tolerance and financial goals. Portfolio managers must consider rebalancing strategies tailored to their client's investment horizons and risk profiles. This proactive approach can help mitigate significant drawdowns and capitalize on potential opportunities.
Limitations of the Study
- The use of alternative measures, inclusion and comparative study can improve the generalizability of the results.
- The study does not address transaction costs, market liquidity, or practical constraints like minimum trade sizes, which are crucial for implementing low-risk strategies. Future studies would provide a realistic perspective, especially if they are aimed at institutional investors.
Conflict of Interest
The author of the manuscript has no financial or non-financial conflict of interest in the subject matter or materials discussed in this manuscript.
Data Availability Statement
The data associated with this study will be provided by the corresponding author upon request.
Finding details
This research did not receive grant from any funding source or agency.
Bibliography
Adhami, S., Gianfrate, G., & Johan, S. (2023). Risks and returns in crowdlending. Eurasian Business Review, 13(2), 309–340. https://doi.org/10.1007/s40821-022-00236-x
Alighanbari, M., Doole, S., & Shankar, D. (2016). Designing low-volatility strategies. The Journal of Index Investing, 7(3), 21–33. https://doi.org/10.3905/jii.2016.7.3.021
Almansour, B. Y., Elkrghli, S., & Almansour, A. Y. (2023). Behavioral finance factors and investment decisions: A mediating role of risk perception. Cogent Economics & Finance, 11(2), Article e2239032. https://doi.org/10.1080/23322039.2023.2239032
Ang, A., Hodrick, R. J., Xing, Y., & Zhang, X. (2009). High idiosyncratic volatility and low returns: International and further US evidence. Journal of Financial Economics, 91(1), 1–23. https://doi.org/10.1016/j.jfineco.2007.12.005
Asness, C. S., Frazzini, A., & Pedersen, L. H. (2014). Low-risk investing without industry bets. Financial Analysts Journal, 7(4), 24–41. https://doi.org/10.2469/faj.v70.n4.1
Baker, M., Bradley, B., & Wurgler, J. (2011). Benchmarks as limits to arbitrage: Understanding the low-volatility anomaly. Financial Analysts Journal, 67(1), 40–54. https://doi.org/10.2469/faj.v67.n1.4
Baker, N. L., & Haugen, R. A. (2012). Low risk stocks outperform within all observable markets of the world. SSRN. http://dx.doi.org/10.2139/ssrn.2055431
Banz, R. W. (1981). The relationship between return and market value of common stocks. Journal of Financial Economics, 9(1), 3–18. https://doi.org/10.1016/0304-405X(81)90018-0
Bekaert, G., Harvey, C. R., & Lundblad, C. (2006). Growth volatility and financial liberalization. Journal of International Money and Finance, 25, 370–403. https://doi.org/10.1016/j.jimonfin.2006.01.003
Bishwal, J. P. (2022). Stochastic Volatility Models: Methods of Pricing, Hedging and Estimation. In Parameter estimation in stochastic volatility models (pp. 1–77). Cham: Springer International Publishing.
Black, F., Jensen, M. C., & Scholes, M. (1972). The Capital asset pricing model: Some empirical tests. In M. C. Jensen (Ed.), Studies in the theory of capital markets. Praeger.
Blitz, D. C., & Van Vliet, P. (2007). The volatility effect. The Journal of Portfolio Management, 34(1), 102–113. https://doi.org/10.3905/jpm.2007.698039
Blitz, D., & De Groot, W., (2014). Strategic allocation to commodity factor premiums. Journal of Alternative Investments, 17, 103–115. http://dx.doi.org/10.2139/ssrn.2265901
Blitz, D., Pang, J., & Van Vliet, P. (2013). The volatility effect in emerging markets. Emerging Markets Review, 16, 31–45. https://doi.org/10.1016/j.ememar.2013.02.004
Bordo, M. D., & Landon-Lane, J. S. (2010). The global financial crisis of 2007-08: Is it unprecedented? (No. w16589). National Bureau of Economic Research.
Boudt, K., Raza, M. W., & Ashraf, D. (2019). Macro-financial regimes and performance of Shariah-compliant equity portfolios. Journal of International Financial Markets, Institutions and Money, 60, 252–266. https://doi.org/10.1016/j.intfin.2019.01.001
Bradrania, R., Veron, J. F., & Wu, W. (2023). The beta anomaly and the quality effect in international stock markets. Journal of Behavioral and Experimental Finance, 38, Article e100808. https://doi.org/10.1016/j.jbef.2023.100808
Cao, J., & Han, B. (2013). Cross section of option returns and idiosyncratic stock volatility. Journal of Financial Economics, 108(1), 231–249. https://doi.org/10.1016/j.jfineco.2012.11.010
Carhart, M. M. (1997). On persistence in mutual fund performance. The Journal of Finance, 52(1), 57–82. https://doi.org/10.1111/j.1540-6261.1997.tb03808.x
Chen, J. (2017). What explains the investment anomaly in the Chinese stock market? Nankai Business Review International, 8(4), 495–520. https://doi.org/10.1108/NBRI-05-2016-0021
Chen, X. B., Silvapulle, P., & Silvapulle, M. (2014). A semiparametric approach to value-at-risk, expected shortfall and optimum asset allocation in stock–bond portfolios. Economic Modelling, 42, 230–242. https://doi.org/10.1016/j.econmod.2014.07.010
Chow, T. M., Hsu, J. C., Kuo, L. L., & Li, F. (2014). A study of low-volatility portfolio construction methods. The Journal of Portfolio Management, 40(4), 89–105. https://doi.org/10.3905/jpm.2014.40.4.089
Dimson, E., Marsh, P., & Staunton, M. (2017). Factor-based investing: The long-term evidence. Journal of Portfolio Management, 43(5), 15–37. https://doi.org/10.3905/jpm.2017.43.5.015
Fama, E. F. (1965a). The behavior of stock-market prices. The Journal of Business, 38(1), 34–105. https://doi.org/10.1086/294743
Fama, E. F. (1965b). Random walks in stock-market prices. Financial Analysis Journal, 51(1), 75–80. https://doi.org/10.2469/faj.v51.n1.1861
Fama, E. F., & French, K. R. (1992). The cross‐section of expected stock returns. The Journal of Finance, 47(2), 424–465. https://doi.org/10.1111/j.1540-6261.1992.tb04398.x
Fama, E. F., & French, K. R. (1993). The common risk factors in the returns of stocks and bonds. The Journal of Financial Economics, 33(1), 3–56. https://doi.org/10.1016/0304-405X(93)90023-5
Fama, E.F., French, K.R., (1998). Value versus growth: The international evidence. Journal of Finance, 53, 1975–1999. https://doi.org/10.1111/0022-1082.00080
Fama, E. F. (1970). Efficient capital markets. Journal of Finance, 25(2), 383–417. https://doi.org/10.7208/9780226426983-007
Frazzini, A., & Pedersen, L. H. (2014). Betting against beta. Journal of Financial Economics, 111(1), 1–25. https://doi.org/10.1016/j.jfineco.2013.10.005
Ghufran, B., Awan, H. M., Khakwani, A. K., & Qureshi, M. A. (2016). What causes stock market volatility in Pakistan? Evidence from the field. Economics Research International, 2016. Article e3698297 https://doi.org/10.1155/2016/3698297
Gupta, S., (2018). Risk anomaly exploration in Indian stock market. International Journal of Scientific & Engineering Research, 9(7), 1207–1210.
Han, X., Li, K., Li, Y. (2020). Investor overconfidence and the security market line: New evidence from China. Journal of Economic Dynamics and Control, 117, Article e103961. https://doi.org/10.1016/j.jedc.2020.103961
Haugen, R. A., & Baker, N. L. (1991). The efficient market inefficiency of capitalization-weighted stock portfolios. Journal of Portfolio Management, 17(3), 35–40.
Haugen, R. A., & Baker, N. L. (2008). The handbook of portfolio construction: Contemporary applications of Markowitz techniques. Forthcoming.
Haugen, R. A., & Heins, A. J. (1975). Risk and the rate of return on financial assets: Some old wine in new bottles. Journal of Financial and Quantitative Analysis, 109(5), 775–784. https://doi.org/10.2307/2330270
Hou, K., Xue, C., & Zhang, L. (2020) Replicating anomalies. The Review of Financial Studies, 33(5), 2019–2133. https://doi.org/10.1093/rfs/hhy131
Hussain, F., & Uppal, J., (1999). Stocks return volatility in an emerging market: The Pakistani evidence. Pakistan Journal of Applied Economics, 15(1) and (2), 19–40.
Hussain, N., & Khan, M. T. (2023). Firm's growth and share price volatility: Evidence from Pakistan. UW Journal of Management Sciences, 7(1), 128–139.
Jensen, T.I., Kelly, B.T., & Pedersen, L.H. (2022). Is there a replication crisis in finance? NBER Working Paper Series, Article ew28432. https://doi.org/10.1111/jofi.13249
Joshipura, N., & Joshipura, M. (2019). The volatility effect: Recent evidence from Indian markets. Theoretical Economics Letters, 9(6), 2152–2164. https://doi.org/10.4236/tel.2019.96136
Kothe, J., Lohre, H., Rother, C. (2021). Rates factors and global asset allocation. Journal of Fixed Income, 30(3), 6–25. https://doi.org/10.3905/jfi.2020.1.098
Lee, K. H. (2011). The world price of liquidity risk. Journal of Financial Economics, 99(1), 136–161. https://doi.org/10.1016/j.jfineco.2010.08.003
LeRoy, S. F., & Porter, R. D. (1981). The present-value relation: Tests based on implied variance bounds. Econometrica: Journal of the Econometric Society, 555–574. https://doi.org/10.2307/1911512
Li, X., Sullivan, R. N., & Garcia-Feijóo, L. (2014). The limits to arbitrage and the low-volatility anomaly. Financial Analysts Journal, 70(1), 52–63. https://doi.org/10.2469/faj.v70.n1.3
Lintner, J. (1965). The valuation of risk assets and the selection of risky investments in stock portfolios and capital budgets. Review of Economics and Statistics, 47(1), 13–37. https://doi.org/10.2307/1924119
Malkiel, B. G. (2003). The efficient market hypothesis and its critics. Journal of Economic Perspectives, 17(1), 59–82. https://doi.org/10.1257/089533003321164958
Markowitz, H. (1952). Portfolio SELECTION. The Journal of Finance, 7(1), 77–91. https://doi.org/10.1111/j.1540-6261.1952.tb01525.x
Markowitz, H. (1965). Portfolio selection: Efficient diversification of investments. John Wiley & Sons.
Mossin J, (1966). Equilibrium in a capital asset market. Econometrica, 35(4), 768–783. https://doi.org/10.2307/1910098
Mubarak, M. F., Shaikh, F. A., Mubarik, M., Samo, K. A., & Mastoi, S. (2019). The impact of digital transformation on business performance: A study of Pakistani SMEs. Engineering Technology & Applied Science Research, 9(6), 5056–5061.
Patel, S. A., & Sarkar, A. (1998). Crises in developed and emerging stock markets. Financial Analysts Journal, 54(6), 50–61. https://doi.org/10.2469/faj.v54.n6.2225
Pyun, C. (2021). Documenting the post-2000 decline in the idiosyncratic volatility effect. Critical Finance Review, 10(3), 419–427. https://doi.org/10.1561/104.00000095
Raza, M. W., & Ashraf, D. (2019). Does the application of smart beta strategies enhance portfolio performance? The case of Islamic equity investments. International Review of Economics & Finance, 60, 46–61. https://doi.org/10.1016/j.iref.2018.12.001
Raza, M. W., Said, B., & Elshahat, A. (2023). Covid-19 and informational efficiency in Asian emerging markets: A comparative study of conventional and Shariah-compliant stocks. International Journal of Islamic and Middle Eastern Finance and Management, 16(3), 576–592. https://doi.org/10.1108/IMEFM-01-2022-0041
Rouwenhorst, K. Geert, 1999, Local return factors and turnover in emerging stock markets, Journal of Finance, 54, 1439–1464. https://doi.org/10.1111/0022-1082.00151
Saengchote, K. (2017). The low-risk anomaly: Evidence from Thai Stock market. Asian Academy of Management Journal of Accounting & Finance, 13(1), 143–158. https://doi.org/10.21315/aamjaf2017.13.1.6
Said, B., Raza, M. W., & Elshahat, A. (2024). Does market microstructure affect time-varying efficiency? Evidence from emerging markets. Research in International Business and Finance, Article e102347. https://doi.org/10.1016/j.ribaf.2024.102347
Said, B., Rehman, S. U., Ullah, R., & Khan, J. (2021). Investor overreaction and global financial crisis: A case of Pakistan stock exchange. Cogent Economics & Finance, 9(1), Article e1966195. https://doi.org/10.1080/23322039.2021.1966195
Sharpe, W. F. (1964). Capital asset prices: A theory of market equilibrium under conditions of risk. The Journal of Finance, 19(3), 425–442. https://doi.org/10.1111/j.1540-6261.1964.tb02865.x
Thaler, R. H. (1999). The end of behavioral finance. Financial Analysts Journal, 55(6), 12–17.
Traut, J. (2023). What we know about the low-risk anomaly: A literature review. Financial Markets and Portfolio Management, 37(3), 297–324. https://doi.org/10.1007/s11408-023-00427-0
Hart, V., Slagter. E., & Dijk, D. (2003). Stock selection strategies in emerging markets. Journal of Empirical Finance, 10(1–2), 105–132. https://doi.org/10.1016/S0927-5398(02)00022-1
Yalçın, K. C. (2010). Market rationality: Efficient market hypothesis versus market anomalies. European Journal of Economic and Political Studies, 3(2), 23–38.
Yang, B., & Ma, Y. (2021). Value at risk, mispricing and expected returns. International Review of Financial Analysis, 78, Article e101902. https://doi.org/10.1016/j.irfa.2021.101902
Zia-ur-Rehman, M. (2023). Critical issues of governance in Pakistan: Strategies and Solutions. ISSRA Papers, 15(1), 77–86.
[1] i.e., The S&P 500 Low Volatility Index chooses the 100 stocks with the lowest volatility.