Tanzeel Sultan Rana*1,Imran Saleem2, Rabia Naseer Rao1,Maryam Shabbir2, Laiba Wahid Chaudary1
School of Professional Advancement, University of Management and Technology, Lahore, Pakistan
Department of Computer Sciences, Bahria University, Lahore, Pakistan
Octans Digital Pvt Ltd. 92-cc,Ex-Park View, Lahore ,Pakistan
* Corresponding Author: [email protected]
INDEX TERMS Decision Tree (DT), K-Nearest Neighbor (KNN), Logistic Regression (LR), Support Vector Machine (SVM), Machine Learning (ML), Multilayer Perceptron (MP), Random Forest (RF)
Cancer is a complex disease, which is characterized by uncontrolled growth of abnormal tissue in the entire body. Normally, old or damaged cells are replaced by new and healthy cells to maintain a healthy functioning of body . Contrastingly, some damaged tissue incessantly grows and become a mass of tissues known as a tumour in the human body. There are two types of tumours, for instance, malignant and benign tissue. The current study focused on breast cancer tumours along with Machine Learning Algorithms (MLA). Primarily, the breast composed of two main types of tissue: glandular tissue and connective tissue. Glandular tissues are responsible for producing milk, whereas connective tissues provide structural support and shape the breast. Glandular tissues may convert into malignant tumours with the passage of time. Most breast cancers emanate in the cells of the lobules, the anatomical structures that consist of milk-producing glands, or in the ducts embedded amid the breast tissue, which acts as the passageways that deliver milk from the lobules to the nipples. Breast stromal tissues, which are composed of fatty and fibrous connective tissues, can also cause breast cancer. The overall structural deformation of a woman's breast tissue caused by the presence of a malignant tumour is influenced by age-related changes in the amount of fatty and fibrous tissues in her body[1]. The death rate annually has significantly increased due to the rising cases of breast cancer. Recently, it has been observed that a massive death rate is due to breast cancer[2].
The majority of female patients normally do not have a good prognosis for it at the stage when it is eventually recognised for what it is a cancer of breast tissue which accounts for its high lethality./ Its high fatality rate is due to the unfortunate reality and less awareness regarding this disease, which has not only increased the poor-prognosis due to last-stage detection but it has also caused malignancy in breast tissues. Breast cancer usually develops by a genetic abnormality, or defect, in the inherent code. This inherited genetic abnormality can cause erroneous gene expression, which becomes a prime reason for its cause and development. Only 5-10% of the cancer cases were observed to be because of inherited abnormalities from your mother or father. Instead, 85-90% of breast cancer cases are due to genetic abnormalities, which arise with aging [3].
In order to improve different areas of treatment and raise patients' chances of survival, accurate cancer detection is important./ Accurate diagnosis of cancer is essentially important to optimize various aspects of therapy and to increase the chances of survivability of patients. Many researchers have put forth various approaches for automatic cell classification to diagnose breast cancer in the recent years. Therefore, it was observed that Machine learning techniques stand out among them for the classification and prediction of breast cancer among female patients [4]. Machine learning methods were used to identify cancer and determine whether a tumour is present or not, it may be useful in the study of breast cancer. Additionally, these cancer tumors can be predicted using machine-learning techniques (MLAs). When using conventional methods of diagnosis, these cancer tumors might frequently go undetected for a long time [5]. Thereby, increasing the proportion of deaths brought by cancer.
Machine learning techniques (MLs) have recently emerged as a highly relevant area in practical research, which are very constructive in the prompt diagnosis of breast cancer. Over the past ten years, using machine learning techniques for medical diagnosis has gained popularity. This increased use of ML techniques can be partly attributed to the fact that it made better disease identification and symptom detection [6].
The current study is divided into the following sub-sections. The reviews of literature is given in Section 2. Moreover, Section 3 explains the experiment performed and the adopted algorithms to show the obtained results. Furthermore, these results are elaborated in Section 4. Additionally, Sections 5 of the study dicusses the study results and concludes the research.
Machine Learing (ML) can be used to submit fresh diagnostic hypotheses, helping to create a more customized therapeutic proposal. Several different MLAs, such as Decision Trees, Multilayer Perceptrons, K-Nearest Neighbors, and Support Vector Machines (SVM) have been used in this study. The CSV file of the breast mammograms was first taken and classification models that had been trained to achieve the aforementioned objective were then used. In contrast to benign tumors, which are non-cancerous andnon-lethal and are confined to the area where they originate whereas malignant cancer starts with abnormal cell growth and the abnormal behavior of messages between cells [7]. There is a vast body of literature on this subject, however,In the current study aims to deploy a computational method that would predict breast cancer with of accuracy.
On the Wisconsin datasets, practitioners analyzed the performance of four classifiers: Naive Bayes (NB), SVM, Decision Tree (DT), and K Nearest Neighbors (K-NN) [8]. SVM has been identified as the best amongst the others by achieving high accuracy percentage of 97.13% with the lowest error rate with respect to others' confusion matrices. It is important to consider this number because the conventional diagnostic methods have higher probability to occur errors, which would significantly impact the treatment strategies and staging of breast cancer. Currently, biopsy-proven breast malignancy is the most accurate method for diagnosing breast cancer, which also directly affects the medical professionals decisions .
;Haifeng developed a SVM-based ensembled model for the early prediction of cancer. The proposed ensembled model was made up of six different types of kernel functions and two different types of SVM structures, such as a-SVM and C-SVM [9]. In this study, two datasets from Wisconsin were used, namely WBC and WDBC, which were used to test the model (SEER). The intended model enhanced the diagnosis accuracy when compared to other researches using a single SVM. The major observed disadvantage of this strategy is that it requires a long training period and is computationally expensive. Resultantly, the validity became doubtful because patients possessing breast cancer were constantly at risk of the disease spreading.
Several deep learning and data mining techniques were examined for veneration cancer by several practitioners [10]. However, according to previous researches only a few papers used genetics, , which claimed that imaging was used in majority of the publications. A variety of algorithms, such as CNN and Nave Bayes, were used in imaging techniques. However, Machine Learning Techniques (MLT), Decision Trees, SVM, and Random Forests (RF) were quite famous.
Researchers validated and applied different neural networks (NNs) techniques , especially in early-stage cancer classification. They discovered that most NNs were capable of identifying cancerous cells and these cells are typically difficult to distinguish because they frequently resemble the Parr of healthy breast tissue. Furthermore, they illustrated that these cells must be observed for a specific amount of time by the experts to identify their distinctive characteristics, including their structure and growth rate, which can differ from normal breast cells. The imaging method, however, required a lot of processing power to preprocess the images [11].
Sudarshan Nayak in his study used 3D images to illustrate Machine Learning Algorithms (MLA) to categorize breast cancer. Before classifying an abnormal mass in the breast parenchyma, many factors were taken into consideration. Based on his overall results, it was concluded that SVM is the best model for this purpose [12].
Similarly, , Youness Khoudfi and Mohamed Bahaj in a comparison of machine learning algorithms found that SVM is the best classifier, with an accuracy of 97.9%, when compared to K-NN, RF, and NB, which are based on multilayer perception with 5 layers and 10 times cross-validation using MLP [13]. Moreover, Ahmed [14] prepared a method for estimating WBCD, which combined a clustering strategy with a potent probabilistic vector support machine, with a prediction rate of 99.10% made by the SVM technique.
A new approach was introduced by David A. [15], which employed linear discriminant analysis (LDA) to reduce the feature dimensionality and then deployed the new, reduced feature dataset with SVM. On the (BCWD) dataset, the practitioner applied five ML algorithms: (SVM), Logistic Regression (LR), Decision Tree (DT), Random Forest (RF), and KNN. A performance assessment and comparison of these various classifiers were done after getting the results. This study's main objective was to develop a confusion matrix to check the significance of precision and accuracy [16]. All other classifiers outperformed the support vector (SV) machines, which had the highest accuracy of 97.2%.
Utilizing the WEKA program from the Waikato Environment for Knowledge Analysis, Valentina Mikhailova compared the categorization algorithms. A number of 286 cases and 10 attributes made the dataset for this study. The J48, Nave Bayes, Random Forest (RF), MLP, K*, and SVM models were compared using various parameters. Metrics such as machine learning helped to assess the performance of the developed models [17]. The SVM algorithm and the J48 model both offered the highest levels of accuracy, at 75.5% and 79.6%, respectively.
To categorize a WBCD, the practitioner used naive Bayes, SVM, and Decision Trees (DT); support vector SVM, which produced the best results with an accuracy score of 96.99% [18]. Clinical information from medical intensive care units was used in this study. Machine learning techniques were used for the early detection of disease for the patients inside the hospital over the course of 24 hours. The KNN and logistic regression produced the highest accuracy ratings when applied to training data [19].
The biggest problem with breast cancer, according to Nithya et al. [20], is classifying breast tumours because of the structural distortion these tumours cause. It is crucial to determine the type of tumour when one is considering the the correct form of prognosis because it determines the impact of tumour on the breast tissue. Computer-aided diagnosis (CAD) was used to check the significance of breast cancer tumours in the patient. Their main goal was to use data mining technologies to improve breast cancer projection. The classification performance of many machine learning algorithms was enhanced using Bagging, Multiboot, Random Subspace, and Multilayer Perceptron.
The classification of different patient groups into high-risk and low-risk patients were examined by Kourou et al. using Artificial Neural Networks (ANN), Decision Trees (DT), and SVM to present a model for cancer risks [21].
A study has been conducted using mammogram diagnosis on biopsy of breast cancer [22]. The study used traditional classification techniques such as LR, LDA, QDA, FR, and SVM in their practical work. Md. Milon Islam contrasts supervised machine learning algorithms like SVM, ANNs, and LR [23]. The UCI machine learning database, a well-known machine learning resource, is where the WBC dataset was taken from. The performance of the study was evaluated using the confusion matrix and correlational factors. Additionally, different approaches' receiver operating characteristic curves and precision-recall area under curves were assessed. The findings indicated that SVM had the highest accuracy among all applied algorithms, while ANNs have the highest values of accuracy, precision, and F1-score.
Different versions of the DT algorithm for the diagnosis of cancer were employed using Mat lab, Python, and WEKA. The CART employed in Python gave 97.4% and 98.9% in terms of its accuracy and sensitivity, respectively, while in WEKA both DT algorithms achieved 95.3% and 95.3% accuracy, respectively [24] [25].
In the testing phase, NSVM, LPSVM, SSVM, and LPSVM all achieved the highest accuracy, sensitivity, and specificity, which were 96.5517%, 98.2456%, 96.5517%, and 97.1429%, respectively. Yue et al. provided thorough evaluations of different models by using the standard WBCD dataset and Decision Tree (DT) methods, which were used to predict breast cancer. According to the practitioners by collaborating with two deep learning models the highest accuracy rate can be achieved. This architecture had a classification accuracy of 99.68%, but when combined with the clustering algorithm, the SVM method had a classification accuracy of 99.10%. They also studied the ensemble method, which employed voting to create the J48, SVM, and Naive Bayes models. With the ensemble method, an accuracy of 97.13% was achieved, respectively [26]. Infrared imaging coupled with an agent previously administered to a patient can lead to a very accurate tumour detector, with a thermal sensitivity camera and model of the breast [27].In this research remote health care systems used technological paradigms and enablers to fulfill their needs of remote monitoring, remote aid, and research gaps, which were identified to stimulate the future research [28].
TABLE I
SUMMARY OF LITERATURE REVIEW
|
Reference |
Model |
Method |
|
[8] |
Support Vector Machine (SVM), Decision Tree (C4.5), Naive Bayes (NB), and k Nearest Neighbors (k-NN) |
SVM improves breast cancer diagnosis and treatment strategies. |
|
[9] |
Support vector machine ensemble Algorithm |
Haifeng's ensemble model demonstrated improved diagnosis accuracy, but its long training time and computational expense raise concerns. |
|
[10] |
Deep learning and machine learning algorithms |
Haifeng's ensemble model demonstrated improved diagnosis accuracy, but its long training time and computational expense raise concerns. |
|
[11] |
Artificial Neural Network (ANN) |
Neural networks can identify cancerous cells but require observation over time and significant processing power processing of image processing. |
|
[12] |
Support Vector Machine (SVM), Random Forest, Logistic Regression, Decision tree (C4.5), and K-Nearest Neighbours (KNN) |
SVM is the best-supervised machine learning algorithm for breast cancer classification. |
|
[13] |
Random Forest, Naïve Bayes, Support Vector Machines SVM, and K-Nearest Neighbors K-NN |
SVM is the best classifier with 97.9% accuracy. |
|
[14] |
Support Vector Machine (SVM) |
Clustering and SVM combined to predict WBCD with 99.10% accuracy. |
|
[15] |
Pulse-Coupled Neural Networks (PCNN) and Deep Convolutional Neural Networks (CNN) |
A new approach uses LDA to reduce feature dimensionality and applies five ML algorithms to the BCWD dataset. |
|
[16] |
Support Vector Machine (SVM), Random Forest, Logistic Regression, Decision tree (C4.5), and K-Nearest Neighbours (KNN) |
Support vector machines had the highest accuracy (97.2%). |
|
[17] |
Naïve Bayes, J48, K*, Random Forest, Multilayer Perceptron (MLP) and Support Vector Machine (SVM) |
SVM and J48 models offer accuracy at 75.5% and 79.6% respectively. |
|
[18] |
Naïve Bayes, Support vector machines, Radial basis neural networks, Decision trees J48, and simple CART |
SVM produced the best results with 96.99% accuracy. |
|
Randomized Controlled Trial (RCT) |
Used data mining technologies to improve breast cancer prediction, using bagging, multiboot, random subspace, and multilayer perceptron to improve the classification performance of machine learning algorithms. |
Mammography is a radiological method, which is used for screening breast cancer. Diagnostic mammography is a special kind of mammogram, which is used to detect abnormalities in females who have been diagnosed with having breast issues or cancer after the suggestion or advice of a medical professional. Women over the age of 45 are advised to undergo screening mammography to rule out any breast tumours or malignancies, but this diagnostic procedure in and of itself has risks related to radiation exposure for both young and malignant females. However, mammography only predicts 70% on a true positive scale many other unnecessary biopsies are performed to confirm the indication of this chronic disease.
Recently, several Computer-Aided Diagnostics (CAD) approaches have been put forth to lessen the number of unnecessary screening biopsies. These systems have helped clinicians to choose between performing a screening biopsy for a suspicious patient on the behalf of a mammogram and may perform a comprehensive follow-up instead. Due to some important limitations, a biopsy is not usually used to diagnose breast masses.
This data set can be used to classify benign or malignant based on BI-RADS (Breast Imaging-Reporting and Data System) features and the patient's age, which is considered a benchmark classification for the breast cancer diagnoses. This system depicts the correlation with the likelihood of malignant breast cancer. Sensitivity and associated specificities can be determined by assuming that all instances with BI-RADS ratings greater than or equal to a specific value (ranging from 1 to 5) are malignant and all other cases are benign. These can demonstrate a CAD system's performance in comparison to radiologists. It can be noticed from previous literature that different practitioners use different methods. whereas the machine learning method was employed in the current study to check the significance of the dataset, which fills the gap. Previously, these type of models have not been applied to check the accuracy of cancer genome by any of the researcher but in this paper novel model techniques have been used to aid the research in this field.
Data preprocessing is a tool that locates or eliminates outliers. Additionally, it eliminates self-contradiction. The dataset is usually reduced to just the sample code number. Its removal is justified by the fact that it does not affect illnesses. The dataset contains 16 missing values for traits. For this, the missing traits are replaced by the mean. A random selection process from the dataset has been employed to ensure that the data is distributed correctly. The dataset contains the following features such as id, diagnosis (M = malignant, B = benign), radius, texture, perimeter, area, smoothness, compactness, concavity, concave points, symmetry, and fractal dimension. Ten real-valued features are computed for each cell nucleus, namely mean, standard deviation for grey-scale values, and worst or largest of these features. The dataset can be understood by the description given in the Table II below.
TABLE II
DESCRIPTION OF DATASET
|
Feature |
Role |
|
Diagnosis |
the main feature of classification |
|
Radius |
mean of distances from the center |
|
Texture |
the standard deviation of gray-scale values |
|
Smoothness |
local variation in radius lengths |
|
Compactness |
perimeter^2 / area - 1.0 |
|
Concavity |
the severity of concave portions of the contour |
|
Concave points |
number of concave portions of the contour |
|
Fractal dimension |
"coastline approximation" - 1 |
|
Class distribution |
357 benign, 212 malignant |
The learning process in machine learning strategies can be divided into two main categories: supervised learning and unsupervised learning. The following Machine learning models were used in this study,
Support Vector Machine (SVM)
Multilayer Perceptron (MLP)
Decision Tree (DT)
Random Forest (RF)
K-Nearest Neighbor (KNN)
Logistic Regression (LR)
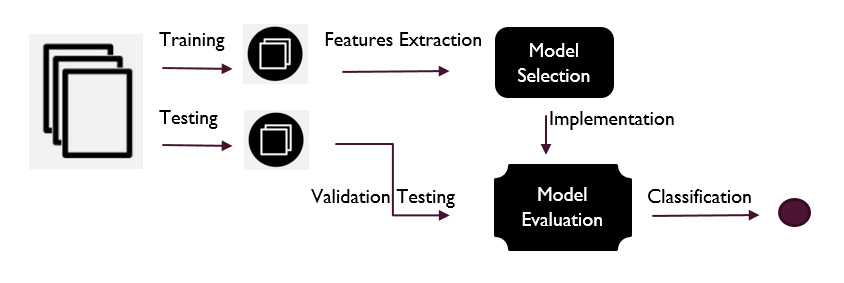
Different models were used to verify the best result for the dataset. The aforementioned methods were used in the research because they provided a better classification and interpretation. Moreover, a convolutional neural network in the future can be used to compare this work with a deep learning model. The methods, which were employed in this study are widely used in classification problems, which gave clear directions to conduct better analysis. Moreover, a generic flow diagram for better interpretation was used which is given below:
FIGURE 1. Proposed Framework
Primarily, the dataset was set into two chunks for training and testing. In the training phase, main features were extracted to classify the cancer type, whereas in the testing phase, the significance of the predicted case was checked in the confusion matrix. K fold cross-validation showed that one fold was used for testing, while k 1 folds were used repeatedly for training. Overfitting was prevented by using cross-validation. Data was partitioned in the study by using a ten-fold cross-validation technique. Each iteration used nine folds for training and the remaining one fold for testing.
Six machine learning approaches were utilizedin this study, which include SVM, KNN, DT, RFs, MLP, and LR. The predictions encompassed the benign or cancerous nature of cells. Intel(R) Core (TM) i3-1111G4 CPU @ 3.00GHz 2995Mhz with 8 GB RAM were installed and used in this study. An open-source written library that was written in Python, namely Scikit-learn was employed for the analysis. Reports, which contained narrated text, live code, equations, and graphics were created by using an open-source tool, Colab.
Many performance metrics were employed to measure the effectiveness of Machine Learning Algorithms (MLAs). In case of the evaluation of the concerned parameters, confusion matrices were used such as TP, TN, FN, and FP, which were used to predict data as well as the real data. For all the methods employed, the calculated confusion matrix is as follows:
TABLE III
SUPPORT VECTOR MACHINE (SVM) CONFUSION MATRIX
|
|
Negative |
Positive |
|
Negative |
TN=84 |
FP=33 |
|
Positive |
FN=13 |
TP=78 |
In the case of SVM, TN, FN, FP, and TP are 84, 13, 33, and 78, respectively, whereas for KNN these are 81,16, 24, and 87.
TABLE IV
K-NEAREST NEIGHBORS (KNN) CONFUSION MATRIX
|
Negative |
Positive |
|
|
Negative |
TN=81 |
FP=24 |
|
Positive |
FN=16 |
TP=87 |
For the Decision Tree (DT), TN, FN, FP, and TP are calculated as 72, 25, 34, and 77, respectively.
TABLE V
DECISION TREE (DT) CONFUSION MATRIX
|
|
Negative |
Positive |
|
Negative |
TN=72 |
FP=34 |
|
Positive |
FN=25 |
TP=77 |
For the Multilevel Perceptron, TN, FN, FP, and TP are calculated as 20, 09, 21, and 88, respectively.
Table VI
Multilevel Perceptron (MP) Confusion Matrix
|
|
Negative |
Positive |
|
Negative |
TN=20 |
FP=21 |
|
Positive |
FN=09 |
TP=88 |
For the Linear Regression, TN, FN, FP, and TP are calculated as 88, 11, 20, and 89, respectively.
TABLE VII
LINEAR REGRESSION (LR) CONFUSION MATRIX
|
|
Negative |
Positive |
|
Negative |
TN=88 |
FP=20 |
|
Positive |
FN=11 |
TP=89 |
For the Random Forest (RF), TN, FN, FP, and TP are calculated as 80, 19, 21, and 88. respectively.
TABLE VIII
RANDOM FOREST (RF) CONFUSION MATRIX
|
|
Negative |
Positive |
|
Negative |
TN=80 |
FP=21 |
|
Positive |
FN=19 |
TP=88 |
The study showed an accuracy of 86%, which was the highest accuracy achieved through MLP and the second highest accuracy achieved was 85.2%, which obtained through Logistics Regression. Additionally, the highest precision value (0) was achieved by MLP and Logistic Repression in which MLP achieved 81% of accuracy in case 1. The least value of precision was 75%, which was achieved by SVM for malignant or benign cases. LR provided the highest recall rate (0), whereas the lowermost values were obtained through the Decision Tree (DT) and SVM. MLP provided the highest recall rate (0) and the least value was given by the Decision Tree (DT) and SVM.
In terms of the F1 score rate, the highest value (0) was achieved by MLP,LR, and the Decision Tree (DT), whereasSVM provided the lowest value. The highest recall rate (1) was achieved through MLP, whereas SVM provided the lowest value.
TABLE IX
ACCURACY ATTAINED BY MODELS
|
Model |
Accuracy(%) |
|
SVM |
78 |
|
KNN |
81 |
|
DECISION TREE |
72 |
|
LR |
85 |
|
RANDOM FOREST |
81 |
|
MLP |
86 |
After the accuracy, it is significant to know the precision, recall, and F1 score to check the significance of the obtained results. Hence, these results are discussed in the discussion section for further interpretation.
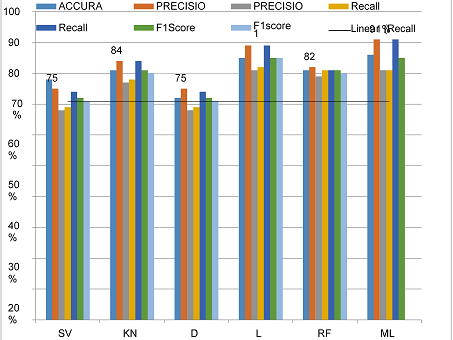
FIGURE 2. Comparison of models
The MLP model provided the highest accuracy percentage when compared toall other techniques in association with the accuracy in Figure 1. We are going to discuss other things in the discussion section below.
To evaluate the specific terms by their equivalent formula in the investigation, following factors have been abundantly used. There are several characteristics, which are comparable to those that tend to describe the associations as substantial to amply measure a system's performance. The experimental results are given in Table VII.
TABLE X
MACHINE LEARNING AND DEEP LEARNING MODELS RESULTS
|
|
Accuracy |
Precision(0) |
Precision(1) |
Recall(0) |
Recall(1) |
F1score(0) |
F1score(1) |
|
SVM |
78% |
75% |
68% |
69% |
74% |
72% |
71% |
|
KNN |
81% |
84% |
77% |
78% |
84% |
81% |
80% |
|
DT |
73% |
75% |
68% |
69% |
74% |
72% |
71% |
|
LR |
85% |
89% |
81% |
82% |
89% |
85% |
85% |
|
RFT |
81% |
82% |
79% |
81% |
81% |
81% |
80% |
|
MLP |
86% |
91% |
81% |
81% |
91% |
85% |
86% |
For technique, the confusion matrix was calculated. For the dataset with 831 instances, 75% of the data instances were employed for training models and for testing, whereas 25% of the data was used. The confusion matrix of these machine learning algorithms was shown, which provided the results for SVM, DT RF, K-NN, MLP, and LR, respectively. The confusion matrix was seen in its combination in the table above.
However, It can forecast the greatest number of positives when any of the six strategies is noticed to be true. Logistics Regression Models (LRM) may forecast the least amount of positives when they are false positives in addition to predicting the greatest number of true positives. Logistic Regression (LR) predicted the lowest false-positive rate, whereas the false-positives highest value was achieved by LR and MLP.
The decision Tree (DT) provided the highest rate where false negatives were concerned, with the lowest rate being achieved by MLP. The F1 score for all the techniques is almost 97%, which was significantly better. LR predicted the highest value of True-Negative, whereas MLP provided the lowest value.
[1] D. Lazaro-Pacheco, A. M. Shaaban, S. Rehman, and I. Rehman, “Raman spectroscopy of breast cancer,” Appl. Spectrosc. Rev., vol. 55, no. 6, pp. 439–475, 2020, doi: https://doi.org/10.1080/05704928.2019.1601105
[2] M. Arnold et al., “Current and future burden of breast cancer: Global statistics for 2020 and 2040,” The Breast, vol. 66, pp. 15–23, 2022, doi: https://doi.org/10.1016/j.breast.2022.08.010
[3] F. Gorunescu, “Fighting breast cancer with the aid of artificial intelligence: A big challenge,” J. Cancer Clin. Res., vol. 3, no. 1, Art. no. 1069.
[4] N. A. Mashudi, S. A. Rossli, N. Ahmad, and N. M. Noor, “Comparison on some machine learning techniques in breast cancer classification,” in 2020 IEEE-EMBS Conference on Biomedical Engineering and Sciences (IECBES), IEEE, 2021, pp. 499–504, doi: https://doi.org/10.1109/IECBES48179.2021.9398837
[5] S. Saeed, N. Z. Jhanjhi, M. Naqvi, M. Humyun, M. Ahmad, and L. Gaur, “Optimized breast cancer premature detection method with computational segmentation: A systematic review mapping,” Approaches Appl. Deep Learn. Virtual Med. Care, pp. 24–51, 2022, doi: https://doi.org/10.4018/978-1-7998-8929-8.ch002
[6] W. Yue, Z. Wang, H. Chen, A. Payne, and X. Liu, “Machine learning with applications in breast cancer diagnosis and prognosis,” Designs, vol. 2, no. 2, Art. no. 13, May 2018, doi: https://doi.org/10.3390/designs2020013
[7] L. Galluzzi et al., “Autophagy in malignant transformation and cancer progression,” EMBO J., vol. 34, no. 7, pp. 856–880, 2015, doi: https://doi.org/10.15252/embj.201490784
[8] H. Asri, H. Mousannif, H. Al Moatassime, and T. Noel, “Using machine learning algorithms for breast cancer risk prediction and diagnosis,” Procedia Comput. Sci., vol. 83, pp. 1064–1069, 2016, doi: https://doi.org/10.1016/j.procs.2016.04.224
[9] H. Wang, B. Zheng, S. W. Yoon, and H. S. Ko, “A support vector machine-based ensemble algorithm for breast cancer diagnosis,” Eur. J. Oper. Res., vol. 267, no. 2, pp. 687–699, 2018, doi: https://doi.org/10.1016/j.ejor.2017.12.001
[10] N. Fatima, L. Liu, S. Hong, and H. Ahmed, “Prediction of breast cancer, comparative review of machine learning techniques, and their analysis,” IEEE Access, vol. 8, pp. 150360–150376, 2020, doi: https://doi.org/10.1109/ACCESS.2020.3016715
[11] M. Mahmood, B. Al-Khateeb, and W. M. Alwash, “A review on neural networks approach on classifying cancers,” IAES Int. J. Artif. Intell., vol. 9, no. 2, p. 317, 2020, doi: https://doi.org/1010.11591/ijai.v9.i2.pp317-326
[12] B. M. Gayathri and C. P. Sumathi, “Comparative study of relevance vector machine with various machine learning techniques used for detecting breast cancer,” in 2016 IEEE Int. Conf. Comput. Intell. Comput. Res., IEEE, 2016, pp. 1–5, doi: https://doi.org/10.1109/ICCIC.2016.7919576
[13] Y. Khourdifi and M. Bahaj, “Applying best machine learning algorithms for breast cancer prediction and classification,” in 2018 Int. conf. Elec. Cont. Optim. Comput. Sci., IEEE, 2018, pp. 1–5, doi: https://doi.org/10.1109/ICECOCS.2018.8610632
[14] A. H. Osman, “An enhanced breast cancer diagnosis scheme based on two-step-SVM technique,” Int. J. Adv. Comput. Sci. Appl., vol. 8, no. 4, 2017, doi: https://doi.org/10.14569/IJACSA.2017.080423
[15] D. A. Omondiagbe, S. Veeramani, and A. S. Sidhu, “Machine learning classification techniques for breast cancer diagnosis,” in IOP Conf. Series: Mat. Sci. Eng., 2019, Art. no. 12033, doi: https://doi.org/10.1088/1757-899X/495/1/012033
[16] M. A. Naji, S. El Filali, K. Aarika, E. L. H. Benlahmar, R. A. Abdelouhahid, and O. Debauche, “Machine learning algorithms for breast cancer prediction and diagnosis,” Procedia Comput. Sci., vol. 191, pp. 487–492, 2021, doi: https://doi.org/10.1016/j.procs.2021.07.062
[17] V. Mikhailova and G. Anbarjafari, “Comparative analysis of classification algorithms on the breast cancer recurrence using machine learning,” Med. Biol. Eng. Comput., vol. 60, no. 9, pp. 2589–2600, July 2022, doi: https://doi.org/10.1007/s11517-022-02623-y
[18] S. Aruna, S. P. Rajagopalan, and L. V Nandakishore, “Knowledge based analysis of various statistical tools in detecting breast cancer,” Comput. Sci. Inf. Technol., vol. 2, no. 2011, pp. 37–45, 2011, doi: https://doi.org/10.5121/csit.2011.1205
[19] J. L. Bernal, S. Cummins, and A. Gasparrini, “Interrupted time series regression for the evaluation of public health interventions: a tutorial,” Int. J. Epidemiol., vol. 46, no. 1, pp. 348–355, Feb. 2017, doi: https://doi.org/10.1093/ije/dyw098
[20] R. Nithya and B. Santhi, “Classification of normal and abnormal patterns in digital mammograms for diagnosis of breast cancer,” Int. J. Comput. Appl., vol. 28, no. 6, pp. 21–25, Aug. 2011.
[21] K. Kourou, T. P. Exarchos, K. P. Exarchos, M. V Karamouzis, and D. I. Fotiadis, “Machine learning applications in cancer prognosis and prediction,” Comput. Struct. Biotechnol. J., vol. 13, pp. 8–17, 2015, doi: https://doi.org/10.1016/j.csbj.2014.11.005
[22] D. Oyewola, D. Hakimi, K. Adeboye, and M. D. Shehu, “Using five machine learning for breast cancer biopsy predictions based on mammographic diagnosis,” Int. J. Eng. Technol. IJET, vol. 2, no. 4, pp. 142–145, 2016, doi: https://doi.org/10.19072/ijet.280563
[23] M. K. Hasan, M. M. Islam, and M. M. A. Hashem, “Mathematical model development to detect breast cancer using multigene genetic programming,” in 2016 5th Int. Conf. Info. Elect. Vision, IEEE, 2016, pp. 574–579, doi: https://doi.org/10.1109/ICIEV.2016.7760068
[24] E. Venkatesan and T. Velmurugan, “Performance analysis of decision tree algorithms for breast cancer classification,” Indian J. Sci. Technol., vol. 8, no. 29, pp. 1–8, Nov. 2015, doi: https://doi.org/10.17485/ijst/2015/v8i1/84646
[25] T. S. Rana, H. M. Usman, and S. Naseer, “Static handwritten signature verification using convolution neural network,” in 2019 Int. Conf. Inn. Comput., IEEE, 2019, pp. 1–6, doi: https://doi.org/10.1109/ICIC48496.2019.8966696
[26] T. S. Rana and A. Ashraf, “Bladder and kidney cancer genome classification using neural network,” VFAST Transac. Software Eng., vol. 9, no. 2, June 2021.
[27] D. Lazaro-Pacheco, A. M. Shaaban, S. Rehman, and I. Rehman, “Raman spectroscopy of breast cancer,” Appl. Spectrosc. Rev., vol. 55, no. 6, pp. 439–475, 2020, doi: https://doi.org/10.1080/05704928.2019.1601105
[28] E. U. Khadim, S. A. Shah and R. A. Wagan, "Evaluation of Activation Functions in CNN Model for Detection of Malaria Parasite using Blood Smear Images,"2021 International Conference on Innovative Computing (ICIC), Lahore, Pakistan, 2021, pp. 1-6, doi: https://doi.org/10.1109/ICIC53490.2021.9693056
[29] I. Ahmad et al., "Emerging Technologies for Next Generation Remote Health Care and Assisted Living," in IEEE Access, vol. 10, pp. 56094-56132, 2022, doi:https://doi.org/10.1109/ACCESS.2022.3177278