Mubasher H. Malik1*, and Hamid Ghous2
1* Department of Computer Science, Institute of Southern Punjab Multan, Pakistan
2 Australian Scientific & Engineering Solutions, Sydney, New South Wales, Australia
*Corresponding Author: [email protected]
ABSTRACT Social media has attained popularity during the last few decades due to the rapid growth of online businesses and social interaction. People can interact with one another and communicate their sentiments by expressing their ideas and points of view on social media. Businesses involved in manufacturing, sales, and marketing increasingly focus on social media to get feedback on their goods and services from people worldwide. Businesses must process and analyze this feedback in the form of sentiments to gain business insights. Every day, millions of Urdu and Roman Urdu sentences are posted on social media platforms.The critical loss of this massive amount of data results from ignoring the thoughts and opinions in language with limited resources, such as Urdu and Roman Urdu in the favor of resource-rich languages, such as English. The current study focused on sentiment analysis of Roman Urdu text. Bag of Words (BoW) and Term Frequency-Inverse Document Frequency (TF-IDF) word embedding techniques were deployed to conduct the current study. Support Vector Machine (SVM), Linear Support Vector Machine (LSVC), Logistic Regression (LR), and Random Forest (RF) classifiers were deployed. The experiments showed that SVM showed 94.74%, while RF showed 93.13% accuracy using BoW word embedding technique.
INDEX TERMS feature engineering, opinion mining, Roman Urdu, sentiment classification, supervised learning, unsupervised learning
Social media networks have become massive data sources in the modern era. This data reveals people's emotions and sentiments pertaining to a specific topic or trend that piques society's interests. Resultantly, many businesses and organizations are taking interest to gain knowledge about data collected from social medianetworks [1], [2]. One of the key challenges in the current era is to develop a system that can effectively extract and determine sentiments from massive amounts of social media data. Currently, Artificial Intelligence (AI) techniques, such as Machine Learning (ML), Data Mining (DM), and Deep Learning (DL) are the most effective strategies [3]. ML is pervasive in our daily lives and is applied in many fields including speech recognition, image classification, data sciences, natural language processing, and many others [4].
Sentiment Analysis (SA) is a subset of ML that can analyze social media sentiments. SA is a type of data intelligence that can effectively identify the sentiments and emotions behind a text [5]. The popularity of sentiment analysis is not new. Numerous institutions have evaluated conventional data sources to gain deeper insights into user sentiment [6]. Cost reduction is another factor that determines the significance of sentiment analysis in the current era. This is because traditional methods and instruments require significant investments from organizations if they want to gather the opinions of their customers or a particular group of people. On the other hand, since the information is already available on social networks, current techniques enable the creation of methods at a low cost [7], [8].
Urdu is the official language of Pakistan and is spoken in several Indian states and union territories [9]. The practice of writing Urdu and Hindi languages by using English alphabets is commonly known as Roman Urdu and Romanaagari, respectively [10]. On social media platforms, majority of the population in Pakistan, India, and other South Asian nations prefer to use either Romanaagari or Roman Urdu script for communication [11], [12], [13]. Nearly 1.99 billion people live in this densely populated region and many are interested in interacting on social media to buy, sell, and share information globally [14]. Hindi and Urdu are spoken by more than 588 million people worldwide, more than English [15]. It is the most effective strategy for expressing experiences, emotions, and feelings on social media in native language.
However, Roman Urdu has received very little attention in researches as compared to other languages, such as English. This is because resource limitations lack linguistic resources and morphological problems. Although, these languages are widely used, the difficulty of Roman Urdu sentiment analysis has not yet been fully explored. Therefore, sentiment analysis in Roman Urdu is the main focus of the current study.
The current study is divided into five sections. The literature review is discussed in section 2. Section 3 describes the proposed methodology. Section 4 comprises conclusion and future directions are discussed in section 5.
Sentiment analysis has previously used a variety of ML and DL models. This section provides an overview of various researchers' contributions to sentiment analysis. Literature showed that researchers adopted Roman Urdu and Urdu language texts. ML classifiers were also deployed, such as NB, RF, DT, and SVM to produce sentiments.
In 2021, a model was proposed to identify hate speech and its content. Experiments were conducted by using a publicly available dataset of 43,871 English-language tweets. These tweets were classified into positive, negative, and neural sentiments using the Moneky Learn ML library. The findings revealed that 89% of tweets were negative, 7% positive, and 4% were neutral [16]. In 2021, a sentiment analysis model was proposed. The Twitter dataset was taken for experiments on COVID-19 sentiments. Recurrent Neural Network (RNN) was deployed to classify the tweets. The proposed model classified tweets into weakly positive, weakly negative, strongly positive, and strongly negative sentiments. RNN, with Textblob, produced promising results [17].
In 2020, a sentiment analysis model was proposed for Roman Urdu Text. Twitter dataset of 3241 tweets was taken for experiments. Word2Vec, Glove, and FastText word embedding techniques were used for feature extraction. ML classifiers were deployed, such as Naïve Bayes (NB), SVM, and LR along with hybrid approaches. The ML classifiers produced 84% accuracy as compared to hybrid methods [18]. In 2020, a sentiment analysis model was proposed to detect extremism from multilingual texts. A multilingual dataset of twenty thousand sentences from Urdu, Roman Urdu, and English was used to detect moderate, low, high, and neural extreme sentiments. LSVC and NB algorithms were deployed for classification. LSVC produced 82% accuracy [19]. In 2020, a Roman Urdu sentiment analysis model was proposed. The developed dataset contained offensive statements that were used for sentiment analysis for the first time. Character-level tri-gram and n-gram model were deployed for feature engineering. NB, KNN, DT, SVM, LR, and RF classifiers were deployed. LR produced 95.8% accuracy [20].
In 2020, a sentiment analysis model was deployed using Roman Urdu and English language. The data was collected in the form of comments from YouTube. TF-IDF, Count Vectorizer, and Word2Vec word embedding techniques used vectors. An LR classifier was deployed which produced 87% accuracy by using Count Vectorizer [21]. In 2020, Markov Chains-based sentiment analysis model was proposed by using Urdu tweets. TF-IDF word embedding technique was used. NB classifier produced promising results [22]. In 2020, an aspect-based sentiment analysis model was proposed. Ten thousand Urdu tweets were taken from Twitter. TF-IDF and N-gram were sued for feature extraction. The proposed model produced promising results using ML classifiers [23].
In 2019, a sentiment analysis model was deployed by using Roman Urdu social media comments. Uni-gram, bi-gram, tri-gram, and TF-IDF were used for feature extraction. For classification, NB, LR, and SVM were deployed. SVM, by using Uni-gram, bi-gram, and TF-IDF, produced the highest accuracy of 87.22% [24]. In 2019, a sentiment classification model was proposed to classify Urdu news tweets. About six hundred Urdu tweets were taken from Twitter. Vectors were created using the word count technique. The Decision-tree (DT) classifier produced 90% accuracy [25]. In 2019, an aspect-based sentiment analysis model was proposed to classify Urdu political tweets. Approximately, eight thousand seven hundred and sixty tweets were collected. The N-gram feature model was used. SVM classifier produced 75% accuracy [26]. In 2018, a sentiment analysis model was proposed. A Roman Urdu dataset consisting of 779 Roman Urdu reviews was taken. The N-Gram model was deployed for feature extraction. ML classifiers, such as NB, LR, SVM, KNN, and DT were deployed. The model produced promising results using these ML classifiers [27].
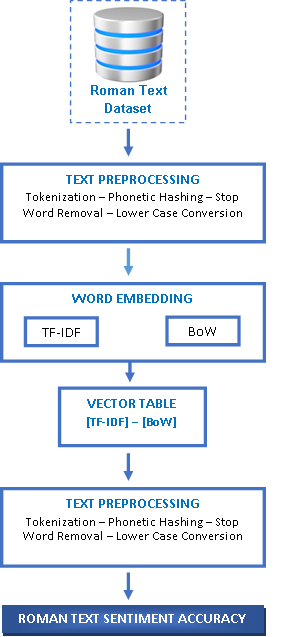
In this section, the proposed method of ML-based sentiment analysis has been implemented by using Roman text as shown in Figure 1. Firstly, a publicly available dataset of Roman text was taken. Secondly, preprocessing techniques, such as tokenization, phonetic hashing, stop word removal, and lowercase conversion were deployed on the dataset. Thirdly, word embedding techniques, that is, TF-IDF and BoW were used for feature extraction. Finally, ML classifiers, SVM, LSVC, RF, and LR were deployed. The experiments showed the comparison of both word embedding techniques using ML classifiers. An ML-based sentiment analysis of Roman text (MLSART) algorithm was successfully employed, as presented in Table 1.
TABLE I
ML-BASED SENTIMENT ANALYSIS OF ROMAN TEXT (MLSART) ALGORITHM
|
Algorithm |
ML-based Sentiment Analysis of Roman Text (MLSART) Algorithm |
|
|
Input |
Roman Text Dataset |
|
|
Parameters |
RTDataset (Roman Text) |
|
|
Output |
Sentiment Accuracy |
|
|
1 |
function MLSART(RTDataset) |
|
|
2 |
Begin |
|
|
3 |
for each sentence in RTDataset do |
|
|
4 |
PT ßpreprocess text(sentence) |
|
|
5 |
(BF, TF)ßwordembedding(PT) |
|
|
6 |
end for |
|
|
7 |
(BAC, TAC) ß MLclassify(BF,TF) |
|
|
8 |
End |
|
|
9 |
return {BAC, TAC) |
|
|
10 |
end function |
|
|
11 |
function preprocess text(sentence) |
|
|
12 |
return (tokens) |
|
|
13 |
end function |
|
|
14 |
function wordembedding(tokens) |
|
|
15 |
return(bow features,tfidffeatures) |
|
|
16 |
end function |
|
|
17 |
function MLclassification(bow features,tfidffeatures) |
|
|
18 |
return(bow accuracy,tfidfaccuracy) |
|
|
19 |
end function |
|
A. DATA ACQUISITION
Firstly, the MLSART model initiated from the data acquisition stage. A publically available Roman text dataset was taken for experiments. Sentences from a variety of sources, such as reviews on e-commerce websites, comments left on open Facebook pages, and tweets from various Twitter accounts were included in the dataset. A single sentence should ideally make up each row along with a sentiment that can be positive, negative, or neutral. There were over 20,000 sentences that were manually tagged. This dataset of Roman text was previously used for research [28], [29]. Table 2 shows the sample of Roman text dataset.
TABLE II
ROMAN TEXT DATASET SAMPLE
|
Text |
Sentiment |
|
Food ki quality bohat zabardast ha ...bohat zabardast shan team |
pos |
|
Wo bohat mazaydar ha |
pos |
|
foodia bohat achi company hain, mujay in k masaly bohat pasand hain |
pos |
|
Bohat acha brand ha..zabardast quality wala |
pos |
|
Hamare ghar me yehi msale use hote hain meri ami ki or hum sb ki pasand shan |
pos |
|
bht km melta hai markt me eb q |
neu |
|
masale ke kya bat he khas tour per is ka namak who bhe hamalya namak |
pos |
|
har product ki qeema likhi honi chahiye |
neu |
|
Behtareen product meray bachpan se.. |
pos |
|
masalay zaiqay me bohat achay hain, me apne har khane me masala use karti hoon |
pos |
|
is me bohat ziada acid or artificial color ha jo k cancer ki waja banta ha..or is k packet k andar insects bhi hotay hain |
neg |
B. PREPROCESSING
In sentiment analysis, ‘text preprocessing’ refers to the process of getting input data ready for subsequent stages of evaluation and verification. Text preprocessing is a tough undertaking for languages other than English, since each language has its own word segmentations, speech tags, and grammatical obstacles. The dataset goes through certain preprocessing procedures [13]. Secondly, the Roman text dataset is preprocessed for tokenization, phonetic hashing, stop word removal, and lowercase conversion.
C. TOKENIZATION
Tokenization refers to the procedure of splitting a sentence into its constituent words or tokens [30]. For instance, consider the sentence "Wo bohat mazaydar ha." During the tokenization process, this sentence is segmented into four tokens, as illustrated in Figure 2.
FIGURE 1. ML-based Sentiment Analysis of Roman Text (MLSART) model
D. PHONETIC HASHING
The phonetic hash of a word is based on its pronunciation, not its spelling [31]. This module uses a phonetic encoding algorithm that converts small blocks of text (for instance, names) into a spell-independent hash, consisting of a combination of twelve consonant sounds [32]. Therefore, similar-sounding words tend to have the same hash.
The Soundex algorithm is employed to generate a phonetic hash and it is language-agnostic. If two words sound alike, they would produce the same hash code, regardless of their language of origin [33].
E. CONVERSION INTO LOWER CASE
The data in the corpus is then transformed to lowercase as part of the Natural Language Preprocessing (NLP). This can be achieved with the help of a built-in Python function lower, which converts any string to a lowercase text [34]. For instance,
Sentence: Hamare ghar me yehi msale use hote hain meri ami ki or hum sb ki pasand shan
Conversion: hamare ghar me yehi msale use hote hain meri ami ki or hum sb ki pasand shan
F. FEATURE EXTRACTION
For feature extraction, BoW and TF-IDF techniques were employed.
G. TERM FREQUENCY – INVERSE DOCUMENT FREQUENCY (TF-IDF)
TFIDF is a method used to determine the importance of a word inside a document or corpus of text. Essentially, it gauges how important a word is by considering how often it appears in the text, while also accounting for its prevalence in the overall corpus [35].
As depicted in Equation 1, within document D, the term frequency (denoted as T) simply counts how many times a specific term appears within the document. It is intuitive that a term becomes more important as it occurs more frequently in the text. Since the order of terms is irrelevant, the text can be represented by using a bag-of-terms model in the form of a vector. Each element in this vector corresponds to a term in the document and its value is determined by the term's frequency. Consequently, the more often a term appears in a document, the higher its associated weight would be [36].
TF(T,D)=(Countof Text T in Document D)/(Number of Words in Document D) (1)
H. DOCUMENT FREQUENCY
Document frequency illustrates that the relevance of the text, which resembles TF (Term Frequency), remains consistent across the entire corpus collection. The key differentiation is that in document D, TF represents the frequency count of a term T, while DF indicates how often the term T appears in the entire set of documents, denoted as N. Essentially, DF signifies the number of documents containing the word, as indicated in Equation 2,
DF (T)=Occuranceof T in Documents (2)
I. INVERSE DOCUMENT FREQUENCY
Inverse document frequency evaluates the significance of a word. In the context of search, the primary purpose is to locate the relevant records that align with the query. Since TF treats all terms with equal importance, it doesn't provide an adequate measure of a term's importance within a document. To address this limitation, start by calculating the document frequency of a term, denoted as "T," by counting how many documents contain that term:
DF (T)=N (T) (3)
where,
DF(T) represents the document frequency of a term T, while N(T) denotes the count of documents that contain the term T as indicated in Equation 3.TF is the number of times a term appears in a single document, whereas DF is the number of distinct documents in the total corpus where the term appears. The inverse relationship is now commonly found where IDF is the number of documents in the corpus divided by the frequency of term in the text, as shown in Equation 4.
IDF (T)=N/(DF(T))=N/(N(T)) (4)
While, the most common word is typically regarded as less significant which describes this effect as "too harsh" and involves making it more nuanced. To achieve this, a logarithmic transformation was introduced by using base 2 on the inverse frequency of the term. This results in a refined representation of the significance of term T as described in Equation 5.
IDF (T)=log(N/DF(T)) (5)
J. BAG OF WORDS (BOW)
The BoW model is a method which is used to obtain text features in ML. It is known for its simplicity and versatility, making it suitable for various document feature extraction methods [37]. According to Zhang in 2010 [38], the BoW model relies on a vocabulary which includes recognized words and a way to measure their presence in the text. This vocabulary is a crucial component of the BoW model.
The term "bag" of words (BoW) is used because this model disregards any information pertaining to the sequence or arrangement of words within a document. Instead, it solely focuses to determine whether recognized words are present in the document without concerning itself with their specific location. This method of feature extraction can be as basic or intricate as desired. Complexity emerges when determining how to construct the vocabulary of recognized words (or tokens) and when assessing the presence of these known words in the document [39], [40].
K. CLASSIFICATION
Different ML classifiers are applied and their results are compared.
L. SUPPORT VECTOR MACHINE (SVM) CLASSIFIER
The SVM is a linear model renowned for its ability to tackle both classification and regression tasks. It is proficient in addressing both linear and nonlinear problems. Moreover, it also finds utility across a broad spectrum of real-world applications. Numerous instances of successful SVM applications can be found in diverse knowledge domains including digital image analysis, text categorization, character recognition, and bioinformatics [41].
In the SVM algorithm, a kernel is employed to transform the input data space into the desired format. SVM utilizes a method known as the "kernel trick". In this method, the kernel transforms a lower-dimensional input space into a higher-dimensional one. In simpler terms, the kernel enhances SVM's capability by converting initially inseparable problems into separable ones through the addition of extra dimensions. This process renders SVM more potent, adaptable, and precise [42]. Various types of kernels are available for SVM and the following are some examples.
M. LINEAR KERNEL
As stated by Patle in 2013 [43], it can be utilized as the point product between any two observations. The formula for linear kernel is outlined in Equation 6 as follows.
K(a,b)=Sum(a*b) (6)
In this context, the product of two vectors, denoted as "a" and "b," is calculated as the summation of the multiplication of corresponding pairs of input values.
N. POLYNOMIAL KERNEL
The polynomial kernel represents a broader version of linear kernel and is designed to handle nonlinear input spaces, as highlighted by Zhou in 2006 [44]. Equation 7 describes the formula for polynomial kernel as follows.
K(a,b)=1+ Sum(a*b)^ d (7)
In this context, "d" refers to the polynomial's degree and it is a parameter that must be manually specified within the learning algorithm.
O. RADIAL BASIS FUNCTION (RBF) KERNEL
The RBF kernel is widely favored in SVM classification, as emphasized by Cho in 2008 [45]. The mathematical formula in Equation 8 provides a description of how it works.
K(a,b)=exp(-gamma(sum(a-b^d) (8)
Here, the gamma ranges from 0 to 1. A good default value of gamma is 0.1.
Given that, SVM is suitable for linearly separable data. It can be implemented using the linear kernel in Python.
P. LINEAR SVC CLASSIFIER
The LSVC) technique employs a linear kernel function for classification tasks and is efficient while dealing with a substantial volume of samples. In contrast with the SVC model, LSVC introduces additional parameters including penalty normalization (either "L1" or "L2") and a loss function. It is worth noting that the kernel method is not modifiable in LSVC, since it relies exclusively on linear kernel approach, as pointed out by Ladicky in 2011 [46], [47].
The text has been coded as a BoW and TF-IDF and LSVC model has been applied. The TF part of algorithms ensures that the vectors contain the words that appear frequently in the text. Whereas, the IDF ensures that words that appear frequently in all the textual data are removed. In short, TFIDF discovers the words that are related with the context of the text. Whereas, BoW (Bow) only works to assign a unique number to each word to determine the frequency of occurrence of words in the text and convert the text into a vector format with a fixed length.
Q. RANDOM FOREST (RF) CLASSIFIER
RF is a popular ML algorithm developed by Leo Breiman and Adele Cutler [48]. It aggregates the outcomes of numerous DTs to generate a unified result. Its widespread adoption is attributed to its user-friendly nature and adaptability, making it suitable for both classification and regression tasks.
The RF algorithm necessitates the initial setup of three crucial hyper-parameters, that is, node size, the quantity of trees, and the selection of features. After these parameters are defined, the RF classifier can be employed to solve either regression or classification problems. This adaptable algorithm has been deployed in various sectors, encompassing healthcare, finance, e-commerce, and numerous others, contributing to more informed and enhanced decision-making processes, as highlighted by Parmar in 2019 [49].
The RF classifier is employed along with BoW and TF-IDF, and subsequently, its effectiveness is evaluated by comparing it to alternative classification algorithms [50].
R. LOGISTIC REGRESSION (LR) CLASSIFIER
LR is a supervised ML method primarily employed for classification tasks. It is particularly useful when it comes to deal with categorical target variables. While working with data having binary outcomes, belonging to one orf two classes, typically represented as 0 or 1, logistic regression is a suitable choice. The name "logistic regression" has been derived from the central function used in this method, known as the logistic function, as explained by Liao in 2005 [51], [52].
Statisticians devised the logistic function, often referred to as the sigmoid function, to model phenomena in ecology, related to population growth. This function is represented by an S-shaped curve capable of mapping a wide range of real values to a value between 0 and 1, though it never precisely reaches these boundary values.
1/((1+e*-value)) (9)
In this context, "e" represents the base of natural logarithms and "value" denotes the specific numerical input to be transformed as depicted in Equation 9. The approach used in the current study involved the application of LR in text classification, using both TF-IDF vectorization and BoW technique. Afterwards, the performance of this classifier was evaluated by comparing it with other classification methods.
To implement all the classifiers and conduct the associated experiments, Python 3.9.6 was employed for text processing. Additionally, the NLTK ML libraries were utilized for this purpose.
This section provides a concise overview of the performance evaluation of both proposed and adapted methodologies. The Roman text dataset serves as the input data for the model. Following data preprocessing, feature extraction techniques were implemented alongside various ML classifiers. Specifically, SVM, LSVC, RF, and LR algorithms were employed. These algorithms were applied and subsequent comparisons were made to assess their performance. Accuracy metrics were computed for the aforementioned algorithms, with 80% of the data allocated for training and remaining 20% for testing purposes.
Altogether, preprocessing and tokenization were conducted on a dataset comprising 21,941 sentences. The outcomes of each ML algorithm are presented below.
A. TF-IDF
For feature extraction, TF-IDF was used with different classifiers. After data insertion, different preprocessing techniques were applied to clean the data before classification. Afterwards, the data was tokenized. All the data was converted into lowercase. Afterwards, TF-IDF feature extraction was applied with different classifies for text classification. Table 3 shows the accuracy detail of different classifiers with TF-IDF.
TABLE III
RESULTS OF DIFFERENT CLASSIFIERS USING TF-IDF
|
Classifier |
Accuracy |
Precision |
Recall |
F1-Score |
|
SVM |
39.00 |
28.00 |
26.00 |
21.00 |
|
Linear SVC |
40.00 |
56.00 |
49..00 |
49.00 |
|
RF |
40.00 |
55.00 |
49..00 |
49.00 |
|
Logistic Regression |
40.00 |
43.00 |
37.00 |
37.00 |
Here is the performance detail of SVM classifier with the TF-IDF feature extractor. The average accuracy score =0.39, precision= 0.28, recall= 0.26, and F1=0.22.
LSVC classifier with TF-IDF provided 0.40 accuracy. Other performance measures include precision= 0.56, recall= 0.49, and f1=0.49.
RF classifier performs slightly better than another classifier in terms of accuracy. Accuracy score= 40, precision= 0.55, recall= 0.49, and f1=0.49.
By applying LR along TF-IDF, the accuracy of the model is 0.40. The score of other performance measures is precision= 0.43, recall= 0.37, and f1=0.37.
The graph for all the above performance measures is given below for a better understanding of the model.
As TF-IDF feature extraction is applied, the performance of SVM is lower than other classifiers. The other classifiers also not gave a remarkable accuracy score. Therefore, BoW feature extraction was applied further.
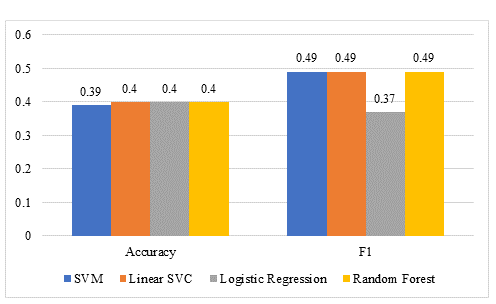
FIGURE 2. Graphical representation of classifiers using TF-IDF
B. BAG OF WORDS (BOW)
After TF-IDF, BoW technique was applied for feature extraction to get better results. After data insertion, different preprocessing techniques were applied to clean the data before classification. Data was tokenized. All the data was converted into lowercase. Afterwards, BoW feature extraction was applied for text classification. Table iv shows the accuracy detail of different classifiers with a BoW.
TABLE IV
RESULTS OF DIFFERENT CLASSIFIERS USING BOW
|
Classifier |
Accuracy |
Precision |
Recall |
F1-Score |
|
SVM |
94.74 |
93.15 |
92.10 |
91.78 |
|
Linear SVC |
89.28 |
90.10 |
91.50 |
90.50 |
|
RF |
93.13 |
92.75 |
91.80 |
91.70 |
|
Logistic Regression |
90.30 |
90.85 |
91.20 |
90.50 |
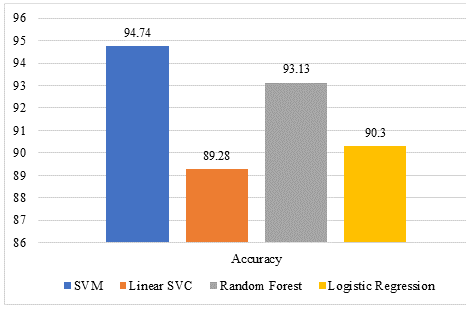
FIGURE 3. Graphical representation of classifiers using BoW
The results of all classifiers showed that SVM performed better with the BoW feature extraction technique. LSVC accuracy score was less than other classifiers with a BoW. The results showed that the performance of all classifiers was much better with BoW than with TF-IDF.
C. COMPARISON OF TF-IDF AND BOW
The comparison graph of TF-IDF and BoW is given below:
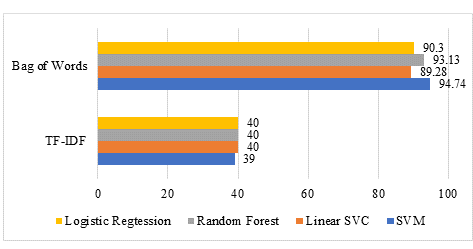
FIGURE 4. Results comparison of TF-IDF and BoW
As it is clear from the above graph that BoW feature extraction technique gives much better performance as compared to TF-IDF by using different ML classifiers.
Finally, features were extracted using TF-IDF and BoW during experiments. ML classifiers, such as SVM, LSVC, RF, and LR were adopted for sentiment analysis. Both feature lists, extracted by using TF-IDF and BoW, were used by ML classifiers for sentiment analysis of Roman text. Experiments showed that ML classifiers produced poor results using features extracted by TF-IDF. While, ML classifiers performed outstanding using features produced by BoW. SVM, LSVC, RF, and LR ML classifiers produced accuracy below 50% using features extracted by TF-IDF method. Furthermore, SVM produced 94.74% accuracy using BoW features’ list while, LSVC, RF, and LR produced 89.28%, 93.13%, and 90.30% accuracy, respectively.
The results showed that ML classifiers, such as SMC, LSVC, RF, and LR performed outstanding using features’ list extracted by BoW method. While, these classifiers produced poor results using TF-IDF extracted feature list as shown in Table 3. The graphical representation of the results produced by ML classifiers is shown in Figure 2 and Figure 3.
Finally, the results of proposed model were compared with the existing methods. Table v represents the comparison.
TABLE V
COMPARISON OF PROPOSED MODEL WITH EXISTING METHODS
|
Author |
Classifier |
Feature Extraction |
Language |
Accuracy |
|
SaminaYasin et al (2020) |
Logistic Regression |
Count Vectorization, |
English & Roman Urdu |
87% |
|
Muhammad Asif et al (2020) |
Linear Support Vector Classifier |
TF-IDF |
Urdu, Roman Urdu, English |
82% |
|
Ayesha Rafique et al (2019) |
SVM |
TF-IDF |
Roman Urdu |
87.22 |
|
Raheela Bibi et al (2019 |
Decision tree C45 |
- |
Urdu |
90% |
|
Moin Khan & Kamran Malik (2018) |
Multinomial Naïve Bayes |
- |
Roman Urdu |
89.75% |
|
Muhammad Asif et al (2019) |
Naïve Bayes |
- |
Roman Urdu/ Hindi |
75% |
|
Ata-Ur-Rehman et al. (2019) |
SVM |
TF-IDF, BoW |
English |
87% |
|
Muhammad Hammad & Haris Anwar (2019) |
SVM |
- |
Sindhi |
64.6% |
|
Proposed |
SVM |
BoW |
Roman Urdu |
94.74% |
Table above shows the performance of different classifiers in previous research. The comparison was made on the basis of some factors, such as classifiers, feature extraction method, and language. The comparison Table shows that the proposed model produced better accuracy on the basis of factors compared, such as feature extraction methods, classifiers, and language. The comparison showed that by using BoW feature list, SVM produced 94.74% accuracy.
In the current research, two different feature extraction techniques were applied, that is, TF-IDF and BoW. SVM, LSVC, LR, and RF-based sentiment classification models were presented to improve the overall accuracy of these models. In this study, sentiment analysis of Roman text was performed by using ML techniques. A dataset was used in the Roman Urdu language and preprocessing was performed to clean the data. Previously proposed techniques were used for the tokenization of sentences and SVM, LSVC, RF, and LR were applied on the dataset. The results showed that the BoW technique with SVM and RF classifier performed well on the Roman Urdu dataset. Considering the accuracy of performance, SVM under the BoW feature extraction technique gave the best results, that is, 95%.
Roman Urdu has received limited research attention, with only a handful of formal studies dedicated to it. There is a notable need for further research to be conducted in the areas of semantic and sentiment analysis concerning Roman Urdu. Future investigations could center around larger and more extensive datasets as well as the exploration of alternative tokenization and preprocessing techniques to potentially achieve improved results.
[1] D. M. E.-D. M. Hussein, "A survey on sentiment analysis challenges," J. King. Saud. Unive.-Eng. Sci., vol. 30, no. 4, pp. 330–338, Oct. 2018, doi: https://doi.org/10.1016/j.jksues.2016.04.002
[2] W. Villegas-Ch, S. Molina, V. D. Janón, E. Montalvo, and A. Mera-Navarrete, "Proposal of a method for the analysis of sentiments in social networks with the use of R," Informatics, vol. 9, no. 3, Art. no. 63, Aug. 2022. doi: https://doi.org/10.3390/informatics9030063
[3] I. H. Sarker, "Ai-based modeling: Techniques, applications and research issues towards automation, intelligent and smart systems," SN Comput. Sci., vol. 3, no. 2, Art. no. 158, 2022, doi: https://doi.org/10.1007/s42979-022-01043-x
[4] B. Hasselgren, C. Chrysoulas, N. Pitropakis, and W. J. Buchanan, "Using social media \& sentiment analysis to make investment decisions," Future Internet, vol. 15, no. 1, Art. no. 5, Dec. 2023, doi: https://doi.org/10.3390/fi15010005
[5] Nasdaq. "How does social media influence financial markets?," Nasdaq.com. https://www.nasdaq.com/articles/how-does-social-media-influence-financial-markets-2019-10-14 (accessed Jan. 1, 2023].
[6] A. Ligthart, C. Catal, and B. Tekinerdogan, "Systematic reviews in sentiment analysis: a tertiary study," Artif. Intell. Rev., vol. 54, no. 7, pp. 4997–5053, 2021, doi: https://doi.org/10.1007/s10462-021-09973-3
[7] Y. K. Dwivedi et al., "Setting the future of digital and social media marketing research: Perspectives and research propositions," Int. J. Info. Manag., vol. 59, Art. no. 102168, 2021, doi: https://doi.org/10.1016/j.ijinfomgt.2020.102168
[8] U. Sivarajah, M. M. Kamal, Z. Irani, and V. Weerakkody, "Critical analysis of big data challenges and analytical methods," J. Bus. Res., vol. 70, pp. 263–286, Jan. 2017, doi: https://doi.org/10.1016/j.jbusres.2016.08.001
[9] S. Haque, "Language use and islamic practices in multilingual europe," Signs Soc., vol. 8, no. 3, pp. 401–425, 2020, doi: https://doi.org/10.1086/710157
[10] Z. Ansari, S. Ali, and F. Khan, "Use of roman script for writing urdu language," Int. J. Linguist. Cul., vol. 1, no. 2, pp. 165–178, 2020, doi: https://doi.org/10.52700/ijlc.v1i2.20
[11] F. Noor, M. Bakhtyar, and J. Baber, "Sentiment analysis in E-commerce using SVM on roman urdu text," in Int. Conf. Emerg. Technol. Comput., 2019, pp. 213–222, doi: https://doi.org/10.1007/978-3-030-23943-5_16
[12] B. Chandio et al., "Sentiment analysis of roman Urdu on e-commerce reviews using machine learning," CMES-Comput. Model. Eng. Sci., vol. 131, no. 3, pp. 1263–1287, Apr. 2022, doi: http://dx.doi.org/10.32604/cmes.2022.019535
[13] I. U. Khan et al., "A review of Urdu sentiment analysis with multilingual perspective: A case of Urdu and roman Urdu language," Computers, vol. 11, no. 1, Art. no. 3, 2021; doi: https://doi.org/10.3390/computers11010003
[14] Worldometer. "South Asian Population (Live)." Worldometer.com. https://www.worldometers.info/world-population/southern-asia-population/ (accessed Jan. 1, 2023).
[15] W. Ahmad and M. Edalati, "Urdu speech and text based sentiment analyzer," arXiv, arXiv:2207.09163, 2022, doi: https://doi.org/10.48550/arXiv.2207.09163
[16] F. H. A. Shibly, U. Sharma, and H. M. M. Naleer, "Classifying and measuring hate speech in Twitter using topic classifier of sentiment analysis," in Int. Conf. Innov. Comput. Commun., 2021, pp. 671–678, doi: https://doi.org/10.1007/978-981-15-5113-0_54
[17] L. Nemes and A. Kiss, " Social media sentiment analysis based on COVID-19," J. Info. Telecommun., vol. 5, no. 1, pp. 1–15, July 2021, doi: https://doi.org/10.1080/24751839.2020.1790793
[18] F. Mehmood, M. U. Ghani, M. A. Ibrahim, R. Shahzadi, W. Mahmood, and M. N. Asim, "A precisely xtreme-multi channel hybrid approach for roman urdu sentiment analysis," IEEE Access, vol. 8, pp. 192740–192759, Oct. 2020, doi: https://doi.org/10.1109/ACCESS.2020.3030885
[19] M. Asif, A. Ishtiaq, H. Ahmad, H. Aljuaid, and J. Shah, "Sentiment analysis of extremism in social media from textual information," Telemat. Info., vol. 48, Art. no. 101345, May 2020, doi: https://doi.org/10.1016/j.tele.2020.101345
[20] M. P. Akhter, Z. Jiangbin, I. R. Naqvi, M. Abdelmajeed, and M. T. Sadiq, "Automatic detection of offensive language for urdu and roman Urdu," IEEE Access, vol. 8, pp. 91213–91226, May 2020, doi: https://doi.org/10.1109/ACCESS.2020.2994950
[21] S. Yasin, K. Ullah, S. Nawaz, M. Rizwan, and Z. Aslam, "Dual language sentiment analysis model for youtube videos ranking based on machine learning techniques," Pak J Eng Technol., vol. 3, no. 2, pp. 213–218, Oct. 2020. https://doi.org/10.51846/vol3iss2pp213-218
[22] Z. Nasim and S. Ghani, "Sentiment analysis on urdu tweets using markov chains," SN Comput. Sci., vol. 1, Art. no. 269, Aug. 2020, doi: https://doi.org/10.1007/s42979-020-00279-9
[23] S. Rani and W. Anwar, "Resource Creation and evaluation of aspect based sentiment analysis in Urdu," in Proc. 1st Conf. Asia-Pacific Chap. Assoc. Comput. Linguist. 10th Int. Joint Conf. Natu. Lang. Process., B. Shmueli, Y. J. Huang, Eds., Dec. 2020, pp. 79–84.
[24] A. Rafique, M. K. Malik, Z. Nawaz, F. Bukhari, and A. H. Jalbani, "Sentiment analysis for roman urdu," Mehran Univ. Res. J. Eng. Technol., vol. 38, no. 2. pp. 463–470, 2019.
[25] R. Bibi, U. Qamar, M. Ansar, and A. Shaheen, "Sentiment analysis for urdu news tweets using decision tree," in IEEE 17th Int. Conf. Soft. Eng. Res. Manag. Appl., 2019, pp. 66–70, doi: https://doi.org/10.1109/SERA.2019.8886788
[26] E. ul Haq, S. Rauf, S. Hussain, and K. Javed, "Corpus of aspect-based sentiment for urdu political data," Lang. Technol., pp. 37–40, 2019.
[27] K. Mehmood, D. Essam, and K. Shafi, "Sentiment analysis system for Roman Urdu," in Proc. 2018 Comput. Conf., 2018, pp. 29–42, doi: https://doi.org/10.1007/978-3-030-01174-1_3
[28] Z. Sharf and S. U. Rahman, "Lexical normalization of roman Urdu text," Int. J. Comput. Sci. Net. Sec., vol. 17, no. 12, pp. 213–221, 2017.
[29] Z. Sharf and S. U. Rahman, "Performing natural language processing on roman urdu datasets," Int. J. Comput. Sci. Net. Sec., vol. 18, no. 1, pp. 141–148, 2018.
[30] S. J. Mielke, "Between words and characters: a brief history of open-vocabulary modeling and tokenization in NLP," arXiv, arXiv:2112.10508: 2021. https://doi.org/10.48550/arXiv.2112.10508
[31] R. Satapathy, C. Guerreiro, I. Chaturvedi, and E. Cambria, "Phonetic-based microtext normalization for twitter sentiment analysis," in IEEE Int. Conf. Data Min Works., 2017, pp. 407–413, doi: https://doi.org/10.1109/ICDMW.2017.59
[32] V. S. Vykhovanets, J. Du, and S. A. Sakulin, "An overview of phonetic encoding algorithms," Autom. Remote. Control., vol. 81, pp. 1896–1910, Nov. 2020, doi: https://doi.org/10.1134/S0005117920100082
[33] Z. Bhatti, A. Waqas, I. A. Ismaili, D. N. Hakro, and W. J. Soomro, "Phonetic based Soundex & shapeex algorithm for sindhi spell checker system," Adv. Environ. Biology., vol. 8, pp. 1147–1155, 2014.
[34] A. Kumar and S. P. Panda, "A survey: How python pitches in IT-world," in Int. Conf. Mach. Learn Big Data Cloud Parallel Comput., 2019, pp. 248–251, doi: https://doi.org/10.1109/COMITCon.2019.8862251
[35] M. Lavin, "Analyzing documents with TF-IDF," Program. Histor. 2019, no. 8, pp. 1–21, doi: http://dx.doi.org/10.46430/phen0082
[36] V. Sundaram, S. Ahmed, S. A. Muqtadeer, and R. R. Reddy, "Emotion analysis in text using TF-IDF," in 11th Int. Conf. Cloud Comput. Data Sci. Eng., 2021, pp. 292–297, doi: https://doi.org/10.1109/Confluence51648.2021.9377159
[37] R. N. Rathi and A. Mustafi, "The importance of Term Weighting in semantic understanding of text: a review of techniques," Multimed Tools Appl., vol. 82, no. 7, pp. 9761–9783, 2023, doi: https://doi.org/10.1007/s11042-022-12538-3
[38] Y. Zhang, R. Jin, and Z. H. Zhou, "Understanding bag-of-words model: a statistical framework," Int. J. Mach. Learn. Cyber., vol. 1, pp. 43–52, Aug. 2010, doi: https://doi.org/10.1007/s13042-010-0001-0
[39] S. Georgeand and S. Joseph, "Text classification by augmenting bag of words (BOW) representation with co-occurrence feature," IOSR J. Comput. Eng., vol. 16, no. 1, pp. 34–38, 2014.
[40] V. Dogra, S. Verma, P. Chatterjee, J. Shafi, J. Choi, and M. F. Ijaz, "A complete process of text classification system using state-of-the-art NLP models," Comput. Intell. Neurosci., vol. 2022, Art. no. 1883698, doi: https://doi.org/10.1155/2022/1883698
[41] S. Suthaharan and S. Suthaharan, "Support vector machine," in Machine Learning Models And Algorithms For Big Data Classification: Thinking With Examples For Effective Learning. Boston; Springer, 2016, pp. 207–235.
[42] F. Nie, W. Zhu, and X. Li, "Decision Tree SVM: An extension of linear SVM for non-linear classification," Neurocomputing, vol. 401, pp. 153–159, Aug. 2020, doi: https://doi.org/10.1016/j.neucom.2019.10.051
[43] A. Patle and D. S. Chouhan, "SVM kernel functions for classification," in Int. Conf. Adv. Technol. Eng., 2013, pp. 1–9, doi: https://doi.org/10.1109/ICAdTE.2013.6524743
[44] D.-X. Zhou and K. Jetter, "Approximation with polynomial kernels and SVM classifiers," Adv. Comput. Math. vol. 25, no. 1-3, pp. 323–344, 2006, doi: https://doi.org/10.1007/s10444-004-7206-2
[45] B. H. Cho, H. Yu, J. Lee, Y. J. Chee, I. Y. Kim, and S. I. Kim, "Nonlinear support vector machine visualization for risk factor analysis using nomograms and localized radial basis function kernels," IEEE Transac. Info. Technol. Biomed., vol. 12, no. 2, pp. 247–256, Mar. 2008, doi: https://doi.org/10.1109/TITB.2007.902300
[46] L. Ladicky and P. Torr, "Locally linear support vector machines," in Proc. 28th Int. Conf. Mach Learn., 2011, pp. 985–992.
[47] D. Abdelhamid and A. Taleb-Ahmed, "Support vector machine based clustering: A review," in Int. Sympos. iNnovat. Info. Biskra, 2022, pp. 1-6, doi: https://doi.org/10.1109/ISNIB57382.2022.10076027
[48] A. Cutler, D. R. Cutler, and J. R. Stevens, "Random forests," in Ensemble Machine Learning: Methods and applications, C. Zhang and Y. Ma, Eds., Springer, 2012, pp. 157–175, doi: https://doi.org/10.1007/978-1-4419-9326-7_5
[49] A. Parmar, R. Katariya, and V. Patel, "A review on random forest: An ensemble classifier," in Int. Conf. Intell. Data Commun. Technol. Internet Things, 2019, pp. 758–763, doi: https://doi.org/10.1007/978-3-030-03146-6_86
[50] Y. Qi and Z. Shabrina, "Sentiment analysis using Twitter data: a comparative application of lexicon-and machine-learning-based approach," Soc. Netw. Anal. Min., vol. 13, no. 1, p. 31, Feb. 2023, doi: https://doi.org/10.1007/s13278-023-01030-x
[51] X. Liao, Y. Xue, and L. Carin, "Logistic regression with an auxiliary data source," in Proc. 22nd Int. Conf. Mach. Learn., 2005, pp. 505–512, doi: https://doi.org/10.1145/1102351.1102415
[52] I. H. Sarker, "Machine learning: Algorithms, real-world applications and research directions," SN Comput. Sci., vol. 2, no. 3, Art. no. 160, 2021, doi: https://doi.org/10.1007/s42979-021-00592-x