
Mariya Tauqeer 1, Shakeela Aslam2, Iqra Rafique2, Tauseef Rana2, Halima Jamil1
1 University of Management and Technology, Lahore, Pakistan
2 National University of Sciences and Technology, Islamabad, Pakistan
*Corresponding Author: [email protected]
ABSTRACT Visual representation is better as compared to textual representation in every aspect, either for a code or for the design of a software product. Writing a code using different programming languages in textual form is quite difficult as compared to a visual representation of code. The current study proved this phenomenon by presenting different codes in three different representations. These representations include textual, algorithm, and flow graph. On the basis of observation and analysis of the current study, these three representations were examined. It was concluded that visual representation is the best way to present a code according to many parameters. These results are helpful in the recent switch towards low programming from high programming. Moreover, further research can be conducted on how large enterprise applications code can be created by using visual programming languages.
INDEX TERMS Cognition, Visual representation, logical reasoning, Textual representation, Languages, Algorithms
Textual and visual representation impact the human mind in multiple ways. Since technological need is increasing day by day, human beings are becoming fully dependent on it. In order to understand the computer technology which is based on programming, human beings need to understand programming first. Programming is represented in textual form which is difficult to understand by non-computer disciplines. Visual programming allows human beings to understand the programming content and also makes mental model quickly. Nowadays, there is a shift between low programming and high programming. Low programming includes concepts of visual programming which are low on budget and easy to understand and which would ultimately lead towards green programming. On the other side, high programming includes textual codes in different programming languages. Research has been conducted on why human beings find textual form quite difficult to understand. Human mind seeks things more effectively that are presented in a sequential and procedural manner.
The dependency of human beings on technology is increasing day by day. To provide solutions for human or real-world problems many software or programs have been developed. Coding is one of the most crucial parts in any software development. Firstly, coding was performed in low level languages but for human ease high level languages were developed for coding purposes. However, coding languages are quite difficult for human perception, especially for faculties other than computer sciences. Such coding languages consist of merely textual representations which are difficult to interpret. To cope with such difficulties, visual representations are used and instead of coding in textual form, the program can be coded by using different ways of visualizations.
The human mind comprises two parts, that is, the right part and the left part. The right part involves emotions, feelings, creativity, and sensitivity, while the left part contains languages, logical reasoning, and cognitive functions [1]. Visual representations invoke these both parts of human mind. This involvement results in logical functions along with cognitivism and creativity. Researchers concluded that human mind processes visual representations 600,000 times faster than the text. People usually read only 20% of text on a website [2].
Textual representations involve many problems due to which visual representations need to be provided. Textual representations are less concise, non- uniform, ambiguous, and hard to understand. On the other hand, visual representations are easy to interpret for technical as well non-technical people. Moreover, visual representations are easily understandable and more concise. These representations take less time and effort in understanding rather than textual representations. The current study covered most of the problems of textual coding and to solve out those problems, certain ways for coding were presented in visual formats. Major forms of representations of code were analyzed, that is, algorithms, programming, flowcharts, flowgorithm [3], and visual programming languages. On the basis of this analysis, different representations of codes would be evaluated. Moreover, it would also be determined that which representation is best on the basis of different parameters.
The first part of the current study identified the problem of textual representations, effects of aesthetics on human brain, and working of human brain in the context of HCI. The second part consisted of solution of the problem identified in the first section. The last part included the evaluation of the solution.
To prove the fact that visual representation is better than textual representation in understanding as well as many other factors, such as effectiveness, learning readability, three major representations of different codes were presented. These representations include Textual: Simple code in any high-level programming language. Algorithm: Code functionality written in simple English format, incorporating the steps to perform those functionalities. Flow graph: Flowcharts of the code are developed in different ways, that is, using VPL or other tools that convert the code in visual formats by using drag and drop or simple transformation of high-level language code into flow-graphs.
In visual representation, the use of sequence makes human mind to pick the concept easily. Visual programming manipulates the programming elements in graphical form, such as icon, blocks, boxes, and arrows [4]. It is an icon-based representation which is easily editable and movable. While, textual language is non-uniform presentation of text. Textual form does not describe the flow of sequence. For human mind, it is hard to understand what is invisible to eye. There are three different forms of representations of programming, for instance textual, algorithms, and flow graphs. In flow graphs, programming is presented by using flowcharts. These flowcharts are in graphical form to describe the flow of programming sequence. Algorithms are somehow textual representations but sequence is included in algorithms, while textual form is merely the text, that is, the programming language code. Codingindifferentprogramminglanguagesisquitedifficultto understand for students of computer sciences as well asotherfaculties.
The algorithms and programming can be taught more effectively to the students other than computer science by using visual representation tools rather than coding in different programming languages. Moreover, flowcharts can also be used to teach programming fundamentals instead of code. There are different tools to analyze flowcharts that are based on programming environments. Flowgorithm is a very effective tool that allows to present the algorithms in visual representation. "Jigsaw Puzzle" is a programming environment in which Tiled Grace allows to drag and drop the textual coding syntax into tile view for easy representation. The dual view of programming representation is more helpful for understanding [5].
Several techniques have been developed for information visualization to represent and analyze the data. These techniques help to generate interactive Graphical User Interfaces (GUI). Information visualization techniques show their use in experimental situations, moreover these techniques also show the criteria for the assessment of information visualization techniques, visual representation assessment, and mechanisms of interaction [6].
In terms of accuracy, the study did not find any statistically significant difference. The graphic representation requires more time and energy, however, this energy consumption do not affect the precision. A survey was conducted to perform the task of comprehension requirements. The output of survey proposed and implemented an eye-tracking study to inspect the effect of textual vs visual representations. Interactive data visualization needs to be carefully assessed at different stages (e.g., accessibility, method of visualization, and case study). There are two phases of evaluation process, that is, the Gravi++ system test and the usability analysis.
In usability evaluation/rule analysis, heuristic assessment and focus groups were used as approaches [7]. A very useful tool was heuristic analysis to find usability problems. By using the focus group approach, considerable information can be obtained about usability issues [8]. Sets of logically derived hypotheses are there which are suitable for systematic empirical research. A crucial step is empirical research to further clarify the implications presented for decision-making by different visualization tools [9]. Human senses play an important role in human perception of information obtained through software design. To encounter the role of these senses in human computer inter- action and software designing, research was conducted. The role of three senses, that is, sense of taste, sense of smell, and sense of touch is quite important in designing while considering human computer interaction.
Aesthetics play quite an important role in human perception. Beautiful and captivating designs attract human beings more and enhance their ability to understand the design and its functionality [10]. Research was conducted which figured out how aesthetics may help in designing a software that would attract the users towards itself and is easily understandable. Aesthetics can help in determining the quality of a software, its acceptance in society, and many other things. The role of aesthetics in different disciplines, such as mathematics, physics, and computer science is also analyzed [11].
The e- commerce websites compare the effects of complexity in visual representation and figure-ground color contrast. A laboratory experiment was carried out based on questionnaire responses. This concluded that well-designed websites, with appropriate visual and figure-background, more attracts and hold the customers [12].
Visual programing language plays an important role in understanding the basic programing language concepts. To enhance the understanding of students, the author used visual programing language (VPL). VPLs are suitable for those who are not the students of computer science. Moreover, VPL learning environment increases the efficiency to learn and minimize the complexity in learning.
There are two measures for co-occurring interrelated graphics and textual information. These are Semantic Correlation (SC) and Cross Modal Mutual Information (CMI). Different datasets were also combined to increase the variety of image-text pairs [13].
FIGURE 1. Combining tiled and textual views of code
To increase the visibility of code, Figure 1 shows the combination of tiled and codes in textual form by using different colors. how graphical representation of programming language in the form of blocks improve understandability [16].
Like many other practitioners, librarians mostly depend on textual representation rather than graphical representation. Visual representation by using images is more beneficial than textual representation. Through integrating insights, communication can be done more efficiently with colleagues and customers [17].
Textual representation of code is very difficult to understand and interpret for the students of faculties other than computer sciences. There should be a way to present that textual code in visual format as visualization can be easily perceived than texts by a human mind. Following are the factors which should be kept in mind while creating the code. A shift is observed nowadays towards low programming which emphasize visual-based programming rather than textual.
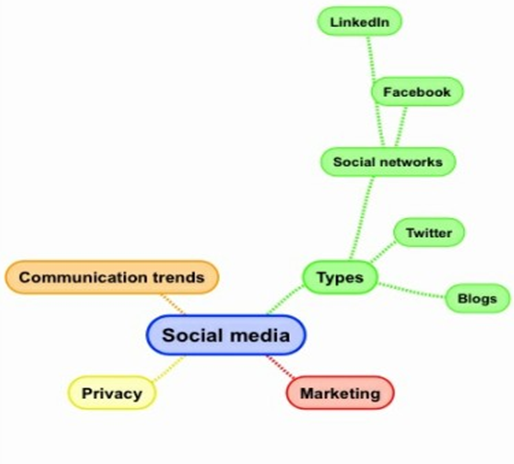
FIGURE 2. Concept maps
Figure 2 shows the use of concept maps in order to map different topics for better understanding. The loop, sequence, and condition are used as basic programing language concepts. A quasi-experimental design was used in this study to explore self-efficacy and measuring the difference in the performance of different students. The teaching of VPL enhanced the learner's understanding of basic programming concepts. For learning and teaching of programming, different tools are used to improve the teaching skills and enhancing the learning capability of students and also for the understanding of syntax. Most of the learners get frustrated due to the complexity of the code. The teacher and student also develop an understanding of the code by using programming tools [14]. Many issues are involved in learning the research and teaching of programming which consist of tools used to learn and program teaching and also the level of programming and further, method of research used. However, most of the issues are concerned with programming teaching tools [15].
Understanding of code plays a very important role in any software development activity. Readability and code under- standing is a very complex activity for the developer. This is the reason that most of the developers spend a lot of time to understand the code. Understanding of code also provides help for the developer to change the existing code components. The developers could be able to fix the bugs by measuring the code understandability. A research paper proposed model and metrices for assessing the understandability, complexity and readability of code. The block-based programming language helps the beginners to learn programming language more effectively. The block-based programming languages explored.
A human mind receives input through senses. There are five senses, that is, sense of hearing, sense of smell, sense of touch, sense of sight, and taste [18]. Taste and smell are not related with designing or human computer interaction directly. While, the other three senses, that is, hearing, touch, and sight play a vital role in designing a software. Input output channels include vision, touch, and hearing. Vision includes colors, readings, and optical illusions. It helps in the interpretation of signals using distances and luminance effects. Sense of hearing includes sound factors, such as beep or ringing and it also helps in distinguishing the pitch, loudness, and timbre. Touch or haptic perception receives the stimulus with the help of skin receptors including thermo-receptors, nociceptors, and mechanoreceptors.
The working of human mind comprises of three steps i.e. receiving a stimulus, processing the information received from that stimulus and giving some response in the form of output based on the stimulus received. Basically, it follows a cycle in which some perception is developed from some object of the world by using its context and environment. Afterwards, a cognition is made on the basis of that perception which then results in some action as shown in Figure 3.
While designing a software, the designer should consider two most important human senses, that is, sight and sound. For better understanding of a design by using sight, the designer should comprehend the biological aspects of human eye and its functioning. The design must be captivating so that it can be easily envisioned, construed and precepted by human brain.
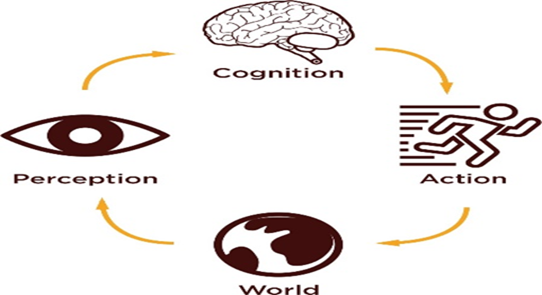
FIGURE 3. Working of human mind
For this purpose, the designer should design the software using real world entities or aspects, so that human brain can relate the design with real world aspects and can understand the functioning easily or without creating so much pressure on human brain [19]. If a user takes enough time while understanding the design of the software, he/she would get frustrated or he/she may quit using that particular software.
Sound is not used as much as sight while creating inter- faces or designing a software but it may have a considerable impact on human capabilities [20]. The sound of buzz, error messages, beeps, and ringing may facilitate the user in a variety of ways to understand the design. Sound is a very helpful sense since it assists to "design for all" including humans with disabilities as users. For a blind person, the best way to understand a software is to use his/her sense of sound in order to understand something. Therefore, the designers must incorporate the sound factor in their designs or interfaces wisely. Likewise, haptic or sense of touch may also be very helpful while designing for all. Skin receptors are helpful in understanding the design and its functionalities.
This phenomenon encounters the role of TAM (Technology Acceptance Model) in usability that either the technology designed by the designer is acceptable by humans or not.
Aesthetics is also related to human senses. It includes visual attractiveness or captivation of a software design. Human mind gets attracted to beautiful things. Merely text in programming can never be captivating enough and might be quite difficult to understand as well. Additionally, the coding platforms or frameworks have limited functionalities which do not corporate any factors of aesthetics [21]. Due to this reason, the software must be designed including aesthetic principles [22]. On the other hand, programming can also be done using different flowcharts or tools including aesthetic principles. Moreover, students can understand the functionality or logic in a better way as pictures can be easily perceived by human mind rather than the text. Most of the design variables or decisions are aesthetically evaluated firstly before implemented as mentioned in Figure 4.
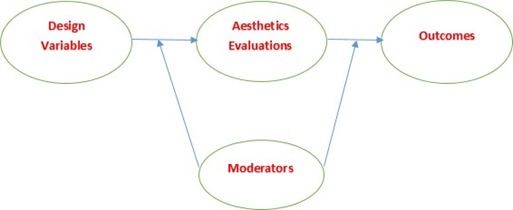
FIGURE 4. Role of aesthetics
To incorporate the principles of aesthetics, 3C's of interface should be considered which include color, contrast, and content. The colors used must be soothing and attracting rather than pinching or creating stress on human mind and eyes [23]. The contrast must be according to the design or hardware capabilities so that the design should have balanced contrasts or saturation. The content should be aligned properly for better perception. A matrix of usability and aesthetics is shown in the following table.
TABLE I
USABILITY VS AESTHETICS
Different tools and techniques are available for different representations of code. Flowgorithm is one of the tools which is used to incorporate the algorithms as well as flowcharts together. This tool is quite helpful for better understanding through flow graphs.
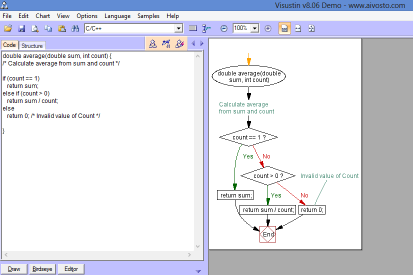
FIGURE 5. Visustin tool
Visustin 5 is a tool which helps in code visualization by creating flowchart and UML activity diagrams. "Visustin" was used to present the source code in the form of flowcharts. This tool supports 49 languages and no manual drawing is required. Many other visual programming language tools are available for the development of software using drag and drop instead of textual coding, such as Scratch and Blockly.
The study selected four different codes and presented them in three different forms of representations.
1) HIGH-LEVEL PROGRAMMING LANGUAGE CODE
double average (double sum, int count) /* calculate average from sum and count */
if(count==1)
return sum;
elseif (count? 0)
return sum/count;
else
return 0; /* Invalid value of Count */
2) ALGORITHM
1: Get numbers
2: Add the numbers together to calculate the sum 3: Count the numbers
4: If count==1
5: return number
6: else average=sum/count
7: return average
3) FLOW GRAPH
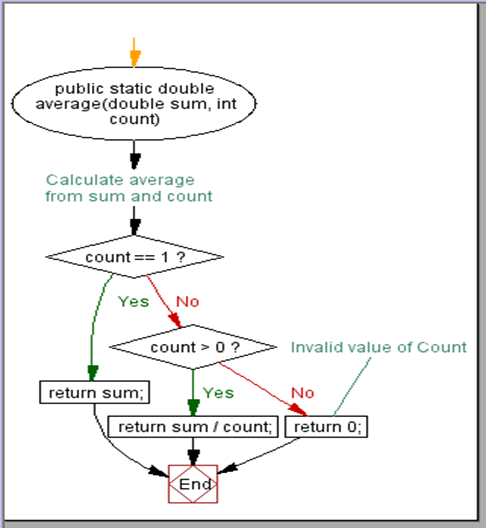
FIGURE 6. Average of numbers using if-else statement
1) HIGH-LEVEL PROGRAMMING LANGUAGE CODE
int sum (int A [], int N)
/* Sum up the elements of array A[N]. Example of a for loop. */
int i,
total = 0;
for (i=0; i<=N; i++)
total = total + A[i];
return total;
2) ALGORITHM
1: Initialize the array of element arr[] 2: Store in variable N
3: Initialize sum=0
4: Iterate each element of array and add the current value to sum
5: Iterate loop from 0 to N 6: Sum=Sum+arr[i]
7: return Sum
3) FLOW GRAPH
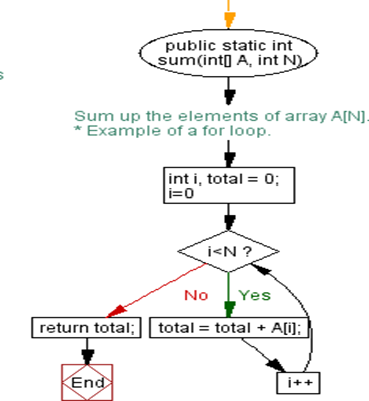
FIGURE. 7. Sum of the Elements of Array A[N] using For Loop
1) HIGH-LEVEL PROGRAMMING LANGUAGE CODE
switch (operand)
case MULTIPLY:
x *= y;
break;
case DIVIDE:
x /= y;
break;
case ADD:
x += y;
break;
case SUBTRACT:
x -= y;
break;
2) ALGORITHM
1: Select switch case operand
2: If user selects multiply then x=x*y
3: If user selects division, then x=x/y
4: If user selects addition, then x=x+y
5: If user selects subtraction, then x=x-y
6: print default
3) FLOW GRAPH
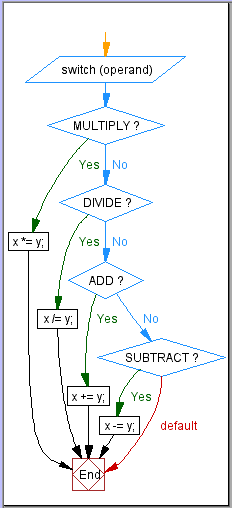
FIGURE 8. Arithmetic Functions using Switch Statements
1) HIGH-LEVEL LANGUAGE CODE
public static int Average with Exceptions (int sum, int count)
/* Calculate average from sum and count
This function takes integer arguments
and returns the integer result of Sum/Count */
int avg=0;
try
/* Validate count */ if (count ¡ 0)
throw new
System.ApplicationException("Count must be positive.");
/* Divide sum by count using integer division */
avg = sum / count;
catch (System.DivideByZeroException e)
/* Display division by zero exception*/ MessageBox.Show("Division by zero.");
avg = 0;
catch (System.ApplicationException e)
/* Display application exception*/ MessageBox.Show(e.Message);
avg = 0;
return avg;
2) ALGORITHM
1: Initialize average=0
2: Try if count¡0
3: Throw system application exception
4: Catch system.dividedbyzeroexception
5: Show message: divisionbyzero and display average=0 6: If yes, show systemapplicationexception
7: else exception message
8: If count?0 then calculate average=sum/count
9:Display average
3) FLOW GRAPH
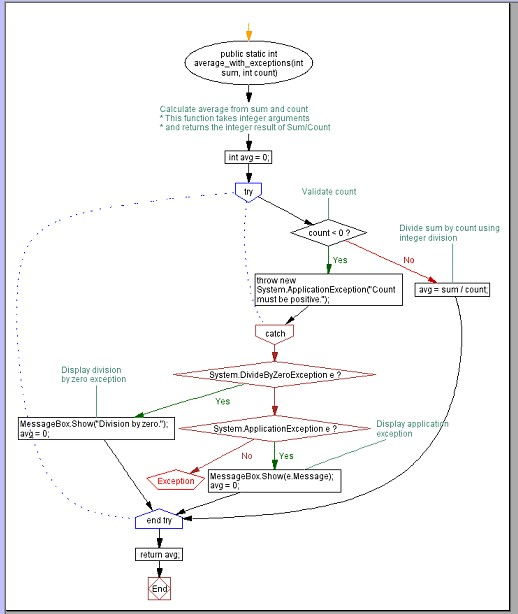
FIGURE 9. Calculate Average using Exception Handling
The study analyzed different code scenarios in different forms of representation, that is, textual, algorithmic, and flow graphs. By visualizing the code in these different representations, it was concluded that visual representations, that is, flow graphs, are the best way to present a code. The parameters to analyze the representations are as follows:
Human mind perception of the code.
Understanding of the code by students.
Readability of the code either it is readable or not?
Ambiguity in understanding as well as implementation. Correct understanding of code and its functionality.
Consistency of code or functionality implemented in the code in terms of correct functionality and conciseness in terms or values used.
Acceptability of representation by students in terms of understanding or by developers in terms of implementation.
Learnability of the code by students either it can be easy to memorize or not
Effectiveness in terms of performance. How much time is taken in implementation?
Attractiveness of the code either in textual form or pictorial form, considering the aesthetics.
Time consumption with respect to developer, with respect of writing the code or drawing the flow graphs.
TABLE II
EVALUATION TABLE
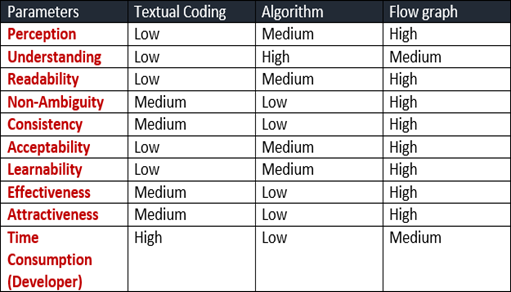
Table II shows the levels of above-mentioned parameters in different representations of code, that is, textual, algorithm , and flow graph.
There are many ways to represent a code. However, what matters is the better understanding and interpretation of the code both at coding level and at user level. Pictures or diagrams always have a captivating quality in them which makes them more acceptable and understandable by human mind in less time. It was proved by presenting different ways of code representation, that is, textual, flow graphs, algorithms, and visual programming. Code can be presented in all these ways but there is different level of understanding for each way. The evaluation showed that flowcharts have the best understanding of code rather than algorithms or textual code. This is because pictures captivate the users in a better way. Flow graph is comparatively at higher level than textual coding and algorithm in terms of perception, readability, non- ambiguity, consistency, acceptability, learnability, effectiveness, and attractiveness. Although, algorithm has a high rate of understanding as compared to textual coding and flowgorithm. Moreover, the results also showed that textual coding is more time consuming than drawing algorithm and flow graphs. Many tools are available to create flow graphs on the basis of code, that is, flowgorithm. Visual programming also enables the designer to use drag and drop rather than coding for better interpretation of code.
The current study attempted to incorporate all the factors of textual and visual representations. However, there is always a scope for future work. More research is needed on the role of new senses, that is, taste and smell in HCI and designing. For instance, in on-line shopping websites, the taste of the user matters. There is a lot of scope in visual programming, that is, how large enterprise systems can be developed on the basis of VPL and how large and complex codes can be implemented in VPL.
[1] K. Cherry. "Left brain vs. right brain dominance." Verywellmind.com. https://www.verywellmind.com/left-brain-vs-right-brain-2795005 (updated May, 2023).
[2] R. Gillett. "Why we're more likely to remember content with images and video (Infographic)." Fastcompany.com. https://www.fastcompany.com/3035856/why-were-more-likely-to-remember-content-with-images-and-video-infogr (updated Sep. 2018.
[3] R. R. Gajewski and E Smyrnova-Trybulska, "Algorithms, programming, flowcharts and flowgorithm," in E-learn. Smart. Learn. Environ. Prep. New Gener. Special. 2018, pp. 393–408.
[4] Wikipedia. "Visual programming language—Wikipedia, the free encyclopedia." https://en.wikipedia.org/wiki/Visual_programming_language (accessed Jan. 12, 2020).
[5] M. Homer and J. Noble, "Combining tiled and textual views of code," in 2nd IEEE Work. Conf. Soft. Visualiz., 2014, pp. 1–10, Sep. 2014, doi: https://doi.org/10.1109/VISSOFT.2014.11
[6] C. M. Freitas, P. R. Luzzardi, R. A. Cava, M. Winckler, M. S. Pimenta, and L. P. Nedel, "On evaluating information visualization techniques," Acad. Med., pp. 373–374, 2002, doi: https://doi.org/10.1145/1556262.1556326
[7] Z. Sharafi, A. Marchetto, A. Susi, G. Antoniol, and Y.-G. Guéhéneuc, "An empirical study on the efficiency of graphical vs. textual representations in requirements comprehension" in 21st Int. Conf. Program. Comprehen., May 2013, pp. 33–42, doi: https://doi.org/10.1109/ICPC.2013.6613831
[8] M. Rester et al., "Assessing the usability of an interactive information visualization method as the first step of a sustainable evaluation," in Usabil. Symp. Empower Soft. Qual. How can Usabil. Eng. Reach these goals? 2005, pp. 31–44.
[9] N. H. Lurie and C. H. Mason, "Visual representation: Implications for decision making," J. Mark., vol. 71, no. 1, pp. 160–177, 2007, doi: https://doi.org/10.1509/jmkg.71.1.160
[10] M. Obrist et al., "Touch, taste, & smell user interfaces: In the future multisensory HCI," in Proc. 2016 CHI Conf. Extend. Abstrat. Human Fact. Comput. Syst., 2016, pp. 3285–3292, doi: https://doi.org/10.1145/2851581.2856462
[11] L. Tomov, "The role of aesthetics in software design, development and education," presented at 12th Ann. Int. Conf. Comput. Sci. Educ. Comput. Sci., Fulda, Germany, July 4–7, 2016.
[12] S.-W. Lin, L. Y.-S. Lo, and T. K. Huang, "Visual complexity and figure- background color contrast of e-commerce websites: Effects on con- sumers' emotional responses" in 49th Hawaii Int. Conf. Syst. Sci., 2016, pp. 3594–3603, doi: https://doi.org/10.1109/HICSS.2016.449
[13] C. Henning and R. Ewerth, "Estimating the information gap between textual and visual representations," Int. J. Multimedia Inf. Retrieval, vol. 7, no. 1, pp. 43–56, 2018, doi: https://doi.org/10.1007/s13735-017-0142-y
[14] C. Y. Tsai, "Improving students' understanding of basic programming concepts through visual programming language: The role of self-efficacy," Comput. Hum. Behav., vol. 95, 224–232, June 2019, doi: https://doi.org/10.1016/j.chb.2018.11.038
[15] S. M. Salleh, Z. Shukur, and H. M. Judi, "Analysis of research in programming teaching tools: An initial review," Procedia Soc. Behav. Sci., vol. 103, pp. 127–135, Nov. 2013. https://doi.org/10.1016/j.sbspro.2013.10.317
[16] S. Scalabrino, G. Bavota, C. Vendome, M. Linares-Vásquez, D. Poshyvanyk, and R. Oliveto, "Automatically assessing code understandability," IEEE Trans. Softw. Eng., vol. 47, no. 3, pp. 595–613, Mar. 2021, doi: https://doi.org/10.1109/TSE.2019.2901468
[17] P. Dewan, "Words versus pictures: Leveraging the research on visual communication," Partnership Can. J. Libr. Inf. Pract. Res., vol. 10, no. 1, 2015, doi: https://doi.org/10.21083/partnership. v10i1.3137
[18] J. M. Carroll, Ed., HCI Models, Theories, and Frameworks: Toward a Multidisciplinary Science. Elsevier, 2003.
[19] M. Tauqeer et al., "Driver's emotion and behavior classification system based on internet of things and deep learning for advanced driver assistance system," Comput. Commun., vol. 194, pp. 258–267, Oct. 2022, doi: https://doi.org/10.1016/j.comcom.2022.07.031
[20] A. Adams, P. Lunt, and P. Cairns, "A qualititative approach to HCI research," in Research Methods for Human-Computer Interaction, P. Cairns and A. Cox, Eds. Cambridge, UK: Cambridge University Press, 2008, pp. 138–157.
[21] N. Dell and N. Kumar, "The ins and outs of HCI for development" in Proc. 2016 CHI Conf. Human Fact. Comput. Syst., 2016, May, pp. 2220–2232, doi: https://doi.org/10.1145/2858036.2858081
[22] D. Bau, J. Gray, C. Kelleher, J. Sheldon, and F. Turbak. Learnable programming: Blocks and beyond. Commun. ACM., vol. 60, no. 6, pp. 72–80, June 2017, doi: https://doi.org/10.1145/3015455
[23] I. Benbasat, "HCI research: Future challenges and directions," AIS Trans. Human-Computer Interact., vol. 2, no. 2, pp. 16–21, 2010, doi: https://doi.org/10.17705/1thci.00011