Salma Asghar1*, Uzma Anjum2, and Urooj Akhter3
1Department of English, Women University of Azad Jammu & Kashmir, Bagh, Pakistan
2Department of English, Air University Islamabad, Pakistan.
3Department of English, University of Poonch, Rawalakot, Pakistan
* Corresponding Author: [email protected]
Pahari is an under-resourced, endangered, and undocumented tonal language, spoken in Pakistan Administered State of the Azad Jammu and Kashmir (AJK). Preliminary studies have established the notion, that the Pahari language has three discrete level tones; high, mid, and low. In the current study, tone distribution in monosyllabic words is measured with 45 iterations consisting of 15 high, 15 mid, and 15 low tones, collected from 5 native speakers of Pahari language. An attempt has been made to automatically recognize the phonologically contrastive tones in Pahari language, by using the Random Forest and the Linear Mixed Effect Models with f0 as a preliminary feature along with duration, intensity, F1, F3, and (Cepstral Peak Prominence) CPP. The results showed that the overall accuracy of the Random Forest was higher than the accuracy of the linear mixed effect model. Additionally, the mean f0 played a highly significant role in the prediction of tone while duration, intensity, F1, F3, and CPP played a less significant role.
Keywords: random forest, linear mixed effect models, fundamental frequency, first formant, third formant, cepstral peak prominence
Like all other word-formation processes; vowels, consonants and stress, tone is also a process found in all tonal languages which is co-articulated with vowels in one or two syllables. In tone languages, pitch variation causes lexical differences. Pike (1948) describes tone language as a language having lexically significant contrastive segments, but relative pitch on each syllable. In dynamic tones, it has a symbiotic relationship with vowels (Alan, 2010). The tone is lexical in numerous African, East Asian, and Chinese languages (van Lancker & Fromkin, 1978). Like all other tone languages, the tone is co-articulated with vowels in the Pahari language. Recently, a few researchers accepted the challenge to explore tone types and other aspects of various tonal languages, however, the phenomenon of speech recognition in general and tone recognition, in particular, needs to be explored yet. Jakobson and Halle (1968), and Halle and Chomsky (1968) discussed different binary features based on articulatory properties to explore the mechanism behind speech perception. The theories of perception, later developed by psychologists such as auditory theories, motor theories, categorical theories of perception, and others, also attempted to dig out the process of perception as a cognitive underlying system taking place in the human brain.
Instead of adopting conventional approaches to perception, the better option is to test these theories computationally in order to explore the actual process lying behind the whole speech perception phenomenon. It has been conducted for the last couple of decades and very few studies proved the use of such machine learning algorithms; such as Support Vector Machines, Hidden Markov model, Linear Mixed-Effects Models, and Neural Networks in this area of study. However, no significant work has been carried out in tone recognition with the Random Forest algorithm. The anticipated study aims to apply a Random Forest algorithm and Linear Mixed Effect models to explore Pahari tone recognition as tone exhibits fewer acoustic measurements than other phonetic units.
Diachronic studies proved that understanding the speech recognition mechanism has been a challenging task; therefore, a few significant works have been recorded in literature. Although a lot of serious efforts have been made by psychologists and linguists, there is still no transparent system identified to grasp the idea fully. In the recent past, researchers have been motivated to explore the simulation of machines with human languages and found that machine learning tools can be employed to check the recognition rate of speech. Consequently, various models have been developed, tested, and cross-validated to calculate speech recognition in general and tone perception in particular in different languages. As it has become a useful method to rate tone perception of African languages, Thai, Chinese, Cantonese, and many other languages including Punjabi with the help of machine learning/artificial intelligence, therefore, the under-resourced and undocumented tone languages spoken in Pakistan administered Kashmir need to be given much attention and there is a dire need to explore the tone recognition of these languages by simulating natural data with latest machine learning algorithms. This study aims to predict the effect of tone on the features of the syllable including pitch, duration, intensity and CPP with the help of machine learning algorithms such as Random Forest and LME (Linear Mixed Effects Models).
Tone perception is a complex phenomenon that is neglected in research in many language types. Moreover, the use of state-of-the-art machine learning algorithms is also not practised frequently by linguists. Most of the inquiry in this field conducted so far is done by programmers, statisticians, computer scientists, psychologists and data scientists. The current study would open new avenues for linguists to contribute to research with modern data analysis techniques where results are less biased and more objective. Additionally, the study will add some literature in the field of tone in the Pahari language.
Initially, the classic theory of distinctive features worked as the basic theory addressing feature-based speech recognition (Jakobson et al., 1951). Later, Jakobson introduced a system with binary contrast where acoustic properties of vowels and consonants along with tone were proposed (Jakobson et al., 1951). In addition to that, Halle and Chomsky proposed a larger set of binary contrasts based on articulatory properties (Halle & Chomsky, 1968). Apart from these theories, two major groups of theories in the field of perception are known as auditory theories and motor theories. Before going into the details of previous research, it is suggested to overview these theories in detail.
These theories work on a four-phase pattern where initial sounds are detected by the listener and then recognized, and in the end, the process of comprehension takes place. Listeners are sensitive to different acoustic properties of sounds and they achieve speech perception either by capturing these properties (Lotto et al., 2009) or by extracting the features of these sounds (Stevens & Blumstein, 1978). The whole mechanism assumes that there is no intermediate gestural representation between acoustic signals and recognized categories. They believe in the role of such distinctive features and assume that they should be extracted in the speech perception process (Kingston & Diehl, 1995).
These theories as a group in contrast to auditory theories assume that the human brain recognizes sounds with an articulatory recognition process where the tongue movement, lips movement, jaw movement, etc. work as articulatory gestures. The human brain identifies these movements cognitively and reproduces them. These movements are different for every single person. These theorists were motivated by no one-to-one correspondence between sounds and acoustic patterns (Cooper et al., 1952; Libermann et al., 1957). These articulatory gestures are invariant and produce highly variable acoustic patterns. Therefore, gesture serves as an intermediate feature that matches the auditory cues and perceives vowels, consonants, and tones simultaneously. Some research on infants and animals provides counter-evidence to these theories (Eimas et al., 1971). However, the neural activity of the motor system takes place in speech recognition, and motor areas are appointed while listening (Watkins et al., 2003). There is a shred of increasing evidence that motor areas are activated during special auditory situations and may not be involved during normal speech perception (Schmitz et al., 2019).
Motor theory suggests that gestures can be extracted from acoustic cues; however, the very assumption has not been tested in perception yet and has remained as a theoretical supposition. To make speech perception more accurate, at the beginning of the 21st century, Peng and Wang (2005) introduced a model and emphasized the importance of artificial intelligence in studying perception.
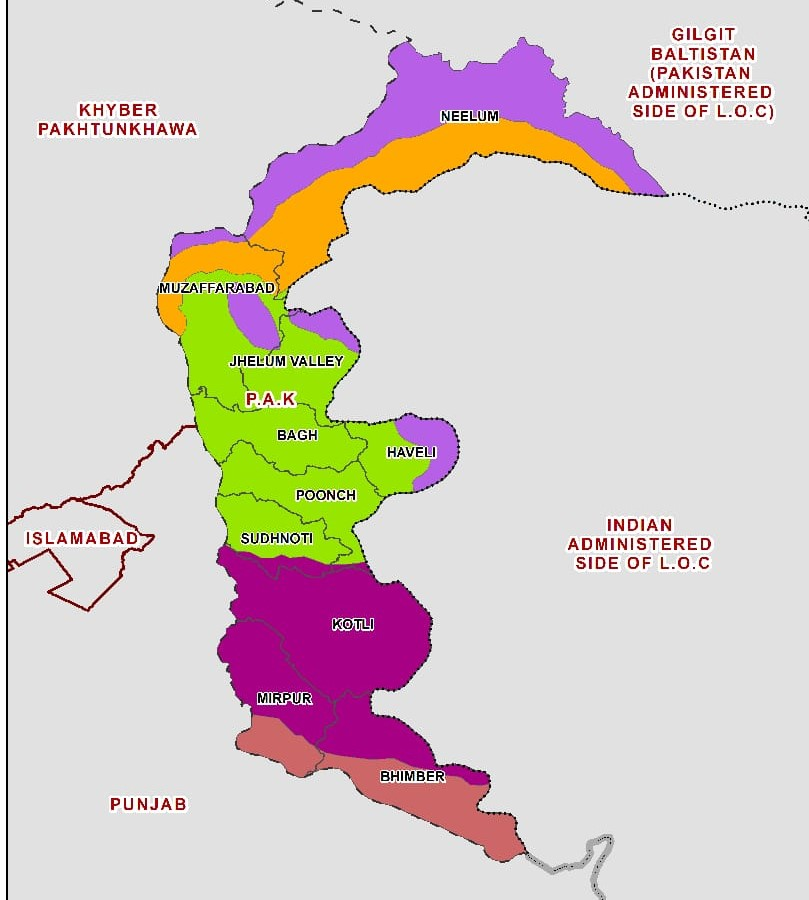
The selected language, that is Pahari, is mainly, spoken in Pakistan Administered Kashmir and has a large population who can perceive and speak this language. There are three major divisions; Poonch, Muzaffarabad, and Mirpur comprising ten sub-divisions/ districts with a population of 983831, 853250, and 539743 respectively. Several languages have been spoken in this area however; Hindko, Gojri, Pahari, Kashmiri, and Dogri are the most eminent ones. Figure 1 shows the map of areas where people speak these languages.
Pakistan-administered Kashmir is a linguistically diverse area with Pahari as a widely spoken language along with Kashmiri as the major Lingua franca of a vast diaspora. These languages belong to the Indo-Aryan family of languages. Pahari is spoken by over 4.5 million people of Pakistan Administered Kashmir and Murree Hills of Pakistan and Nepal (Khan, 2015). Khan (2015) claimed that there are 30 consonants, 12 oral and 5 nasal vowels in Pahari language with phonemically contrastive nasality and aspiration. Khan (2015) suggested that duration and lexical tone are also phonemic in Pahari with tone having three different types; high, mid, and low. In a survey, Baart (2004) declared that most of the languages spoken in South Asia, Afghanistan, India, and the northern region of Pakistan, are tonal.
Figure 1
Area of Study
The tone is a supra-segmental feature likewise stress. Primarily, tone refers to the contrastive use of pitch in grammar and lexicon, changing its position from level to level (Odden, 2011). In particular, tone consists of several related physical articulatory features applied to words. Duration, amplitude, and voice quality are used to determine the tone however; fundamental frequency f0 is the basic feature to understand tone. To decipher tone from among different languages background knowledge of tone inventory, tone rules, and tone-grammar boundaries helps the researchers to understand the tone phenomenon (Hyman, 2014). Tone languages are defined as “melodic features are an inherent aspect of the pronunciation of a word, just like the consonants and vowels. Such languages are called tone languages” (Baart, 2014). A tone language according to Hyman (2006) is “in which an indication of pitch enters into the lexical realization of at least some morphemes.”
van Lancker and Fromkin (1978) asserted that half of the world speaks tone languages including, Europe, Africa, and Asia. Silva (2006) pointed out that Korean languages have two levels of lexical tone; high and low. Similarly, Maddieson and Pang (1993) were of the view that Utsat has five levels of tone such as; high, mid, low, rising, and falling. Many West African languages are tone languages. Oden (1995) believes that Iqbo, Ekif, and Twi have high, low, and mid-tones. Similarly, Kikuyu Pari has high and low tones. Bwami has low, high, and super-high tones. Some of the African languages according to him, have 6 tones on a scale. Moreover, Cantonese is famous for its nine-tone system in Asia. Some other languages spoken in the same region such as Thai, Chinese, and Mandarin also have five-tone systems. Horny (2019) says that Pyen has three contrastive tones to express exclamation and emphasis.
In past, linguists and psychologists used conventional methods to evaluate speech perception. They provided answer sheets to their participants and played recordings. The consideration of speech perception as an example of general auditory categorization provides a means to understand how a system exhibits relative perceptual constancy in the face of acoustic variability and does so in a native-language-specific manner (Lotto & Holt, 2010).
Chen et al. (2014) examined sentence intelligibility in Mandarin Chinese. Participants were given an answer sheet to choose the right answer. They asserted that listeners could perceive more accurately in silence and less accurately in noise. In a study, Francis and Ciocca (2003) tested tone perception in Cantonese Chinese with a conventional perception test where they recorded native speakers of Cantonese. The recordings were played and participants were asked to encircle the right option on the answer sheet provided by the researcher. The results showed that the order of tone was important to be recognized; therefore, only native Cantonese speakers could recognize tones with slight confusion regarding tone 2 and tone 3. In another study, Repp and Lin (1990) also tested perception in Mandarin and English with the help of a paper-based test and recorded the data. They concluded that the participants with Mandarin as their native language perceived both, tone and segments quite easily whereas, the English-speaking monolinguals could recognize segments only.
The perception of tone attained significant attention when Burnham and Francis (1997) investigated Thai tone recognition in Thai and English speakers. The participants were provided with minimal pairs and were asked to identify their tone. The speakers of non-tone language also perceived the tone however; could not recognize at what scale it lies. On the other hand, Thai speakers perceived tone easily, resultantly, they claimed that to recognize the tone and its type a relevant linguistic experience plays a vital role. Similarly, the Cantonese tone perception was investigated by Sjerps et al. (2018) and they agreed on the importance of context in recognizing the tone. The subjects were given an answer sheet and recorded tone data was played in a noise-proof classroom. The results describe that the preceding context helps the listeners to recognize lexical tone in the Cantonese language.
Shahi and Shitaula (2021) overviewed the use of machine learning and deep learning algorithms in the Nepali language to determine the usability and effectiveness of such algorithms and collected a set of research papers exhibiting such algorithms. They agreed upon the notion that deep learning and AI has potential scopes for more research in Nepali language. Apart from that, Sandhu and Singh (2020) studied Indian languages and reviewed quite a large number of research articles. In their version, the results of conventional methodologies applied to text perception and machine-based techniques to test recognition rate and concluded that there is a lot of margin in research in the area of simulation of human languages and machines. On the other hand, Kaur et al. (2020) surveyed tone languages and overviewed the existing literature. They determined that automatic tone recognition has widely been explored in Thai, Chinese, Mandarin, and Vietnamese however; there is less significant work observed in Punjabi, Lithuanian, Swedish, and African tonal languages. According to Spille et al. (2018), the automatic speech perception system is successfully used to predict speech, with more reliable results, and more reference-free means to predict speech perception.
Peng and Wang (2005) calculated the accuracy of the recognition rate of Cantonese language. A corpus was built by recording native Cantonese speakers. In order to test the accuracy a support vector machine model was built and the results showed that the accuracy of the model was 71.5%. Although in recent years, in the field of language research, the application of machine learning algorithms has been significantly increasing one cannot overlook the attempts of Chen et al. (1987). They made the first serious effort to test automatic tone recognition in Standard Chinese. In this research, two groups of listeners were selected and tested for tone perception. An HMM has been built to check the accuracy of tone recognition. The results showed that Chinese-speaking monolinguals' model accuracy was 98% whereas, the research group comprising multi-linguals from other languages showed an accuracy of 96%. Another neighbouring language, Thai is also a tone language and is studied for its unique five-level tones. Thubthong et al. (2002) explored Thai tone perception and built a neural network model. The Thai bilinguals were recorded by the researchers and f0 contours were used to test and train the model. Resultantly, the model accuracy was calculated and Thai speakers' tone recognition accuracy rate was calculated 98%.
Apart from testing tone recognition, machine learning algorithms were also used to determine dialect recognition in the Chinese language. Mingliang and Yuguo (2008) investigated dialect recognition and built Clustered Support Vector Machine model and Support Vector Machine model. The results demonstrated that the former had an accuracy of 98% and performed better. On the other hand, the accuracy of the Support Vector Machine was 91%. In addition to that, Korean tone recognition was also rated by Chung (2002), who explored a perceptual evaluation of spoken Korean where he tested a large corpus and built a CARTS model and additive multiplicative models. The findings determined that the CARTS model's accuracy was higher than that of additive multiplicative models, which meant that more supervised models performed better in different conditions.
India is a diverse country in terms of languages, ethnicities and cultures. Most of the languages spoken here are tone languages and Punjabi is one of them. Kumar and Singh (2017) tested tone perception in Punjabi language and built a Hidden Markov Model and Dynamic Time Wrap. The data were recorded and f0 contours were extracted with the help of PRAAT. The results showed that the accuracy of DTW was 91% and the accuracy of HMM was 94%. This demonstrates that the HMM is better in performance in recognizing Punjabi tones. Moreover, Indian languages have different varieties and dialects. From among these verities and dialects, Gogoi et al. (2020) explored the tone recognition rate in three different dialects of the Ao language spoken in India and suggested that machine learning techniques are useful in analyzing the perception and testing the tone recognition rate. Firstly, they built a Linear Mixed Model and tested the data in chi-square where the degree of freedom x2 and p values were calculated. Later, they trained and tested the data in SVM and it was concluded that AI is an effective tool to analyze automatic recognition rates in three different dialects of Ao. The results claimed that the accuracy rate for tone perception in three different dialects was calculated 53%, 62%, and 52% respectively.
Apart from the aforementioned languages, Chinese is the most versatile language in the world. It also has numerous varieties and dialects. Moreover, it has been extensively studied by researchers, and as a result, most researchers believe that Chinese and its verities have five-level tones (Chao, 1930). Following the footsteps of Chao (1930), Chen and Xu (2020) claimed that intermediate features are not key features to recognize the tone. The participants were recorded and f0 values calculated for each participant. The f0 values were then used to train and test SVM to check the automatic recognition rate in Mandarin Chinese tones. SVM showed an accuracy of 95% which shows that the technique is quite useful and the results are significant.
Not only linguists but researchers from other fields such as computer science, psychology, and mathematics also studied tone perception and tested different computational models. Chen et al. (2022) tested a computational model in Mandarin, spoken in China where they compared Support Vector Machine (SVM) and Self Operating Map (SOM) to rate automatic tone recognition by simulating the tone with speaker-dependent context and speaker-independent context separately. They suggested that SVM is more efficient in recognizing tone as compared to SOM. Peng and Wang (2005) devised a model in Cantonese language for tone recognition purposes and asserted the effectiveness of such deep learning techniques while conducting research of linguistics.
Khan et al. (2020), Rashid (2015), Bashir et al. (2019), Khan and Bukhari (2015), and many other researchers studied the phonology of local languages in detail and declared them tone languages as these languages have three discrete level lexical tones. In a study conducted on old citizens with hearing problems Moulin et al. (2017) suggested that to achieve a reliable result, the list should be tested on participants at least five times, the repetition of tests, therefore, could become tiring, tedious, and irritating for the listeners and subsequently, may yield higher variability in performance. Therefore, the use of an automatic speech intelligibility system could overcome such shortcomings. Recently, a few researchers experimented with artificial intelligence and machine learning techniques to test automatic speech recognition rates and successfully achieved their objectives. The present study attempted to calculate the tone recognition rate in Pahari, spoken in Pakistan administered State of Jammu and Kashmir. As Pahari is undocumented, under-resourced, and endangered languages, therefore, any significant work done in the perspective of tone or perception either by testing the tone recognition rate on human participants with an answer sheet or by applying artificial intelligence and deep learning techniques has not been done so far. As it is necessary to adopt more scientific data analysis techniques to find more objective and less biased results, therefore, the study is the first effort of its kind to test data in the Random Forest and the Linear Mixed Effects model in R (4.2.0)
A mixed-method approach was used to analyze the data. Initially, a quantitative analysis of data was conducted, and later, the findings and results were discussed and interpreted qualitatively. Since, f0 alone is sufficient to convey tonal contrast in recognition; therefore, the average f0 values were processed with the help of a tone perception task in Pahari language in a given environment to test the automatic recognition rate. A machine learning algorithm, the random forest was applied to process the Pahari tone from a corpus of 45 utterances. Unfortunately, there was no database comprising of Pahari spoken corpus, therefore, data were recorded by keeping target words in view.
All the native speakers of Pahari language, residing in Pakistan Administered Jammu and Kashmir are the population for this study.
A convenient sampling technique was adopted to select the sample for the research. A group of 5 male native speakers of Pahari language were selected randomly. Since, the experiments were speaker-independent; therefore, participants are selected from one gender only for training and testing purposes. A stimulus of one string of contrastive words has been given to them for data-gathering purposes.
The selected participants were provided with a list of items comprising target tones and were asked to utter the target words in isolation. They were recorded with the help of a high-quality Zoom-6 digital voice recorder and an externally attached microphone.
The theoretical framework of the current study was conceptualized on the post-positivist approach that had been introduced by theorists to support qualitative analysis, based on quantitative data and data analysis. Creswell (2007) provided a detailed overview of post-positivist approaches. The post-positivists view reality as a set of logically related steps, believe in multiple perspectives taken from participants rather than one reality, use multiple levels of data analysis with a computer-assisted analysis. Moreover, they also encourage validity approaches, and write their reports in the form of scientific reports. The example of the post-positivist approach mentioned in Corbin and Strauss (2008, 2015) has been taken to explain findings qualitatively. Gogoi et al. (2020) proposed the Linear Mixed Effects models in their research, to study tone recognition rate and proposed a model for other languages using R. As mentioned in the literature, different machine learning algorithms have been calculated in speech perception and tone perception; therefore, following the previous research in the field, a random forest predictive model has been built to classify three different tones. Since, the language selected for this research belongs to the same language family; therefore, the objectives of the study are quite relevant to the research conducted in other languages. It is to be explored how the tone of Pahari is perceived by machines.
Recognition models were built to perceive Pahari language. For a group of participants, in order to learn about the tone of language, the Random Forest was applied to classify the categories of tone and variable importance to explore the effectiveness of variables in a hierarchy. To test the efficiency of the algorithm the researcher compared the results of both training and testing data. In the current study, the data were normalized first, later, the statistical analysis was conducted using the lme4 package in R (4.2.0) where with each dependent variable a separate Linear Mixed Effects Model has also been built by keeping the tone as a fixed effect, gender, and subjects as random effects and average f0, final f0, F1 and F3 as dependent variables.
The group of students was selected from the University of Poonch Rawalakot, the main campus. All the participants were multilingual and spoke regional languages at their homes. They were first tested for hearing disorders if any. To conduct the test, Pahari tone data were recorded with the help of a high-quality Zoom-6 digital voice recorder. The data were recorded in a noise-proof video conference room. Afterwards, the boundaries were marked and tone-bearing units were annotated and glossed in PRAAT (6.1.37). The Random Forest algorithm was trained and tested with the help of raw F0 values. To undertake the test, the raw average f0, F1, F3, CPP, duration, intensity, and final f0 contours have been extracted with the help of PRAAT (6.1.37). The tone-bearing units (TBUs) were annotated in PRAAT (6.1.37) in isolation. For further analysis, the data were normalized with normalized function in R (4.2.0). Furthermore, data were classified and linearly separated with the help of Random Forest. The p values were extracted in Linear Mixed Effects Models and were also tabulated along with standard deviation and mean values. Models were tested and cross-validated by keeping the seed set at 100 to ensure the validity of the model. Initially, the recordings were analyzed separately and then collectively to see if there is any effect of the speaker on the results.
A classification decision tree was built in R (4.2.0) which suggested that final f0 was the most relevant feature of tone-bearing units to predict a classification tree. Final f0 and mean f0 were significantly affected by the tone of three segmentally identical words with the accuracy of the model as 92.01%, ranging from 81% to 93%, and a p<0.005. Figure 3 shows dimensions 1 and dimension 2 with an equal number of utterances for all three tones. Similarly, in test data, the prediction of tones is also high. In the training data, the OOB rate was 11.24% which is not very high. In a study, Palczewska et al. (2013) tested random forest on the data collected from breast cancer patients and suggested that the random forest predicted the features with an accuracy of 96% which is quite substantial.
The test described the automatic tone recognition of Pahari language with the help of Random Forest model, used for the classification of three lexically different tone words uttered by 5 speakers and recorded in Zoom H-6 digital voice recorder. From Pahari language, data set a total of 45 utterances were split into two subgroups naming; training data and testing data. A set of 33 utterances was selected to train the model and 12 were used to test the model. Preliminary precautions were taken under consideration by keeping the number of speakers and the number of utterances uniform for the current study. The number of utterances recorded and tested for tone in Pahari language, were kept uniform for all three tones (low mid and high), however, the recognition accuracy was 96% in LME models. As far as the Random Forest model is concerned, it predicted more values and the accuracy rate was also at a high rate with 100% with the same raw data. Table 4 shows the prediction of tones denoted as, 1, 2, and 3, where -1 indicates the terminal node and left and right daughters are 0 for accurately predicted items. Figure 8 shows that the final f0 is highly affected by the tone and plays a vital role in the prediction model. The minimally contrastive set of words in the form of triplets and minimal pairs in the following table shows that on each row, the tone is the only distinguishable feature among the words. Words in each line have the same consonant and vowel sounds but each word has different meanings.
Table 1
Three-way Contrast in Pahari
|
Word |
Transcription |
Gloss |
Pitch |
|
Paa |
/ pà:/ |
Animal dung |
Low |
|
Paa |
/ pá: / |
Rate |
High |
|
Paa |
/ pā: / |
quarter |
Mid |
In the first place, data were analyzed in PRAAT (6.1.37) where all f0 contours were extracted for each participant. Firstly, the recordings were edited and viewed; the words were segmented and annotated in PRAAT (6.1.37). Canonical f0 patterns were derived for the tones in Pahari, and a set of three mono-syllabic words were taken into account, where each word was produced by 4 different speakers; two male and two female.
The following spectrogram, annotated and segmented in PRAAT (6.1.37), shows high, mid, and low tones as pitch contours in Pahari. Three of the segmentally identical words were glossed and transcribed in the spectrogram showing three contrastive tones in Pahari at a lexical level.
Figure 2
A PRAAT Picture Window of Segmentally Identical Tone Words Uttered by A Male Speaker
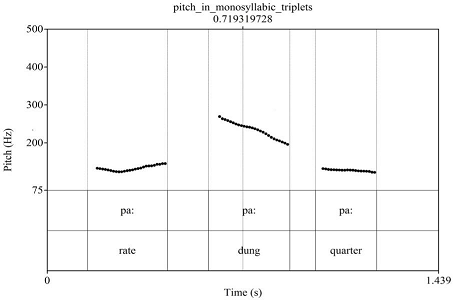
Khan (2017) concludes that after considering the acoustic and statistical analyses, it can be concluded that Pahari has three lexical tones that are primarily distinguished by the height and direction/shape of the pitch tracks, as shown in figure 2.
Statistical modelling is the process of applying statistical analysis to a dataset. A statistical model is a mathematical representation of observed data. Two statistical models were applied to the dataset to test the accuracy rate of automatic tone recognition.
A classification tree has been drawn in R (4.2.0) by using the randomForest package in the Random Forest algorithm. The rationale behind the selection of Random Forest is that it avoids over-fitting and can deal with a large number of features. Moreover, it helps with feature selection based on importance. It is user-friendly and can be easily interpreted by a non-technical data analyst. It follows three steps, starting from ntree bootstrap sampling, moving to the selection of the best split, and finally predicting new data using majority voting for classification (Paul et al., 2018). The overall accuracy of the random forest model is 100%.
Table 3
Prediction Model in Random Forest Before Splitting Data into Two Sets
|
1 |
2 |
3 |
Class. Error |
|
|
1 |
4 |
0 |
0 |
0.12 |
|
2 |
0 |
5 |
0 |
0.14 |
|
3 |
0 |
0 |
5 |
0.11 |
In Table 3, for the training data, the first prediction tells that the model predicted 31 observations, and 27 were correctly predicted for class 1. Similarly, in class 2 prediction the model predicted 28, out of which 24 were accurate, and for class 3 out of 35 observations, 31 were predicted accurately.
Table 4
The Final Nodes of Decision Trees in Random Forest
|
Left daughter |
Right daughter |
Split var |
Split point |
Status |
Prediction |
|
|
7 |
0 |
0 |
<NA> |
0 |
-1 |
1 |
|
11 |
0 |
0 |
<NA> |
0 |
-1 |
1 |
|
14 |
0 |
0 |
<NA> |
0 |
-1 |
3 |
|
15 |
0 |
0 |
<NA> |
0 |
-1 |
2 |
|
17 |
0 |
0 |
<NA> |
0 |
-1 |
3 |
|
20 |
0 |
0 |
<NA> |
0 |
-1 |
2 |
|
22 |
0 |
0 |
<NA> |
0 |
-1 |
2 |
|
23 |
0 |
0 |
<NA> |
0 |
-1 |
3 |
|
24 |
0 |
0 |
<NA> |
0 |
-1 |
2 |
|
25 |
0 |
0 |
<NA> |
0 |
-1 |
1 |
|
26 |
0 |
0 |
<NA> |
0 |
-1 |
2 |
|
27 |
0 |
0 |
<NA> |
0 |
-1 |
1 |
|
28 |
0 |
0 |
<NA> |
0 |
-1 |
2 |
|
29 |
0 |
0 |
<NA> |
0 |
-1 |
3 |
|
30 |
0 |
0 |
<NA> |
0 |
-1 |
1 |
|
31 |
0 |
0 |
<NA> |
0 |
-1 |
2 |
Table 4 shows details of the tree with status marked as 1 and -1 where -1 shows the terminal nodes and the corresponding prediction values like 1, 2, and 3. For terminal nodes, the values for right and left daughters are always 0.
Table 5
Confusion Matrix
|
High |
low |
Mid |
|
|
High |
5 |
0 |
0 |
|
Low |
1 |
2 |
0 |
|
Mid |
0 |
2 |
2 |
Figure 3
Error Rate in Random Forest Model
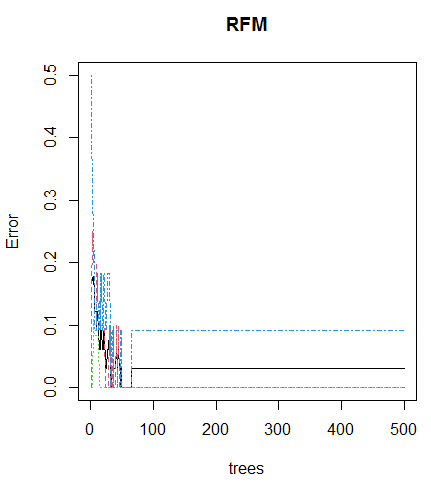
In Table 5 the confusion matrix shows the better output for test data. The model predicted 5, 2, and 2 observations accurately for class 1, class 2, and class 3 respectively. While taking intensity as a variable the model accuracy is 0.75% with the confusion matrix as
The out-of-bag error drops down initially and after 70 it remains constant with a flattened curve. The number of observations can be changed to avoid this error.
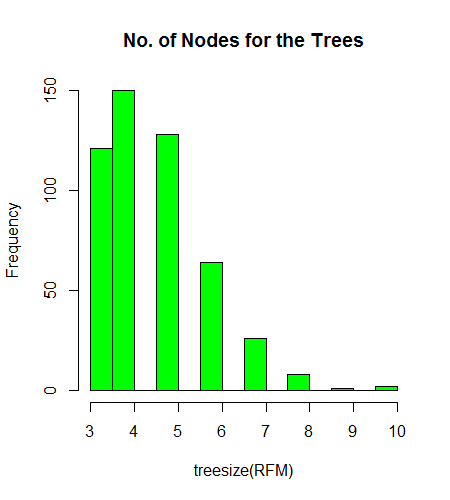
Figure 4 shows the distribution of the number of nodes in each observation and the tallest bar is around 30, similarly, some observations have a range of 25 to 30 in the model. The dataset for Pahari tone is small, consequently, it is difficult to get a reliable result for these datasets using the stand-alone classifier. On the contrary, a Random Forest is an ensemble of classifiers. Each tree acts as a weak classifier. Each tree is grown using separate bootstrap samples drawn from the training data. Hence every tree finds different decision boundaries and produces different classification results on test data. The final classification decision is taken based on majority voting or averaging of outputs of the ensemble of weak classifiers.
Figure 4
The Tree Nodes for Pahari Tone in Random Forest
The accuracy of the model deploying mean duration as a variable is 91.66 % with the confusion matrix as;
Table 6
Confusion Matrix
|
High |
low |
Mid |
|
|
High |
5 |
0 |
0 |
|
Low |
0 |
3 |
0 |
|
Mid |
0 |
0 |
3 |
Table 7
Confusion Matrix with An Accuracy of The Model with Final F0 Is 0.91%;
|
High |
low |
Mid |
|
|
High |
5 |
0 |
0 |
|
Low |
0 |
2 |
1 |
|
Mid |
0 |
0 |
4 |
Figure 5
Variable Importance in Random Forest
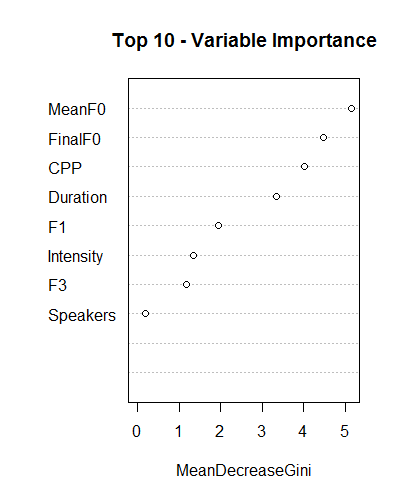
Figure 5 shows that mean f0 has been highly influenced by the tone and final f0 has also been affected by the tone of the word. On the other hand subject and gender being at the bottom, are least affected by tone. We do not know which and how many features are important. So, we take a novel strategy to find the important features. Initially, from the ranked list, we mark the top six features as ‘important’ and the rest of the features as ‘unimportant’. The mean f0 is the bag of important features and the duration is the bag of unimportant features. These bags of features are updated at every construction pass. In addition to high predictive performance, random forest classifiers can reveal feature importance (Cohen et al., 2018), telling us how much each feature contributes to class prediction (as displayed in Figure 5). As for as the use of random forest in linguistics is concerned, there are no traces of such machine learning algorithms used by linguists but researchers in the field of medical science such as de Vos et al. (2016), Tong et al. (2017) and Altaf et al. (2018) used this technique to explore the disease rate and classification of neural disease.
Table 8
Confusion Matrix
|
High |
low |
Mid |
|
|
High |
5 |
0 |
0 |
|
Low |
0 |
3 |
0 |
|
Mid |
1 |
0 |
3 |
In contrast with Random Forest, the LME models also allow a systematic approach to incorporate both fixed-effect and random-effect terms to deal with the categorical grouping factor of listening conditions, between-subject baseline differences in the multiple measures, and the correlational structure among the predictor variables (Koerner & Zhang, 2017). For the testing purpose, to avoid any ambiguity the f0 contours of Pahari were normalized first in R by using normalize function. To carry out the statistical analysis lmer package has been used in R (4.2.0), where a Linear Mixed Effect Model was built with mean f0, final f0, F1, and F3, as dependent variables and tone as a fixed effect, and gender and subject as random effects. The p values, mean, standard error, and correlation were calculated in R. Data analysis using mixed-effects regression models allowed for the examination of how multiple variables predict an outcome measure of interest beyond what a simple multiple regression model can handle (McElearth, 2020).
Table 9
Results of Analysis of Deviance for Four LME Models
|
Variable |
df |
χ2 |
p-value |
|
Average F0 |
2 |
199.6 |
< 0.05 |
|
Final F0 |
2 |
119.6 |
< 0.05 |
|
F1 |
1 |
201.02 |
< 0.05 |
|
F3 |
1 |
189.67 |
< 0.05 |
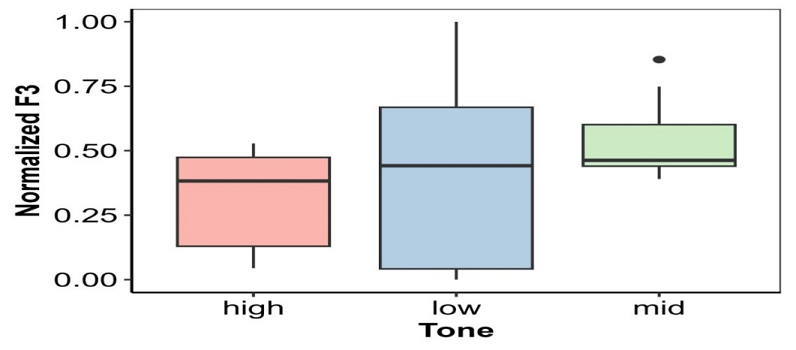
Figure 6
Normalized F3
LME models are called mixed because they simultaneously model fixed and random effects. The fixed effects represent population-level effects that should persist across the experiments, whereas, the random effects tend to vary across different experiments. Here, in this study, in the LME the effect of tone on the final f0 of the word is estimated while keeping the following equation under consideration;
Final f0~tone+ɛ
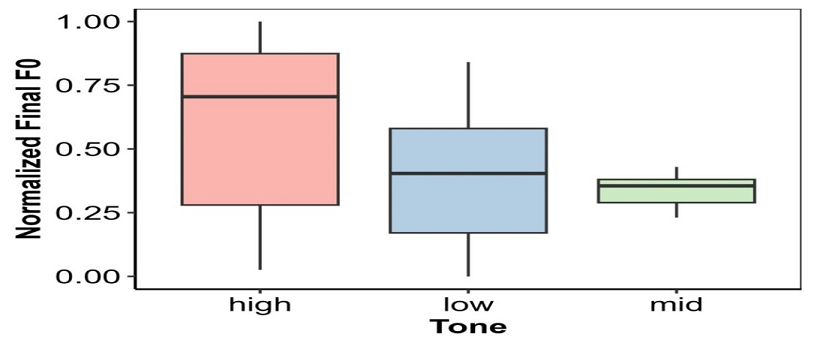
Figure 7
The Boxplot for Final f0
Cahana-Amitay et al. (2016) say that the use of mixed-effects (or multilevel) models has recently captured attention in longitudinal medical research, behavioural and social sciences research (including speech and hearing research), and neurophysiological and neuroimaging research. Its increasing popularity is shown in the exponential growth over the last three decades in the number of publications in scientific literature. The model.1 in R (4.2.0) shows significant effect of tone on initial f0. The table below shows the figures produced by the lmer package. Individual observation is plotted in Figure 9, where it can be visualized that the average f0 for the female is higher which is natural to human speech.
Mean f0~tone+ɛ
Figure 7 shows the LME model for Pahari tone with 1, 2, and 3 as tone and 1 and 2 as female and male respectively. Here, on the x-axis, the boxplots show 1, 2, and 3 as classes of the tone and 1 and 2 as female and male respectively with a final f0 on the y-axis. For females, the final f0 is higher and for tones, the high tone is higher than the mid and low tones.
Figure 8
Normalized F0 Across Three Tones
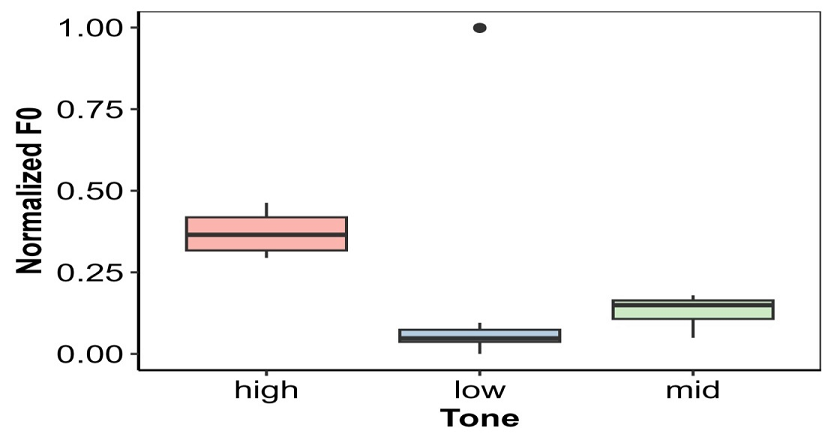
In Figure 8 LME regression analyses were able to account for the covariance structure and grouping factors for the repeated measures. Tests of significance from the LME models examined whether each predictor variable or fixed effect, was significantly different from zero while taking into account the other fixed or random effects in the model. The individual observation shows that there is a significant effect of tone mean f0 in most observations but in a few observations there is no significant effect on final f0. Table 9 shows that for gender as fixed effect t=0.000 it did not calculate p values at this stage.
Table 10
t Value of Fixed Effects in LME
|
Estimated |
Std. Error |
t value |
|
|
(Intercept) |
2.000e+00 |
2.219e-01 |
9.023 |
|
tone |
-1.726e-15 |
1.423e-01 |
0.000 |
Figure 9
Boxplot for F1
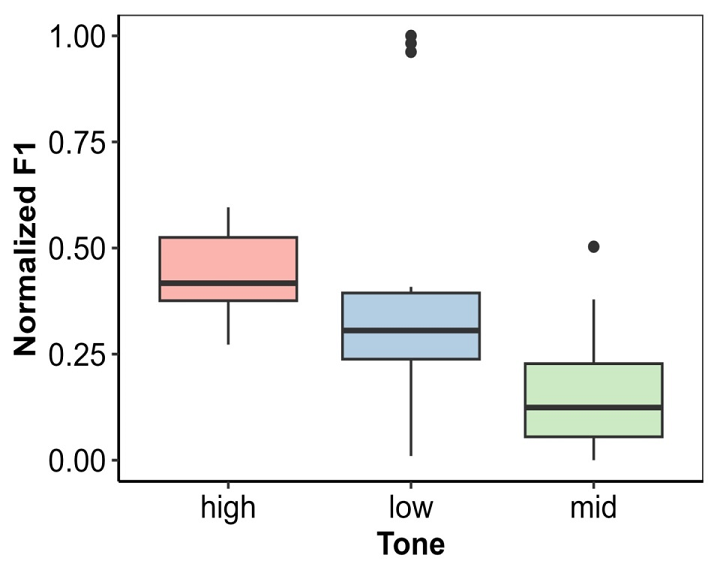
This work presents a Random Forest and LME models-based tone detection system for Pahari. The motivation for this work is to explore the existing acoustic features in Pahari tone recognition system and to study its effectiveness in the language. The random forest-based system is designed to discriminate three lexical tones of Pahari, namely, High, Mid, and Low. It is considered that tone distribution in monosyllabic words, which are collected from 4 speakers, duration, intensity and CPP, F1, F3, and F0 contour is derived using PRAAT, and six acoustic features are computed from the syllable. For each feature, a separate random forest-based tone recognition model is developed. Results show that the overall recognition accuracies are 100% in Random Forest with testing all variables simultaneously while; the accuracy rate is around 92% when individual variables are tested separately. A Linear Mixed Effect model has also been built with random and fixed effects to test the accuracy rate in Pahari. The results depict that F1, F3, mean f0 and final F0, are affected by the tone of the word in different ways.
In the future, we plan to exploit the spectral features further for more robust tone recognition in Pahari. Pahari corpus will be strengthened by incorporating more speakers’ data and an increased number of total words. This study shows the recognition in a specific way. Therefore, future work is planned to develop a dialect-dependent tone recognition system for Pahari. Also, there is tonal co-articulation in the monosyllabic word, such that the tone from the previous or the following syllable can affect the realization of the target tone. Such studies are not present in the Pahari language. Future work will be framed in this direction to study whether this affects the classification accuracy of the model as well.
Alan, C. L. (2010). Tonal effects on perceived vowel duration. In C. Fougeron, B. Kuehnert, M. D. Imperio & N. Vallee (Eds.), Laboratory phonology (pp. 151–168). De Gruyter Mouton. https://doi.org/10.1515/9783110224917
Altaf, T., Anwar, S. M., Gul, N., Majeed, M. N., & Majid, M. (2018). Multi-class Alzheimer's disease classification using image and clinical features. Biomedical Signal Processing and Control, 43, 64–74. https://doi.org/10.1016/j.bspc.2018.02.019
Baart, J. L. G. (2004). Tone and song in Kalam Kohistani (pakistan).LOT Occasional Series,2, 5–15.
Baart, J. L. G. (2014). Tone and stress in north‐west Indo‐Aryan.In Above and beyond the segments: Experimental linguistics and Phonetics. John Benjamins.
Bashir, E., & Conners, T. J. (2019). Linguistic context. In E. Bashir & T. J. Conners (Ed.), A descriptive grammar of Hindko, Panjabi, and Saraiki (Vol. 4, pp. 9–18). De Gruyter Mouton. https://doi.org /10.1515/9781614512257
Burnham, D., & Francis, E. (1997). The role of linguistic experience in the perception of Thai tones. In A. S. Abramson (Ed.), South east asian linguistic studies in honour of Vichin Panupong (pp. 29–47). Chulalongkorn University Press.
Cahana-Amitay, D., Spiro III, A., Sayers, J. T., Oveis, A. C., Higby, E., Ojo, E. A., Duncane, S., Gorala, M., Hyuna, J., Albert, M. L., & Obler, L. K. (2016). How older adults use cognition in sentence-final word recognition. Aging, Neuropsychology, and Cognition, 23(4), 418–444. https://doi.org/10.1080/13825585.2015.1111291
Chao, Y. R. (1930). A system of tone letters. Le Maître Phonétique, 45, 24–27.
Chen, F., Wong, L. L., & Hu, Y. (2014). Effects of lexical tone contour on Mandarin sentence intelligibility. Journal of Speech, Language, and Hearing Research, 57(1), 338–345. https://doi.org/10.1044/1092-4388(2013/12-0324)
Chen, X. X., Cai, C. N., Guo, P., & Sun, Y. (1987, Apri 6–9). A hidden Markov model applied to Chinese four-tone recognition (Paper presentation). ICASSP'87. IEEE International Conference on Acoustics, Speech, and Signal Processing. Dallas, USA. http//doi/org/10. 1109/ICASSP.1987.1169595
Chen, Y., & Xu, Y. (2020, May 25–28). Intermediate features are not useful for tone perception [Paper presentation]. 10th International Conference on Speech Prosody. Tokyo, Japan. https://doi.org/10.21437/SpeechProsody.2020-105
Chen, Y., Gao, Y., & Xu, Y. (2022). Computational modelling of tone perception based on direct processing of f 0 contours. Brain Sciences, 12(3), Article e337. https://doi.org/10.3390/brainsci12030337
Chung, H. (2002, April 11–13). Duration models and the perceptual evaluation of spoken Korean [Paper presentation]. Speech Prosody 2002, International Conference. Aix-en-Provence, France. https://www.worldcat.org/title/speech-prosody-2002-proceedings-of-the-1st-international-conference-on-speech-prosody-aix-en-provence-france-11-13-april-2002/oclc/728728734
Cohen, J. D., Li, L., Wang, Y., Thoburn, C., Afsari, B., Danilova, L., Douville, C., Wong, F., Mattox, A., Hruban, R. H., Wolfgang, C. L., Goggins, M. G., Molin, M. D., Wang, T-L., Roden, R., Klein, A. P., Ptak, J., Dobbyn, L., Schaefer, J.,…Papadopoulos, N. (2018). Detection and localization of surgically resectable cancers with a multi-analyte blood test. Science, 359(6378), 926–930. https://doi.org/10.1126 /science.aar3247
Cooper, F. S., Delattre, P. C., Liberman, A. M., Borst, J. M., & Gerstman, L. J. (1952). Some experiments on the perception of synthetic speech sounds. The Journal of the Acoustical Society of America, 24(6), 597–606. https://doi.org/10.1121/1.1906940
Corbin, J., & Strauss, A. (2008). Basics of qualitative research: Grounded theory procedures and techniques (3rd ed.). Sage Publisction.
Corbin, J., & Strauss, A. (2015). Basics of qualitative research: Grounded theory procedures and techniques (3rd ed.). Sage Publication.
Creswell, J. W. (2007). Qualitative inquiry& research design choosing among five approaches (2nd ed.). Sage Publications.
de Vos, F., Schouten, T. M., Hafkemeijer, A., Dopper, E. G., van Swieten, J. C., de Rooij, M., & Rombouts, S. A. (2016). Combining multiple anatomical MRI measures improves Alzheimer's disease classification. Human Brain Mapping, 37(5), 1920–1929. https://doi.org/10. 1002/hbm.23147
Eimas, P. D., Siqueland, E. R., Jusczyk, P., & Vigorito, J. (1971). Speech perception in infants.Science,171(3968), 303–306. https://doi.org/10. 1126/science.171.3968.303
Francis, A. L., & Ciocca, V. (2003). Stimulus presentation order and the perception of lexical tones in Cantonese. The Journal of the Acoustical Society of America, 114(3), 1611–1621. https://doi.org/10. 1121/1.1603231
Gogoi, P., Tzudir, M., Sarmah, P., & Prasanna, S. R. M. (2020, May 25–28). Automatic tone recognition of ao language (Paper presentation).10th International Conference on Speech Prosody 2020. Tokyo, Japan.
Halle, M., & Chomsky, N. (1968). The sound pattern of English. Harper & Row.
Holt, L. L., & Lotto, A. J. (2010). Speech perception as categorization. Attention, Perception, & Psychophysics, 72(5), 1218–1227. https://doi.org/10.3758/APP.72.5.1218
Horny, C. S. (2019). Tonal variation in Pyen. Journal of the Southeast Asian Linguistics Society, 12(1), 12–24. http://hdl.handle.net /10524/52442
Hyman, L. M. (2014). How to study a tone language. Language Documentation & Conservation, 8, 525–562.
Hyman, L. M. (2006). Word-prosodic typology. Phonology, 23(2), 225–257. https://doi.org/10.1017/S0952675706000893
Jakobson, R., & Halle, M. (1968). Phonology in relation to phonetics. North-Holland Publishing Company.
Jakobson, R., Fant, C. G., & Halle, M. (1951). Preliminaries to speech analysis: The distinctive features and their correlates. The MIT Press.
Kaur, J., Singh, A., & Kadyan, V. (2020). Automatic speech recognition system for tonal languages: State-of-the-art survey. Archives of Computational Methods in Engineering, 28(3), 1039–1068. 10.1007/s11831-020-09414-4
Khan, A. Q. (2017). The tonal system of Pahari. Acta Linguistica Academica, 64(2), 313–324. https://doi.org/10.1556/2062.2017.64.2.7
Khan, A. Q., & Bukhari, N. H. (2015). Lexical stress placement in monomorphemic words in Pahari. Acta Linguistica, 9(1), 51–62.
Khan, A. Q., Xu, Y., & Sohail, A. (2020). Multidimensionality of tone in Pahari. Lingua, 245, Article e102923. https://doi.org/10.1016 /j.lingua.2020.102923
Kingston, J., & Diehl, R. L. (1995). Intermediate properties in the perception of distinctive feature values. In B. Connell & A. Arvaniti (Eds.), Papers in laboratory phonology (pp. 7–27). Cambridge University Press. https://doi.org/10.1017/CBO9780511554315.002
Koerner, T. K., & Zhang, Y. (2017). Application of linear mixed-effects models in human neuroscience research: a comparison with Pearson correlation in two auditory electrophysiology studies. Brain sciences, 7(3), Article e26. https://doi.org/10.3390/brainsci7030026
Kumar, Y., & Singh, N. (2017). An automatic speech recognition system for spontaneous punjabi speech corpus. International Journal of Speech Technology, 20(2), 297–303. https://doi.org/10.1007/s10772-017-9408-2
Liberman, A. M., Harris, K. S., Hoffman, H. S., & Griffith, B. C. (1957). The discrimination of speech sounds within and across phoneme boundaries: Erratum. Journal of Experimental Psychology, 54(5), 358–368. https://doi.org/10.1037/h0044417
Lotto, A. J., Hickok, G. S., & Holt, L. L. (2009). Reflections on mirror neurons and speech perception. Trends in Cognitive Sciences, 13(3), 110–114. https://doi.org/10.1016/j.tics.2008.11.008
Maddieson, I., & Pang, K.-F. (1993). The tone in Utsat. Oceanic Linguistics Special Publications, 24, 75–89.
McElreath, R. (2020). Statistical rethinking: A bayesian course with examples in R and Stan (2nd ed.). Chapman and Hall/CRC. https://doi.org/10.1201/9780429029608
Mingliang, G., & Yuguo, X. (2008, June 7–11). Chinese dialect identification using clustered support vector machine (Paper presentation). International Conference on Neural Networks and Signal Processing. Nanjing, China. https://doi.org/10.1109/ ICNNSP.2008.4590380
Moulin, A., Bernard, A., Tordella, L., Vergne, J., Gisbert, A., Martin, C., & Richard, C. (2017). Variability of word discrimination scores in clinical practice and consequences on their sensitivity to hearing loss. European Archives of Oto-Rhino-Laryngology, 274(5), 2117–2124. https://doi.org /10.1007/s00405-016-4439-x
Odden, D. (1995). Tone: African languages. In J. A. Goldsmith (Ed.), The handbook of phonological theory (pp. 444–475). Blackwell.
Odden, D. (2011). Features impinging on tone. In J. A. Goldsmith, E. Hume & L. Wetzels (Eds.), Tones and features: Phonetic and phonological perspectives (pp. 81–107). De Gruyter Mouton. https://doi.org/ 10.1515/9783110246223
Palczewska, A., Palczewski, J., Robinson, R. M., & Neagu, D. (2014). Interpreting random forest classification models using a feature contribution method. In T. Bouabana-Tebibel & S. Rubin (Eds.), Integration of reusable systems. Springer. https://doi.org/10.1007/978-3-319-04717-1_9
Paul, A., Mukherjee, D. P., Das, P., Gangopadhyay, A., Chintha, A. R., & Kundu, S. (2018). Improved random forest for classification. IEEE Transactions on Image Processing, 27(8), 4012–4024. https://doi.org/ 10.1109/TIP.2018.2834830
Peng, G., & Wang, W. S. Y. (2005). Tone recognition of continuous cantonese speech based on support vector machines. Speech Communication, 45(1), 49–62. https://doi.org/10.1016/j.specom. 2004.09.004
Pike, K. L. (1948). Tone languages; A technique for determining the number and type of pitch contrasts in a language, with studies in tonemic substitution and fusion. University of Michigan.
Rashid, H. U. (2015). Syllabification And stress patterns in Hindko [Unpublished doctoral dissertation]. University of Azad Jammu and Kashmir, Muzaffarabad, Pakistan. https://prr.hec.gov.pk/jspui/ bitstream/123456789/6906/1/Haroon-un-Rashid_2015_English_Univ_of_AJK_Muzafarabad.pdf
Repp, B. H., & Lin, H. B. (1990). Integration of segmental and tonal information in speech perception: A cross-linguistic study. Journal of Phonetics, 18(4), 481–495. https://doi.org/10.1016/S0095-4470(19) 30410-3
Sandhu, J. K., & Singh, A. (2021). Research insight of indian tonal languages: A review. Artificial Intelligence and Speech Technology. CRC Press.
Schmitz, J., Bartoli, E., Maffongelli, L., Fadiga, L., Sebastian-Galles, N., & D'Ausilio, A. (2019). The motor cortex compensates for the lack of sensory and motor experience during auditory speech perception. Neuropsychologia, 128, 290–296. https://doi.org/10.1016/j. neuropsychologia.2018.01.006
Shahi, T. B., & Sitaula, C. (2022). Natural language processing for Nepali text: A review. Artificial Intelligence Review, 55, 3401–3429. https://doi.org/10.1007/s10462-021-10093-1
Silva, D. (2006). Acoustic evidence for the emergence of tonal contrast in contemporary Korean. Phonology, 23(2), 287–308. http://doi.org/10. 1017/S0952675706000911
Sjerps, M. J., Zhang, C., & Peng, G. (2018). The lexical tone is perceived relative to the locally surrounding context, and vowel quality to the preceding context. Journal of Experimental Psychology, 44(6), 914–924. https://doi.org/10.1037/xhp0000504
Spille, C., Ewert, S. D., Kollmeier, B., & Meyer, B. T. (2018). Predicting speech intelligibility with deep neural networks. Computer Speech & Language, 48, 51–66. https://doi.org/10.1016/j.csl.2017.10.004
Stevens, K. N., & Blumstein, S. E. (1978). Invariant cues for the place of articulation in stop consonants. The Journal of the Acoustical Society of America, 64(5), 1358–1368. https://doi.org/10.1121/1.382102
Thubthong, N., Kijsirikul, B., & Luksaneeyanawin, S. (2002, May 9–11). An empirical study for constructing Thai tone models (Paper presentation). 5th Symposium on Natural Language Processing and Oriental COCOSDA Workshop. Thailand.
Tong, T., Gray, K., Gao, Q., Chen, L., Rueckert, D., & Alzheimer's Disease Neuroimaging Initiative. (2017). Multi-modal classification of Alzheimer's disease using nonlinear graph fusion. Pattern Recognition, 63, 171–181. https://doi.org/10.1016/j.patcog.2016.10.009
van Lancker, D., & Fromkin, V. A. (1978). Cerebral dominance for pitch contrasts in tone language speakers and musically untrained and trained English speakers. Journal of Phonetics, 6(1), 19–23. https://doi.org /10.1016/S0095-4470(19)31082-4
Watkins, K. E., Strafella, A. P., & Paus, T. (2003). Seeing and hearing speech excites the motor system involved in speech production. Neuropsychologia, 41(8), 989–994. https://doi.org/10.1016/S0028-3932(02)00316-0