
| Review | Open Access |
|---|
Improvement of Sigma Level in a Finishing Department of Home Textile Unit Industry |

|
|---|
![]() Muhammad Zaid Khan* ,
Muhammad Zaid Khan* ,
![]() Ali Zulqarnain ,
Ali Zulqarnain ,
![]() Muhammad Wasif , and
Muhammad Wasif , and
![]() Rabia Siddiqui
Rabia Siddiqui
Department of Industrial and Manufacturing Engineering, NED University of Engineering & Technology, Karachi, Pakistan
The research is done on the finishing department of home textile unit, the purpose is to reduce the defects which were encountering during the finishing process, 3M is used in which man, machine and material are included has been reviewed and Root cause Analysis is done to archive better sigma level. Finishing department is serving for bleach, dyed & printed fabric, more chances of defects to be rise in Finishing side as for dying & printing, the fabric is repeated twice or thrice depending upon the print or dyed quality and parameters requirement, the sigma level before improvement was 3.31, after successful implementation of improvement and defects minimization sigma level of Finishing department was improved to 3.71 (13500 Defects per day). Thus, with the of Six sigma tools the production losses would take into control and significant amount of labor cost, time and utilities (Steam, compressed air, water and Power) would also take into control.
I. INTRODUCTION
Six Sigma is a statistical approach for visualizing the performance of any production part with in all era of time. It is used to keep record and to track the performance of part either in planning, Quality, procurement, production, packaging or even maintenance [1]. Concept of Six Sigma aims to provide practitioners with the means to view the process capability and improvement [2]. Few sectors of manufacturing like Aerospace, Cell phones, Health care, Military, Retail and E- Commerce and Supply of Food from home to market have achieved Sigma level at highest level that is Six Sigma.
Many industries are still not implementing Six Sigma, due to Lower knowledge and techniques are only applicable in industry for the quality improvement in some particular sector like manufacturing [3]. Few multi-national companies in Pakistan are using six sigma approaches to maintain their production only. On Microscopic level it seems to be implemented but not on Macroscopic level. Parameters include the size, quality and scale to implement the Six Sigma in industry are essential for an industry to boost its production or to lower its losses [4].
As the scope of this research is to improve the Sigma level of Production with the aim of 3M methodologies, hence the technical prospect of finishing process of home textile fabric is also kept in consideration. In a home textile unit, there are eight different types of processes are performed, starting from singeing, bleaching, mercerization, bleach mercerize, pigment printing, reactive printing, dyeing to finishing process. Mainly 4 main departments hold these processes named as Pretreatment department in which Singeing, Bleaching and Mercerizing processes [5] are included. Secondly, where all types of dyeing came is Dyeing department [6], all kind of printing in Printing department [7] and in the last Finishing department [8] that deals in Calendaring, Stenter, Sanforizes. Moreover, finishing department also serves in intermediate process for Pretreatment, dyeing and Printing departments as per the process requirements. So, a huge load of processing on Finishing department. Many reasons there in home textile cause lower production as Quality losses in which reprocessing in textile is amongst them [9]. LSS tools (DMAIC, VSM, 5S, SPC, etc.) are used in textiles. It has been seen that in home textile that about 5-6 % of the actual production fabric count for reprocessing is quality related issues that occurs from man, machine and material respectively.
Six Sigma Technique has taken into action in order to minimize the overprocessing and reprocessing. Six sigma tools help in lowering the defects in Finishing department which was highlighted, and by encountering these defects to get better results ultimately reducing the reprocessing.
II. METHOD
Six Sigma applies two of the best-known process-improvement methodologies currently practiced, widely used by organizations for realizing substantial gains in cost savings, quality, and cycle time through process performance gains. Lean Sigma unites the complex methods of lowering variability from Six Sigma and waste elimination and removal of non-value-adding activities from Lean Manufacturing and integrating them into a holistic approach towards process excellence [10]. Six Sigma follows the DMAIC methodology, which stands for Define, Measure, Analyze, Improve, and Control. This structured approach helps organizations systematically improve processes and enhance overall performance. Basic tools and techniques used in the DMAIC method is represented by Figure 01.
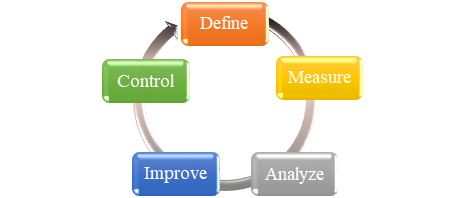
FIGURE 1. DMAIC circle
During the step of defining, the research problem is defined. Four key departments of the assigned home textile plant are considered: Pre-treatment department, dyeing department, printing department, and Finishing department. Furthermore, to ensure reproducibility and credibility, the study incorporates a clear sampling process, well-defined selection of performance metrics, and systematic data collection methods, which provide a transparent foundation for the analysis and subsequent improvements. Key performance metrics considered in this study include defect rate, defects per million opportunities (DPMO) with corresponding sigma levels, first pass yield, rework and scrap cost, cycle time, on-time delivery, and outgoing quality level (OQL). These indicators were selected to capture both the quality and efficiency dimensions of process performance across the four departments of the textile plant, namely pre-treatment, dyeing, printing, and finishing. Data for these metrics was collected through a combination of production records and quality logs, stratified random sampling of batches, inspection check sheets, and control charts to categorize and monitor defects. In addition, direct observations and time studies were carried out to measure actual cycle times and identify bottlenecks, while operator interviews and surveys were conducted to gain insights into process variations and human factors. Customer complaint records and feedback were also reviewed to link internal defect trends with external quality performance.
There are impurities such as dust particles and other contaminants commonly found in both natural and synthetic fibers. Additionally, secondary impurities may be introduced during spinning, knitting, and weaving processes, affecting fiber quality [11]. In Pretreatment department Singeing process is use to remove the burr from the fabric followed by bleaching process. In the pre-treating process, all the impurities influencing the process of dyeing and printing in a negative fashion are washed away. Pre-treating includes de-sizing, scouring, and bleaching, and these facilitate smooth processes of future dyeing and softening. But different processes of pre-treating of de-sizing, scouring, and bleaching can drastically lower the quality of the product, producing uneven coloration and lower fastness. Pre-treatment process is represented by Figure 2.
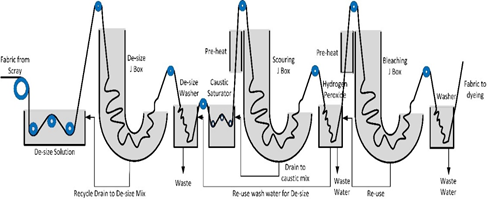
FIGURE 2. Pre-Treatment of fabric
During the pre-treating, all the impurities with negative effects on dyeing and printing are washed. De-sizing, scouring, and bleaching, enabling smoother processes of dyeing and softening, are undertaken. But differences in pre-treating processes of de-sizing, scouring, and bleaching can significantly reduce the quality of the product, producing uneven color and lower fastness, dyeing process is represented by Figure 3.
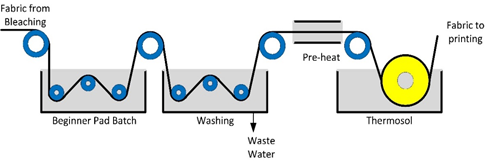
FIGURE 3. Dyeing process
Textile Printing is a technique of ornamentation of cloth with color, dyes, and other chemicals in printed forms. Apparently evolved from hand-painted cloth, such processes are centuries old. Printing methods are classified into the categories of direct, discharge, and resist. With direct printing, color paste coats the cloth directly. In Figure 4 Roller printing process is displayed which is one of the printing techniques.
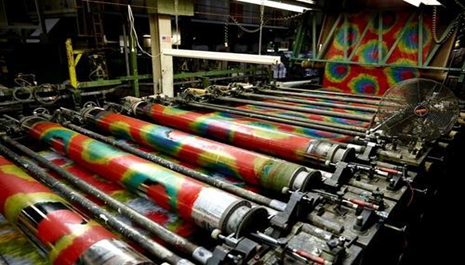
FIGURE 4. Roller printing (fabric)
In wet processing, the finishing department is responsible to play the crucial role to make complete home textile products. Once sewing performance is achieved, fabric is transferred to the finishing department to receive the finishing touch. Two of the very key determinants of where a product is placed in the market are finishing and packaging. The finishing process has a range of steps, such as Equalizing, conducted with stenters. In this step, heat treatment of cloth controls its width, moisture, spirality, and shrinking. Followed by Calendaring process which makes fabric smooth, thin and coated [12]. One more process is Sanforizes which is used to avoid shrinkage specially in woven fabric.
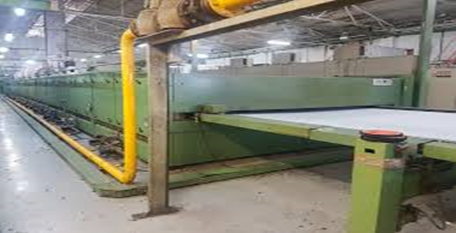
FIGURE 5. Stenter machine for finishing and equalizing processes
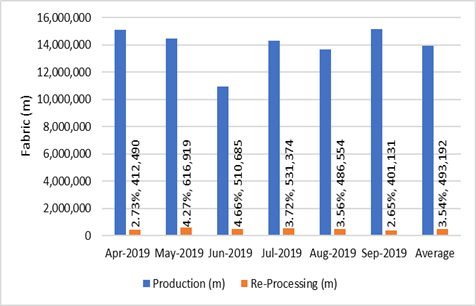
FIGURE 6. Month-wise production and rework in fabric
In the home textile unit, the main products include bed sheets, curtains, and pillow covers, along with various other items made from lawn and cotton fabrics, catering to diverse household needs [13]. The unit also has an average monthly production of about 14 million meters of fabric. Following bar-graph (Figure 6), this data shows a comparison between the total fabric production and the amount of re-processed fabric over a six-month period, from April 2019 to September 2019.
On average, 0.5 million meters of cloth are being reprocessed on a monthly basis, of which 55% of them need re-equalization and 45% of them need re-finishing, generating quality cost, mostly internal failure cost. From the data provided, a floor survey has been conducted for identifying the root causes of major defects, and their frequencies of occurrence, for causing reprocessing [14]. Figure 6 and 7 illustrates the Pareto chart showing the frequency of defects occurring during the most common re-processing stages, namely re-equalizing and re-finishing. As shown in Figure 6, it is evident that 92.5% of the defects are due to width shortages and operator negligence. Figure 7 clearly shows that 95% of the defects are attributed to grease marks, hand feel, design deviations, and stain marks. Therefore, it can be concluded that controlling these six defects could lead to significant savings in re-processing costs. Based on the above-mentioned data, the sigma level of the current process can be calculated, which is shown in Table 1.
TABLE I
SIGMA LEVEL OF THE FINISHING PROCESS BEFORE IMPROVEMENT
|
Opportunities |
Defects |
Defects Per Million Opportunities (DPMO) |
Sigma Level (As per Six Sigma Table) |
|---|---|---|---|
|
13,941,501 m |
493,192 m |
35,376 |
3.31 |
Thus, by identifying the major defects and determining the sigma level, the study progresses to the analysis.
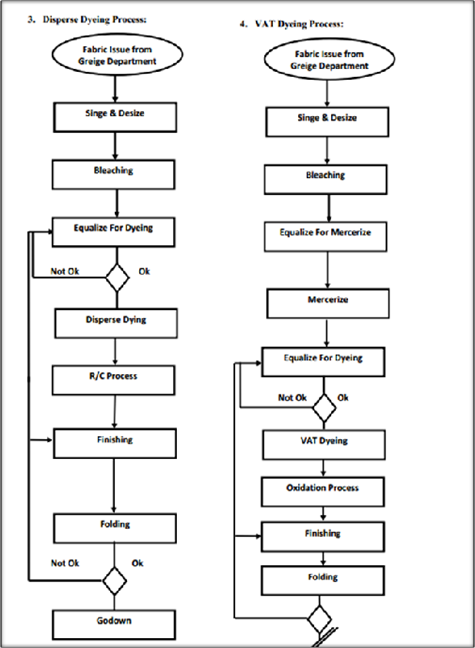
FIGURE 7. Process flow chart of dyeing processes with finishing department role as highlighted.
A. ANALSISMinimizing defects is crucial for ensuring product quality. Producing high-quality products is essential to remain competitive in the global market. This study adopts the Lean Six Sigma methodology to identify the major defects, analyze their root causes, and propose effective solutions to minimize these defects. By effectively utilizing the techniques of Six Sigma, key issues are identified, and wastage, and its impacts, are minimized [15]. This directly contributes towards quality and production efficiency improvement, reducing production delays, reducing usage of chemicals, reducing usage of utilities, and ultimately, customer satisfaction.
TABLE II
MONTHLY PRODUCTIONS WITH REPROCESSING
|
Month |
Production (M) |
Re Process (M) |
Re Process Categories |
|
|---|---|---|---|---|
|
Re Finish (M) |
Re Equalize (M) |
|||
|
Apr-18 |
15,106,983 |
412,490 |
149,710 |
262,780 |
|
May-18 |
14,463,375 |
616,919 |
343,809 |
273,110 |
|
Jun-18 |
10,951,690 |
510,685 |
202,120 |
308,565 |
|
Jul-18 |
14,302,620 |
531,374 |
227,249 |
304,125 |
|
Aug-18 |
13,664,273 |
486,554 |
163,924 |
322,630 |
|
Sep-18 |
15,160,069 |
401,131 |
203,151 |
197,980 |
|
Total (m) |
83,649,010 |
2,959,153 |
1,289,963 |
1,669,190 |
|
Average (m) |
13,941,501 |
493,192 |
214,933 |
278,198 |
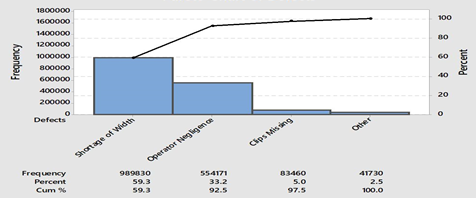
FIGURE 8. Pareto chart for defects arrived during re-equalizing process
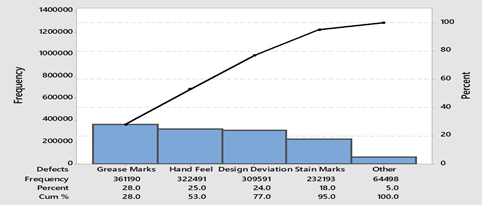
FIGURE 9. Pareto chart for the defects occurred during re-finishing process
B. ROOT CAUSE ANALYSISRoot cause analysis is the process of identifying the underlying issues that must be addressed for a program to achieve its vision. Simply using SBCC methods to address only the surface-level factors of a problem will not lead to effective solutions. Parallel with the practice of the technique of the Five Whys, this process ensures companies can find the root of a flaw and act on this, rather than treating only the overt "sign" of the problem [16]. An example of a typical root cause analysis for the problem identified can be viewed in the chart of RCA. Typical root cause analysis for the defined problem is shown in the RCA chart below:
TABLE III
ROOT CAUSE ANALYSIS OF REPROCESSING ISSUES
|
|
Input (Cause) |
Process |
Output (Effect) |
|---|---|---|---|
|
1 |
Shortage of Width Issue |
Man: Caused by operator negligence in setting the defined parameters. |
The whole lot goes for re equalizing. |
|
2 |
Clips missing |
Machine: Low Maintenance of machines. |
Fabric often goes for shortage of width, bowing and skewing issues. |
|
3 |
Stains Marks |
Method: Issues in chemical preparation. |
Stain marks on the fabric, particularly after folding, lead to returns, making it a critical issue. |
|
4 |
Hand feel |
Man: Less Expertise. Machine: Improper grinding of the rolls. Method: Absence of Lico. |
From the Customers fabric return and it’s reprocessed. |
|
5 |
Deviation of Design |
Man: Lack of focus on the MAHLO system (the bow and skew setting mechanism). |
The fabric is returned from printing for re-equalization. |
|
6 |
Crease Marks |
Man: Negligence. |
Fold department returns the lot. |
|
7 |
Operator Negligence |
Man: Lack of trainings, No focus on machine/process. |
Due to this issue fabric re equalize as well as refinish issues generate. |
|
8 |
Machine Issue |
Man: No focus on Preventive Maintenance. Machine: Machines set parameters not achievable. Method: SOPs not following/ No Proper SOPs. |
Oil stains, clips missing, burnt spot issues were found on fabric. |
Failure Mode Effects Analysis (FMEA) is a method used to quantify and prioritize risks in a process, product, or system, followed by implementing measures to minimize these risks. The first step in FMEA is to analyze the functional requirements and their potential effects to identify all possible failure modes. Data for this analysis is gathered through surveys, floor visits, and questionnaires.
D. SURVEYA Survey was conducted with the help of google forms and questionnaires with the machine operators, heads and in charges.

FIGURE 10. Display of surveys responses (google forms)
E. RISK PRIORITY NUMBER (RPN)The Risk Priority Number (RPN) is an arithmetic value used to assess the risk associated with a process or its individual steps within the context of Failure Mode and Effects Analysis (FMEA). The RPN is determined after completing the initial groundwork steps of the analysis.
III. RESULTS
A. DATA COLLECTED FROM SURVEYFollowing data that is represented by Table 4 shows the causes for the reprocessing.
TABLE IV
REPROCESSING CAUSES
|
S.No. |
Failures |
Effects |
|---|---|---|
|
1 |
Shortage of Width Issue |
The whole lot goes for re equalizing. |
|
2 |
Clips missing |
Fabric often goes for shortage of width, bowing and skewing issues. |
|
3 |
Stains Marks |
The presence of stain marks on the fabric, particularly after folding, leads to returns, making it a critical issue. |
|
4 |
Hand feel |
From the Customers fabric return and it’s reprocessed. |
|
5 |
Design Deviation |
Fabric returns from the printing to re equalize/ Engineering design issues |
|
6 |
Crease Marks |
Fabric returns from fold. |
|
7 |
Operator Negligence |
Due to this issue fabric re equalizes as well as refinish. |
|
8 |
Machine Issue |
Oil stains, clips missing, burnt spot issues were found on fabric. |
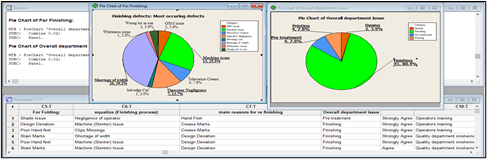
FIGURE 11. Defects calculation from online survey and questioners
B. FOR RISK PIRORITY NUMBER1) SEVERITY LEVEL CALCULATIONS
Severity is the seriousness of failure consequences of failure effects. Usual practice rates, failure effect severity (S) on a scale of one to 10 where one is lowest severity and 10 is highest by ASQ.
TABLE V
OCCURRENCE LEVEL DESCRIPTION
|
S. No. |
Failures |
Occurrence |
|---|---|---|
|
1 |
Shortage of Width Issue |
6 |
|
2 |
Clips missing |
8 |
|
3 |
Stains Marks |
9 |
|
4 |
Hand feel |
7 |
|
5 |
Design Deviation |
5 |
|
6 |
Crease Marks |
6 |
|
7 |
Operator Negligence |
5 |
Once remedial actions are determined, the next step is to test their efficacy and efficiency. Additionally, the design should be verified, and the inspection procedures must be clearly specified.
TABLE VI
SEVERITY LEVEL DESCRIPTION
|
Severity level |
Consideration |
|---|---|
|
1 |
Very low severe (With intolerance) |
|
2-3 |
Severe (Low) |
|
4-5 |
Medium, Severe |
|
6-7 |
Severe (CTQ) |
|
8-9 |
Severe (Move for Reprocess) |
|
10 |
Highly severe (Whole lot will be rejected) |
TABLE VII
RESULTS OF SEVERITY OF REPROCESSING
|
S.No. |
Failures |
Severity |
|---|---|---|
|
1 |
Shortage of Width Issue |
3 |
|
2 |
Clips missing |
2 |
|
3 |
Stains Marks |
5 |
|
4 |
Hand feel |
7 |
|
5 |
Design Deviation (Engineering Design) |
5 |
|
6 |
Crease Marks |
4 |
|
7 |
Operator Negligence |
3 |
TABLE VIII
DETECTION LEVEL DESCRIPTION
|
Detection Level |
Consideration |
|---|---|
|
1 |
Very Detection severe (With intolerance) |
|
2-3 |
Detection (Low) |
|
4-5 |
Medium Detection |
|
6-7 |
Detection (CTQ) |
|
8-9 |
Detection (Move for Reprocess) |
|
10 |
Highly Detection (Whole lot will be rejected) |
TABLE IX
RESULTS OF DETECTION OF REPROCESSING ISSUES
|
S.No. |
Failures |
Detection |
|---|---|---|
|
1 |
Shortage of Width Issue |
9 |
|
2 |
Clips missing |
9 |
|
3 |
Stains Marks |
7 |
|
4 |
Hand feel |
4 |
|
5 |
Design Deviation |
4 |
|
6 |
Crease Marks |
3 |
|
7 |
Operator Negligence |
1 |
TABLE X
OCCURRENCE LEVEL DESCRIPTION
|
Occurrence Level |
Consideration |
|---|---|
|
1 |
Very low occurrence (With intolerance) |
|
2-3 |
Occurrence (Low) |
|
4-5 |
Medium Occurrence |
|
6-7 |
Occurrence (CTQ) |
|
8-9 |
Occurrence (Move for Reprocess) |
|
10 |
Highly Occurrence (Whole lot will be rejected) |
TABLE XI
RESULTS OF OCCURRENCE OF REPROCESSING ISSUES
|
S.No. |
Failures |
Occurrence |
|---|---|---|
|
1 |
Shortage of Width Issue |
6 |
|
2 |
Clips missing |
8 |
|
3 |
Stains Marks |
9 |
|
4 |
Hand feel |
7 |
|
5 |
Design Deviation |
5 |
|
6 |
Crease Marks |
6 |
|
7 |
Operator Negligence |
5 |
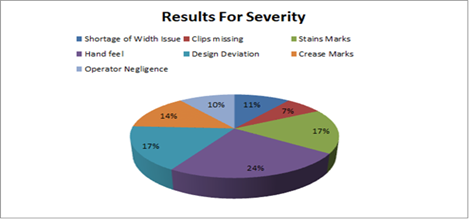
FIGURE 12. Pie charts for %severity
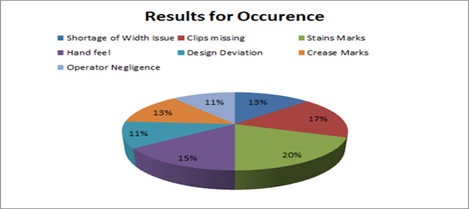
FIGURE 13. Pie charts for % occurrence
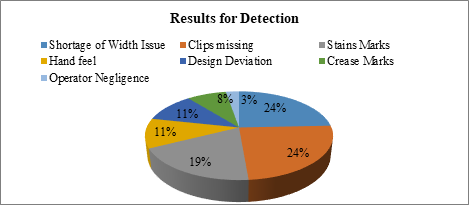
FIGURE 14. Pie chart for the % detection of defects
E. RISK PRIORITY NUMBER CALCULATIONSTABLE XII
RPN NUMBER CALCULATION
|
S.No. |
Failures |
Severity (S) |
Occurance (O) |
Detection (D) |
RPN=S*O*D |
|---|---|---|---|---|---|
|
1 |
Shortage of Width Issue |
3 |
6 |
9 |
162 |
|
2 |
Clips missing |
2 |
8 |
9 |
144 |
|
3 |
Stains Marks |
5 |
9 |
7 |
315 |
|
4 |
Hand feel |
7 |
7 |
4 |
196 |
|
5 |
Design Deviation |
5 |
5 |
4 |
100 |
|
6 |
Crease Marks |
4 |
6 |
3 |
72 |
|
7 |
Operator Negligence |
3 |
5 |
1 |
15 |
|
|
|
Total RPN |
1,004 |
||
The current RPN number extracted and it is needed to reduce that number having high RPN number (S*O) so that reprocessing can also be minimized. Ranking by RPN will be:
Highest: Stain Marks (RPN = 315) → critical issue. then Hand Feel (RPN = 196), Shortage of Width (162), Clips Missing (144) to Lowest: Operator Negligence (15). This ranking is important for prioritizing corrective actions.
As per Pareto Analysis (80/20 Rule): Total RPN = 1004. Cumulative contributions will be: Stain Marks = 31.4%, Hand Feel = 50.9%, Shortage of Width = 67.0%, Clips Missing = 81.4%
Whereas, Descriptive Statistics: Mean RPN = 143.4, Standard deviation ≈ 91.5 (shows high variability across failure modes), Outlier: “Stain Marks” far exceeds average risk.
Most of the issues are generating due to width shortage and operator negligence. Due to crease marks and hand feel most of the issues are generating. The major defects observed in the finishing process are varied in nature. Shortage of width often occurs due to frequent stoppages between mercerization and drying, which produce non-uniform fabric widths. Clips missing is another common defect, usually arising from operator negligence, high machine speeds, or poor maintenance and greasing of clips. When clips fail to hold the fabric properly, the heat-setting process causes burns or the appearance of yellow strip shades. Similarly, machine-related issues are significant, since preventive maintenance is often neglected. Problems such as faulty burners, improper temperature settings, and irregular machine speeds lead to friction marks, jerks, and yellow stain formation. Operator negligence also plays a role, with machines frequently being run above or below standard speeds, or on bypass modes that skip necessary processing steps. Crease marks are generated when the batcher folds fabric abruptly, or during mercerization when damp fabric runs at high speed in a twisted form, resulting in visible creases. A further issue is the hand feel of the fabric, which deteriorates when operators fail to perform timely checks during folding operations, reflecting a lack of supervision. Stain marks are another persistent defect, caused by a variety of factors including dye droppings, rust, oil or zinc particles, and bubble formation in the troughs or chemical tanks of finishing machines. They can also originate in the pretreatment stage, while Sanforizer belt marks and improper padder cleaning exacerbate the issue. Other recurring problems include mixed fabric quality, rassa, selvedge cuts, and inadequate cleaning of rolls, troughs, and chemical tanks between shade changes, along with incorrect temperature settings, all of which compromise fabric quality.
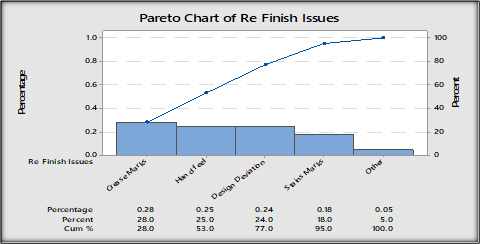
FIGURE 15. Pareto chart of refinish defects
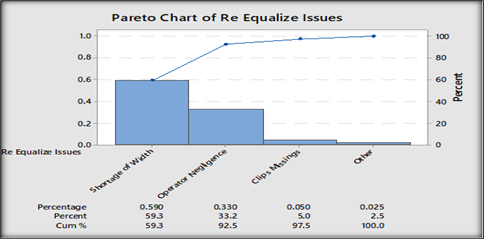
FIGURE 16. Pareto Chart of Re equalizing issues
F. REMEDIAL ACTIONSSo in order to reduce these defects following actions are taken:
- The initial step was to focus on the process. Some fabric was incorrectly released from the Greige department, causing shortages in processing. To address this, a mail system was introduced to report fabric shortages in terms of width and length. This system enabled the responsible department or personnel to monitor and correct these errors. Additionally, the Greige department implemented.
- Improvements, including batchers with proper labeling using the 5S methodology, which helped minimize width shortages and other quality defects.
- The second crucial action taken was the preventive maintenance of machines to ensure their proper functioning and maximum efficiency. Furthermore, machine overhauling was carried out, significantly reducing the need for fabric reprocessing.
- An air audit was conducted to investigate padder pressure, as issues related to padder pressure and shade variations were observed. The audit assessed compressed air concerns, enabling necessary corrective measures to be taken to resolve shade variation problems.
- Stenter pick-up tests were carried out to test the performance of the padders. 70-80% pick-up rate should be achieved for even coloration, and anything else can lead to colour variations and stains. During the testing, some of the padders were found to be inoperable due to incorrect operator settings, faulty gauges, or because the padder grinding was due. All the issues were fixed with the grinding of the padders and the adjustment of air pressure to the standard 4 Bars
- A reprocessing sheet system has been introduced for tracing reprocessing of the cloth, not only in finishing, but also in other sections. The sheets are finalized by the department and approved by the Processing's General Manager. The system ensures errors and corrective action are communicated with top management. With this approach, reprocessing processes in every department are tracked, and prevention of defects in the cloth.
- Operator training programs were organized to equip them with the skills to operate machines in the absence of senior representatives and handle quality-related issues. Staff and operator training is an integral part of Six Sigma implementation, making it a mandatory compliance activity. Operators received training in 5S, Poka-Yoke, and Kaizen, helping them maintain an organized work environment with minimal waste.
Through continuous efforts and improvements in the system, a reduction in defects has been observed, resulting in an improved sigma level. The attached table illustrates the progress rate.
G. RPN AFTER SIX SIGMA IMPLEMENTATIONS:TABLE XIII
RISK PRIORITY NUMBER AFTER TAKEN ACTIONS
|
S.No. |
Failures |
RPN (Before) |
Severity |
Occurrence |
Detection |
RPN=S*O*D (After) |
|---|---|---|---|---|---|---|
|
1 |
Shortage of Width Issue |
162 |
3 |
3 |
9 |
81 |
|
2 |
Clips missing |
144 |
2 |
4 |
9 |
72 |
|
3 |
Stains Marks |
315 |
5 |
4 |
7 |
140 |
|
4 |
Hand feel |
196 |
7 |
5 |
4 |
140 |
|
5 |
Design Deviation |
100 |
5 |
3 |
4 |
60 |
|
6 |
Crease Marks |
72 |
4 |
2 |
3 |
24 |
|
7 |
Operator Negligence |
15 |
3 |
4 |
1 |
12 |
|
|
Total RPN before |
1,004 |
Total RPN after |
529 |
||
TABLE XIV
IMPROVEMENT IN SIGMA LEVEL MONTH WISE PERFORMANCE REPORT
|
Month |
Production (m) |
Reprocess (m) |
Reprocess Categories |
Sigma Level |
|
|---|---|---|---|---|---|
|
Refinish (m) |
Re equalize (m) |
||||
|
OCT |
15548845 |
492187 |
256743 |
235444 |
3.36 |
|
NOV |
14688145 |
376371 |
145698 |
230673 |
3.45 |
|
DEC |
11887254 |
216312 |
102998 |
113314 |
3.59 |
|
JAN |
13207570 |
473415 |
107654 |
365761 |
3.30 |
|
FEB |
11829979 |
152156 |
100578 |
51578 |
3.73 |
|
Total |
67161793 |
1710441 |
713671 |
2424112 |
|
|
Avg |
13432359 |
342088 |
142734 |
484822 |
|
After the successful implementation of Six Sigma, the following fruitful results were achieved: A 31% reduction in reprocessing. An improvement in the sigma level from 3.31 to 3.73.
TABLE XV
COST SAVINGS DUE TO SUCCESSFUL IMPLEMENTATION OF IMPROVED STEPS
|
Working |
Cost Incurred |
|---|---|
|
Preventive Maintenance of Machines |
Rs. 250,000 (Approximately) |
|
Over Hauling of Machines |
Rs. 10,000,000 (Fixed Cost) |
|
Air Audit |
Rs. 5,00,000 |
|
Project Savings (As Per 493,132 mtr. reprocess) |
|
|
Control Over Reprocessing (Nov-18) |
Rs. 299,182/ Month |
|
Control Over Reprocessing (Dec-18) |
Rs. 686,524/ Month |
|
Control Over Reprocessing (Jan-18) |
Rs. 64,336/Month |
|
Control Over Reprocessing (Feb-18) |
Rs. 900,000/ Month |
|
Total Savings (Nov-Feb) |
Rs. 1,892,042 |
IV. DISCUSSIONS
This research primarily aimed at reducing production losses, which were most significant in the Finishing Department of the textile manufacturing process. Six Sigma methodologies and tools, including Root Cause Analysis (RCA), Failure Modes and Effects Analysis (FMEA), and the calculation of the Risk Priority Number (RPN), were employed to achieve this goal, the study successfully identified and quantified areas of loss, which subsequently enabled targeted improvements. The application of these quality tools facilitated a data-driven approach to minimize inefficiencies and resulted in a significant reduction in fabric reprocessing. As a direct outcome, a total of 493,132 meters of fabric was saved from being reprocessed, showcasing the effectiveness of this structured problem-solving approach [17]. The Pareto Chart, one of the core tools in quality management, was instrumental in identifying and prioritizing the most critical factors contributing to reprocessing [18]. The analysis revealed that the majority of losses stemmed from two major categories: Re-equalize and Re-finish. The Re-equalizing issues were predominantly caused by width shortages and operator negligence [19]. To tackle these challenges, targeted training sessions were conducted for operators, focusing on fabric handling techniques, machine operations, and the correct use of chemical compositions. Additionally, the issue of width shortage was addressed through the implementation of a systematic tracking mechanism for batchers and by ensuring proper handling of fabric across multiple stages namely Greige, Bleach, Dyeing, Printing, and Finishing departments. On the other hand. Re-finishing issues were mainly associated with defects like crease marks and improper hand feel of the fabric. These were resolved by introducing standardized control techniques such as the Padder Pickup Test, as well as rectifying problems like missing clips and fabric handling errors [20]. By focusing on both technical and human factors namely Man, Machine, and Material the study enabled the implementation of improved staffing strategies and operational controls. ultimately, the combined effect of these interventions led to a significant enhancement in the overall production efficiency [21]. Not only did it reduce the rate of fabric reprocessing, but it also contributed to tangible savings in utilities, manpower, labor costs, and production time, thereby supporting on-time delivery schedules. Furthermore, the research had a positive environmental impact by lowering the carbon footprint associated with repeated processing [22]. In beyond causing fabric transportation to be pushed back, reprocessing additionally adds labor and inventory costs, consumes excessive amounts of manufacturing chemicals and utilities, and reduces sigma [23]. DMAIC tools (DPMO/sigma, Ishikawa, and Pareto). displays a change in performance in a clothing setting shortly after DMAIC [24]. Using traditional methods, DMAIC quality improvement reports a reduction in sewing errors. Using DMAIC+JIT to address costs of inventory in a textile plant shows that cost control is a legitimate Six Sigma goal how goes beyond defects [25]. OQL (Outgoing Quality Level) losses will be reduced by DMAIC by 2024. examines three months' worth of clothing data; high monetary quality losses are addressed using DMAIC, which evaluates both the economic impact and quality gains [26]. The reliability and reproducibility of the study findings were enhanced by this multifaceted approach to data collection, which assured both quantitative relevancy and qualitative depth [27]. This research thus demonstrates how the application of Six Sigma tools can drive substantial improvements in quality, productivity, and sustainability in textile manufacturing.
A. CONCLUSIONThe system has been able to achieve significant performance improvement and working efficiency. The adoption of Six Sigma has been made with the view of being a strategy for innovations for competitiveness in the 21st century. The strategy has three pillars, including statistical measurement, strategy for management, and quality-oriented culture. However, improvements such as standardization, Kaizen, and 5S come at no extra cost yet yield substantial positive impacts. Additionally, training programs and informed decision-making help minimize reprocessing losses. Achieving continuous improvement in the system is difficult, mainly because these organizations typically operate in a non-projectized structure. Therefore, shifting towards a projectized or hybrid model is necessary. Teamwork plays a vital role in enhancing system efficiency by ensuring tasks are completed with accountability and responsibility. Given the textile industry’s high level of variations and defects at every stage, it serves as an ideal sector for Six Sigma implementation. Rapid and effective execution of Six Sigma methodologies can significantly enhance a company’s future success. The analysis was based on a limited number of departments and a specific time frame, which may restrict the generalizability of the findings across the broader textile sector. Furthermore, external variables such as supply chain disruptions, raw material variability, and market dynamics were not fully incorporated into the scope of the study. Future work should therefore consider longitudinal studies across multiple textile plants, integrating supply chain factors, digital monitoring tools, and sustainability-oriented metrics to provide a more holistic view of Six Sigma’s impact. Exploring hybrid approaches that combine Six Sigma with Industry 4.0 technologies and advanced analytics could also further strengthen competitiveness in this highly variable industry.
Author Contribution
Muhammad Zaid Khan: conceptualization, formal analysis, methodology, writing – original draft. Ali Zulqarnain: data curation, investigation, methodology, supervision, validation, writing – review and editing. Muhammad Wasif: formal analysis, investigation, project administration, software, supervision, visualization, writing – review and editing. Rabia Siddiqui: data curation, resources, validation.
Conflict of Interest
The authors of the manuscript have no financial or non-financial conflict of interest in the subject matter or materials discussed in this manuscript.
Data Availability Statement
The data associated with this study will be provided by the corresponding author upon request.
Funding Details
No funding has been received for this research.
Generative AI Disclosure Statement
The authors did not used any type of generative artificial intelligence software for this research.
REFERENCES
- Kolhe, V. Upadhayay, and Y. Ladhe, “A study on implementation of Six Sigma process in industry,” Int. J. Adv. Res. Ideas Innov. Technol., vol. 3, no. 8, Art. no. V3I8–1168, 2018.
- Jirasukprasert, J. A. Garza-Reyes, V. Kumar, and M. K. Lim, “A Six Sigma and DMAIC application for the reduction of defects in a rubber gloves manufacturing process,” Int. J. Lean Six Sigma, vol. 5, no. 1, pp. 2–22, Feb. 2014, doi: https://doi.org/10.1108/IJLSS-03-2013-0020.
- M. Ibrahim, “Implementation of Lean Six Sigma in the yarn manufacturing: A case study,” J. Text. Apparel Technol. Manag., vol. 10, no. 12, pp. 1703–1715, Dec. 2019.
- Zaman, S. K. Pattanayak, and A. C. Paul, “Study of feasibility of Six Sigma implementation in a manufacturing industry: A case study,” Int. J. Res. Eng. Technol., vol. 3, no. 1, pp. 96–100, 2017.
- Asaduzzaman, M. Mir, F. Hossain, X. Li, Zakaria, and H. Quan, “A study on the effects of pre-treatment in dyeing properties of cotton fabric and impact on the environment,” Text. Sci. Eng., vol. 6, no. 5, 2020, Article e5, doi: https://doi.org/10.4172/2165-8064.1000274.
- R. Natarajan and S. Kumar, “Revolutionizing textile dyeing: Investigating water-saving strategies from a research perspective,” Int. J. Creat. Res. Thoughts, vol. 12, no. 7, pp. b239–b245, 2020.
- Lavanya and N. Kishore, “Different textile printing techniques: Hand block printing, screen printing, and digital printing,” J. Text. Sci. Eng., vol. 19, no. 2, pp. 787–802, 2022.
- Anand and A. M. Pramanik, “An introduction to sustainable finishing techniques of textiles,” Int. J. Home Sci., vol. 8, no. 2, pp. 217–220, 2020.
- Thomas et al., “Fundamental challenges and opportunities for textile circularity,” Sustainability, vol. 16, no. 24, 2024, Art. no. 11117.
- Murmura et al., “Lean Six Sigma for the improvement of company processes: The Schnell S.p.A. case study,” TQM J., vol. 33, no. 7, pp. 351–376, 2018, doi: https://doi.org/10.1108/TQM-06-2021-0196.
- Ali et al., "Hydrophobic treatment of natural fibers and their composites—A review," J. Indus. Text., vol. 47, no. 8, pp. 2153–2183, June 2016, doi: https://doi.org/10.1177/1528083716654468.
- Tarai and S. Yadav, "Advances in textile finishing," Int. J. Res. Trends Inn., vol. 9, no. 4, pp. 26–32, 2020.
- Parmar and T. Malik. Home textiles: A review. (2020). [Online]. Available: https://www.researchgate.net/publication/326508042_Home_Textiles-A_Review_Home_Textiles-A_Review
- Baloyi et al., "Recent advances in recycling technologies for waste textile fabrics: A review," Text. Res. J., vol. 94, no. 3, pp. 508–529, Nov. 2023, doi: https://doi.org/10.1177/00405175231210239.
- Ahmed et al., "Implementation of the Six Sigma methodology for reducing fabric defects on the knitting production floor: A sustainable approach for knitting industry," Text. Leather Rev., vol. 5, pp. 223–239, 2023, doi: https://doi.org/10.31881/TLR.2022.29.
- J. Moin, K. R. Hossain, and L. M. Baral, "Investigating root causes of sewing defects using TQM tools for quality improvement in the knit garment industry," Text. Leather Rev., vol. 6, pp. 417–433, Sep. 2023, doi: https://doi.org/10.31881/TLR.2023.071.
- L. Karwande, S. P. Bhosle, and P. M. Ambad, "A review of Six Sigma approach to enhance performance in manufacturing industries," in Proc. Int. Conf. Appl. Mach. Intell. Data Anal., Aurangabad, India, 2017, pp. 654–663.
- Sekhar, S. Shaikh, I. Akbani, and N. S. Solke, “Pareto analysis-based investigation and reduction of welding-defects in automobile ring gear/flex plate assembly,” Int. J. Appl. Eng. Res., vol. 10, no. 4, pp. 9811–9818, 2015.
- Z. Ozek and D. Y. Ayakta, "TPM project for remedying weft distortions in a textile mill," J. Text. Sci. Technol., vol. 11, no. 1, pp. 6–13, 2019, doi: https://doi.org/10.15406/jteft.2025.11.00397.
- Islam and M. A. Halim, "Washing defects and remedial actions of denim garments and statistical review of denim sectors in emerging economy," J. Manag. Sci. Eng. Res., vol. 4, no.1, pp. 30–40, 2020, doi: https://doi.org/10.30564/jmser.v4i1.2941.
- D. Adikorley, L. Rothenberg, and A. Guillory, "Lean Six Sigma applications in the textile industry: A case study," Int. J. Lean Six Sigma, vol. 8, no. 2, pp. 210–224, 2017, doi: http://dx.doi.org/10.1108/IJLSS-03-2016-0014.
- Jiménez-Delgado et al., "Implementation of Lean Six Sigma to improve the quality and productivity in the textile sector: A case study," Presented at 14th Int. Conf., Held Part 25th HCI Int. Conf., Copenhagen, Denmark, July 23–28, 2023.
- Tampubolon and H. H. Purba, “Lean Six Sigma implementation, a systematic literature review,” Int. J. Product. Manag. Eng., vol. 9, no. 2, pp. 125–139, July 2021, doi: http://dx.doi.org/10.4995/ijpme.2021.14561.
- A. V. Nguyen, K. H. Nguyen, and D. Tucek, "Total quality management 4.0 framework: Present and future," Oper. Supply Chain Manag., vol. 16, no. 3, pp. 311–322, 2023.
- Susmita, "A systematic literature review of Total Quality Management (TQM) implementation in organization," Indones. J. Indust. Eng. Manag., vol. 2, no. 1, pp. 68–80, Feb. 2021. doi: https://doi.org/10.22441/ijiem.v2i1.10591
- H. Gomaa, "LSS 4.0: A conceptual framework for integrating Lean Six Sigma and Industry 4.0 for smart manufacturing excellence," Indian J. Manag. Lang., vol. 5, no. 1, pp. 8–9, Apr. 2025. doi: https://doi.org/10.54105/ijml.H1810.05010425.
- Zia-ur-Rehman, M. Hashim, H. U. Rehman, and A. Khan, "Enablers and barriers for adoption of Lean system: A mix method approach," Int. J. Product. Qual. Manag., vol. 35, no. 2, pp. 220–240, Mar. 2022.