
| Review | Open Access |
|---|
Process Optimization for the Production of Chitosan Nanofibers via Electrospinning |
 |
|---|
![]() Tauseef Khawar 1,2, Wasif Razzaq 3, Amjad Farooq 4, and Zakariya Zubair 3*
Tauseef Khawar 1,2, Wasif Razzaq 3, Amjad Farooq 4, and Zakariya Zubair 3*
1Department of Clothing, School of Engineering & Technology, National Textile University Faisalabad, Pakistan
2Department of Materials, The University of Manchester, Manchester, United Kingdom
3Department of Materials, School of Engineering & Technology, National Textile University Faisalabad, Pakistan
4School of Textile and Clothing, Nantong University, Nantong, China
ABSTRACT Chitosan (CS) is an important biomaterial recognized for its wide-ranging applications in filtration, wound dressings, tissue engineering, and as a natural antimicrobial agent. The incorporation of nanofibers significantly enhances the filtration performance of materials by increasing surface area. Chitosan-derived nanofibers can also impart antibacterial properties to the resulting nanocomposite filter material. Consequently, the electrospinning process was optimized to produce chitosan nanofibers at the highest feasible concentration for filtration applications. Polyethylene oxide (PEO) was utilized as a co-spinning agent, while glacial acetic acid (50%) served as the solvent during the electrospinning process. Surface morphology and fiber diameter were assessed using scanning electron microscopy (SEM). The findings indicated that smooth nanofibers were successfully produced from solutions containing 1% to 3.5% chitosan. However, at concentrations of 4% or higher, the production of nanofibers was impeded due to increased viscosity and surface tension of the solution. Additionally, analysis of fiber diameter revealed that higher applied voltage and greater working distance led to the formation of finer nanofibers. In conclusion, the nanofibers produced at the maximum viable concentration of chitosan demonstrate significant potential for antibacterial filtration and biomedical applications.
INTRODUCTION
Electrospinning is an effective technique for producing nanofibers, integrating elements of both electrospray and solution dry spinning [1]. In this process, a high voltage is applied between the needle tip of a polymer-filled syringe and a collector, inducing a charge in the polymer solution [2]. As the electrostatic repulsion force surpasses the surface tension of the polymer, a charged fine polymer jet is ejected from the Taylor cone and collected on the opposite pole of the electric field. During its travel from the tip to the collector, the solvent evaporates [3]. This method facilitates the production of fine fibers with a high surface area, high aspect ratio, and interconnected porous structure in the resulting membrane [4]–[7]. Due to their versatility, electrospun nanofibers are commercially valuable in various fields, including air filtration [8], drug delivery, tissue engineering, and wound healing [9]–[11]. Both natural and synthetic polymers can be processed through electrospinning for diverse applications.
Chitosan is a natural polymer and a widely occurring cationic amino polysaccharide, derived from the deacetylation of chitin [12]. Chitin is primarily sourced from the exoskeletons of marine organisms such as crabs, prawns, lobsters, shrimps, and cephalopods [13]. It is also nontoxic, biodegradable, and biocompatible [14]. Numerous studies have demonstrated its antimicrobial properties against bacteria, fungi, and viruses [15]–[17] making it a valuable biomaterial in medical and biomedical applications [18], [19]. Chitosan can be converted into fiber form via electrospinning [20] although its high viscosity and surface tension often necessitate the use of co-spinning polymers. Common blending partners for chitosan include alginate, collagen, poly (ethylene oxide), starch, silk fibroin, and poly (vinyl alcohol) [21]–[23]. For instance, chitosan-coated poly (L-lactic acid) membranes have been employed for water filtration, effectively removing copper ions [24].
Research has also highlighted chitosan-based nanofibrous membranes for antibacterial water filtration applications [25]. In one study, polycaprolactone was used as a co-spinning agent, producing fibers with chitosan concentrations ranging from 25% to 75%. The results indicated that membranes containing 25% chitosan exhibited excellent filtration performance against 300 nm particulates [26]. Another study reported the successful production of chitosan nanofibers using polyethylene oxide (PEO) as a co-spinning agent with 0.5 M acetic acid as the solvent, yielding smooth fibers up to 5 weights % chitosan with 20 weights % PEO. Additionally, membranes composed of poly (vinyl alcohol-co-ethylene) with chitosan and graphene oxide coatings demonstrated a 99.5% inactivation rate against E. coli and S. aureus bacteria [27]. Research by Rabea et al. also investigated the antibacterial properties of chitosan nanofibers with PEO as a co-spinning agent [21], revealing effective antibacterial activity against various Gram-positive and Gram-negative bacterial species. They recommended these membranes for applications in food packaging due to their bacterial disruption capabilities [20]. Despite the advancements in producing chitosan nanofibers combined with PEO, reported flow rates have been limited to 0.5 ml/hour, often requiring high concentrations of PEO. There is a notable gap in the detailed optimization of the electrospinning process for chitosan nanofibers, targeting a flow rate of up to 1 ml/hour using low molecular weight chitosan. This study aims to prepare solutions with varying weight percentages of low molecular weight chitosan (1%, 2%, 3%, 4%, 5%, 6%, and 7%) in 50% glacial acetic acid, using a fixed concentration of 3 wt% PEO, to investigate the impact of these parameters on surface morphology and fiber diameter.
II. EXPERIMENTAL
A. MATERIALSThe chitosan powder was sourced from Sigma Aldrich platform with a molecular weight range from 50,000-190,000 Da. As per the information of supplier, the chitosan powder was produced to give degree of deacetylation between 75% to 85%. Co-spinning agent is very import to electrospun chitosan as a solution due to its higher viscosity. Polyethylene oxide (PEO) was blended chitosan in solution form as co-spinning agent for smooth nanofibres production. Powdered PEO was sourced from the Sigma Aldrich platform and later dissolved in glacial acetic acid to make solution blend with chitosan. The molecular weight of PEO was 600 KDa. Glacial acetic acid was used as a solvent to make separate solutions of PEO and chitosan for proportionate mixing before fibre spinning as explained in Table 1. As per the supplier information, the molecular weight of glacial acetic acid was 60 Da. To make 50% concentration of glacial acetic acid before using it as a solvent, deionized water was added for the dilution.
B. SOLUTION PREPARATION FOR ELECTROSPINNINGChitosan powder of the appropriate amount (1g to 7g) was dissolved in a solvent containing 50% (v/v) glacial acetic acid (as shown in Table 4.1) by continuous magnetic stirring for 24 hours to obtain 1% to 7% (w/v) chitosan solution. PEO (3g) was also dissolved in a solvent containing 50% (v/v) glacial acetic acid separately by overnight magnetic stirring. After that, a blend of each chitosan solution and PEO solution was prepared with 8:2 ratio respectively by four hours of continuous mixing. Every sample of chitosan solution were prepared with the addition of co-spinning agent PEO. As an example, 8 parts of the 1% (w/v) chitosan solution is mixed with 2 parts of 3% (w/v) PEO solution to obtain the solution for electrospinning of sample N1 TO N4 in Table 1. This means that the final electrospinning solution contains 0.8% (w/v) of chitosan and 0.6% (w/v) PEO. However, in all the prepared samples percentage contribution of PEO remained 0.6% due to its fixed solution ratio, while chitosan percentages were increased with increase of solution percentage. The solubility of chitosan in glacial acetic acid enables the process to be non-toxic and eco-friendly with respect to solvent usage.
TABLE I ELECTROSPINNING PROCESS OPTIMISATION PLAN WITH DIFFERENT % OF CHITOSAN|
Sample ID |
Chitosan Solution (%) |
Spinning Solution |
Voltage (kV) |
Working Distance (cm) |
|---|---|---|---|---|
|
N1 |
1 |
0.8 |
15 |
15 |
|
N2 |
1 |
0.8 |
15 |
10 |
|
N3 |
1 |
0.8 |
20 |
15 |
|
N4 |
1 |
0.8 |
20 |
10 |
|
N5 |
2 |
1.6 |
15 |
15 |
|
N6 |
2 |
1.6 |
15 |
10 |
|
N7 |
2 |
1.6 |
20 |
15 |
|
N8 |
2 |
1.6 |
20 |
10 |
|
N9 |
3 |
2.4 |
15 |
15 |
|
N10 |
3 |
2.4 |
15 |
10 |
|
N11 |
3 |
2.4 |
20 |
15 |
|
N12 |
3 |
2.4 |
20 |
10 |
|
N13 |
4 |
3.2 |
15 |
15 |
|
N14 |
4 |
3.2 |
15 |
10 |
|
N15 |
4 |
3.2 |
20 |
15 |
|
N16 |
4 |
3.2 |
20 |
10 |
|
N17 |
5 |
4 |
15 |
15 |
|
N18 |
5 |
4 |
15 |
10 |
|
N19 |
5 |
4 |
20 |
15 |
|
N20 |
5 |
4 |
20 |
10 |
|
N21 |
6 |
4.8 |
15 |
15 |
|
N22 |
6 |
4.8 |
15 |
10 |
|
N23 |
6 |
4.8 |
20 |
15 |
|
N24 |
6 |
4.8 |
20 |
10 |
|
N25 |
7 |
5.6 |
15 |
15 |
|
N26 |
7 |
5.6 |
15 |
10 |
|
N27 |
7 |
5.6 |
20 |
15 |
|
N28 |
7 |
5.6 |
20 |
10 |
Note. The % in the table refers to % of chitosan in the solution
C. ELECTROSPINNING PARAMETERSThe complete electrospinning phenomenon of Chitosan (CS) nanofibres production and their deposition on a rotating drum-based collector is pictorially explained in Figure 1. Each blended CS:PEO solution was filled in a 20 ml syringe and fitted on the pump with a tight screw holder. The needle blunt tip of a 19-gauge was used in the syringe to facilitate the desired flow. 1 mL/hour flow rate and 15kV to 20 kV voltages were applied for the production of nanofibres. The 10 cm distance between the needle tip and the PP substrate wrapped collector was set to generate adequate electric field for solution spinning. Sample identification of different % solution of chitosan and process parameters for electrospinning are shown in Table 1. All the experiments were performed in atmospheric condition (22±1 °C, 42-45% RH). Electrospinning process for each combination of CS/PEO solution was repeated thrice.
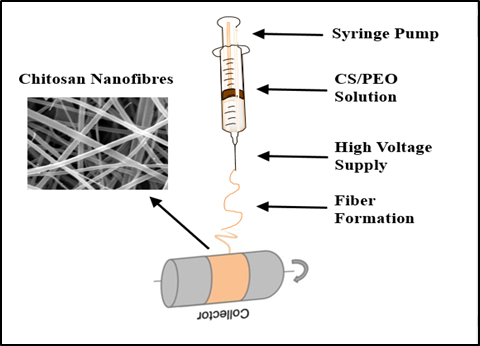
FIGURE 1. Electrospinning setup to produce Chitosan nanofibres
D. CHARACTERIZATIONThe surface morphology of electrospun chitosan-based nanofibres (CSNF) was evaluated by using high performance field emission scanning electron microscope (TESCAN MIRA3 GMU VP Analytical FESEM). Image analysis was performed at 15kv voltage. The average fibre diameter (100 fibres each sample) was examined by using ImageJ computer software. Randomly chosen three hundred nanofibres in each CS/PEO combination (as shown in Table 1) were selected for the quantification of surface morphology.
III. RESULTS AND DISCUSSION
All the combinations of different concentrations of chitosan were electrospun as per Table 1 process parameters. The results of all the samples are given in Table 2 and graphically shown in Figure 2.
TABLE II ELECTROSPINNING RESULTS OF ALL COMBINATIONS OF DIFFERENT % SOLUTIONS OF CHITOSAN| Sample ID | % Solution of Chitosan |
Voltage (kV) | Working Distance (cm) | Fibre Formation Results | Remarks | Average Fibre Diameter (nm) | SD |
|---|---|---|---|---|---|---|---|
| N1 | 1 | 15 | 15 | Fibres | Smooth Production | 130 | 54 |
| N2 | 1 | 15 | 10 | Fibres | Smooth Production | 163 | 61 |
| N3 | 1 | 20 | 15 | Fibres | Smooth Production | 91 | 19 |
| N4 | 1 | 20 | 10 | Fibres | Smooth Production | 115 | 43 |
| N5 | 2 | 15 | 15 | Fibres | Smooth Production | 172 | 31 |
| N6 | 2 | 15 | 10 | Fibres | Smooth Production | 207 | 53 |
| N7 | 2 | 20 | 15 | Fibres | Smooth Production | 135 | 27 |
| N8 | 2 | 20 | 10 | Fibres | Smooth Production | 155 | 53 |
| N9 | 3 | 15 | 15 | Fibres | Smooth Production | 185 | 28 |
| N10 | 3 | 15 | 10 | Fibres | Smooth Production | 227 | 53 |
| N11 | 3 | 20 | 15 | Fibres | Smooth Production | 154 | 23 |
| N12 | 3 | 20 | 10 | Fibres | Smooth Production | 175 | 46 |
| N13 | 4 | 15 | 15 | No Fibre | Solution wastage | N/A | N/A |
| N14 | 4 | 15 | 10 | Beaded Fibres | Solution wastage | N/A | N/A |
| N15 | 4 | 20 | 15 | No Fibre | Solution wastage | N/A | N/A |
| N16 | 4 | 20 | 10 | No Fibre | Solution wastage | N/A | N/A |
| N17 | 5 | 15 | 15 | No Fibre | Solution wastage | N/A | N/A |
| N18 | 5 | 15 | 10 | No Fibre | Solution wastage | N/A | N/A |
| N19 | 5 | 20 | 15 | No Fibre | Solution wastage | N/A | N/A |
| N20 | 5 | 20 | 10 | No Fibre | Solution wastage | N/A | N/A |
| N21 | 6 | 15 | 15 | No Fibre | Solution wastage | N/A | N/A |
| N22 | 6 | 15 | 10 | No Fibre | Solution wastage | N/A | N/A |
| N23 | 6 | 20 | 15 | No Fibre | Solution wastage | N/A | N/A |
| N24 | 6 | 20 | 10 | No Fibre | Solution wastage | N/A | N/A |
| N25 | 7 | 15 | 15 | No Fibre | Solution wastage | N/A | N/A |
| N26 | 7 | 15 | 10 | No Fibre | Solution wastage | N/A | N/A |
| N27 | 7 | 20 | 15 | No Fibre | Solution wastage | N/A | N/A |
| N28 | 7 | 20 | 10 | No Fibre | Solution wastage | N/A | N/A |
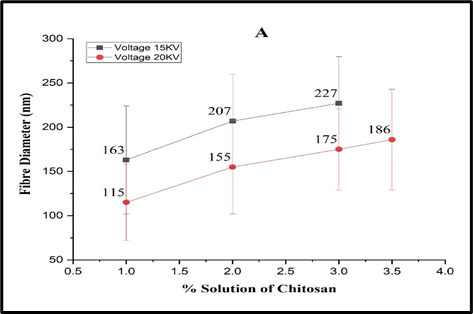
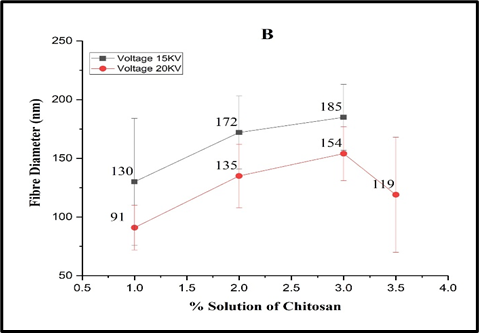
FIGURE 2. &nbasp;Impact of voltage and working distance on nanofibre diameter (A) voltage impact on fibre diamter at 10cm working distance, (B) votage impact on fibre diameter at 15cm working distance
A. (1%) CHITOSAN CONTAINING NANOFIBRESExperimental results of 1% solution of chitosan nanofibres on two different working distance and high voltages are shown in Table 2 with samples from N1 to N4. All four samples showed smooth chitosan nanofibres without beads. Figure 3 shows the surface morphology of samples N1 and N2 which were produced at 15kv voltage while keeping the working distance at 15cm and 10cm respectively. Results indicate that the average fibre diameter for sample N1 was 130nm, while the maximum and minimum fibre diameter was 56nm and 267nm respectively. In the case of sample N2, the average fibre diameter remained around 163nm, while the maximum and minimum fibre diameter was 66nm and 286nm respectively. Sample N1 showed thinner fibre than sample N2, due to longer working distance.
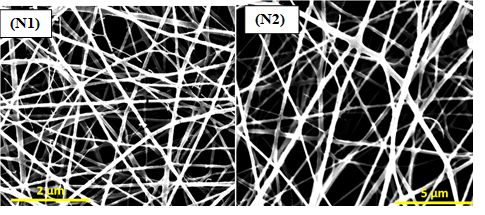
FIGURE 3. SEM image of 1% chitosan containing nanofibres at 15kv voltage with (N1) working distance 15cm, (N2) working distnace 10cm
Figure 4 shows the surface morphology of samples N3 and N4 which were produced at 20kv voltage while keeping the working distance at 15cm and 10cm respectively. Chitosan nanofibres produced from both samples are uniform and bead free. The average fibre diameter for sample N3 was 91nm, while the maximum and minimum fibre diameter was 28nm and 137nm respectively. In case of sample N4, the average fibre diameters were 115nm, while the maximum and minimum fibre diameter value remained at 55nm and 235nm respectively. Sample N3 also showed thinner fibre than the sample N4, due to a longer working distance.
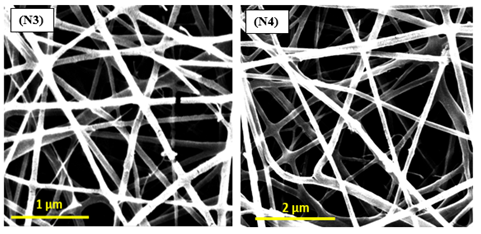
FIGURE 4. SEM image of 1% chitosan containing nanofibres at 20kv voltage with (N3) working distance 15cm, (N4) working distnace 10cm
In general, long working distance promotes higher draft in the polymer jet during electrospinning. However, bending instability (whipping instability) of the jet in the presence of an electric field is also very important in this phenomenon. Therefore, longer working distance accounts for higher whipping instability of the jet and is responsible for the reduction of the diameter of resultant fibre due to the acceleration and higher stretching before the fibre deposition on collector [28]. As a result, fibre diameter reduces with the increase of working distance, as shown by the thinner fibres of samples N1 and N3 compared with those of samples N2 and N4.
Apart from the working distance, applied voltage is also very important to study regarding nanofibres morphology. Results showed that the average fibre diameter of chitosan nanofibres was also reduced with the increase of applied voltage from 15kv to 20kv, with the same working distance as reported in Table 2 and Figure 2. The average fibre diameter for samples N1 and N3 remained at 183nm and 71nm having applied voltage 15kv and 20kv respectively. Similarly, sample N2 and N4 also showed same results pattern with the increase of applied voltage respectively. Hence it can be seen that applied electric field has inverse impact on fibre diameter and fibre diameter reduces with the increase of higher voltage, due to higher stretch induced in the polymer jet. Applied higher voltage generally determines the strength of the electric field, the amount of charge carried by the polymer jet and the strength of the interaction between the jet and applied electric field. A higher voltage will lead to higher stretching of the polymer jet and thinner fibre formation [29].
B. (2%) CHITOSAN CONTAINING NANOFIBRESExperimental results of 2% concentration of chitosan nanofibres on two different working distances and high voltages are shown in Table 2 and Figure 2 with sample identification from N5 to N8. All four samples showed uniform production of chitosan nanofibres without beads formation. Figure 5 shows the surface morphology of sample N5 and N6 at 15kv applied voltage while keeping the path length 15cm and 10cm respectively. Results illustrated that the average fibre diameter value for sample N5 was 172nm, while maximum and minimum fibre diameter value achieved 69nm and 315nm respectively. In the case of sample N6, average fibre diameters value reported 207nm, while maximum and minimum fibre diameter value achieved 78nm and 321nm respectively. However, sample N5 showed finer fibre production as compared to sample N6, due to longer working distance.
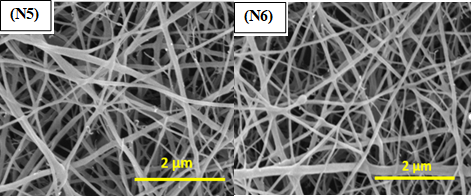
FIGURE 5. SEM image of 2% chitosan containing nanofibres at 15kv voltage with (N5) working distance 15cm, (N6) working distnace 10cm
Surface morphology of sample N7 and N8 is showed in Figure 6, which were fabricated at 20kv voltage while keeping the working distance 15cm and 10cm respectively. Both samples of chitosan reported smooth and uniform production of nanofibres as shown in Figure 6. Results indicated that the average fibre diameter value for sample N7 was 135nm while maximum and minimum fibre diameter value achieved 57nm and 296nm respectively as reported in Table 2 and Figure 2. In the case of sample N8, average fibre diameters value recorded 155nm, while maximum and minimum fibre diameter value remained 63nm and 305nm respectively. Comparatively, sample N7 also showed finer diameter fibre production from sample N8 due to the impact of path length.
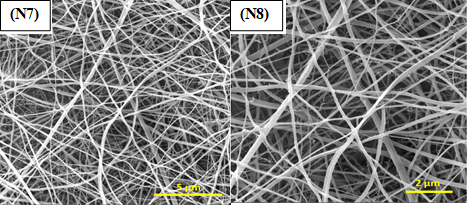
FIGURE 6. SEM image of 2% chitosan containing nanofibres at 20kv voltage with (N7) working distance 15cm, (N8) working distnace 10cm
As explained in the previous section, working distance plays an important role in the finer fibre production. Longer path length and whipping instability lead to higher stretch and elongation of the polymer jet during the acceleration from tip to the collector. As a resultant, fibre diameter reduces with the increase of working distance. Conclusively, the same theory applies here in all four samples of 2% chitosan concentrated nanofibres and as a resultant, fibre diameter reduced with the increase of working distance. In addition to tip to collector path length, a higher value of applied voltage also reduced the diameter of developed nanofibres. Results showed that the average fibre diameter of chitosan nanofibres was also reduced with the increase of applied voltage from 15kv to 20kv, having the same working distance as reported in Table 2 and Figure 2. Average fibre diameter for sample N5 and N7 remained 172nm and 135nm having applied voltage 15kv and 20kv respectively. Similarly, sample N6 and N8 also showed similar results with the increase of applied voltage. According to literature, polymer jet stretching of the polymer jet and will favour thinner fibre formation due to the strong electric field [30]. Therefore, the same theory applied here in all samples of 2% chitosan concentrated fabricated nanofibres.
C. (3%) CHITOSAN CONTAINING NANOFIBRESExperimental results of 3% concentrated chitosan nanofibres are shown in Table 2 and Figure 2 with sample identification from N9 to N12. All four samples showed a smooth production of chitosan nanofibres.
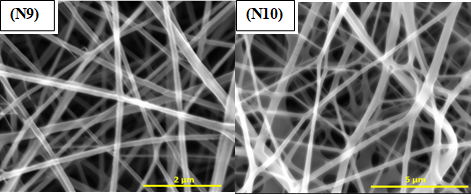
FIGURE 7. SEM image of 3% chitosan containing nanofibres at 15kv voltage with (N9) working distance 15cm, (N10) working distnace 10cm
Figure 7 shows the surface morphology of sample N9 and N10 which were produced at 15kv voltage while keeping the working distance 15cm and 10cm respectively. Furthermore, the average fibre diameter value for sample N9 was 185nm, while maximum and minimum fibre diameter value achieved 72nm and 317nm respectively.
In case of sample N10, average fibre diameters value remained 227nm, while maximum and minimum fibre diameter value achieved 80nm and 325m respectively. However, sample N9 showed thinner fibre production from sample N10, due to prolonged working distance during electrospinning.
Figure 8 shows the surface morphology of sample N11 and N13 which were produced at 20kv voltage while keeping the working distance 15cm and 10cm respectively. Results indicated that the average fibre diameter value for sample N11 was 154nm, while maximum and minimum fibre diameter value achieved 61nm and 302nm respectively. In the case of sample N12, average fibre diameters value recorded 175nm, while maximum and minimum fibre diameter value remained 66nm and 327nm respectively. Comparatively, sample N11 also showed thinner fibre production from sample N12, due to longer path length from tip to the collector.
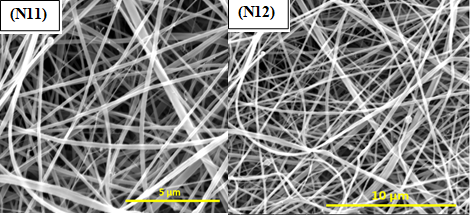
FIGURE 8. SEM Image of 3% chitosan containing nanofibres at 20kv voltage with (N11) working distance 15cm, (N12) working distnace 10cm
Results also showed that the average fibre diameter of chitosan nanofibres was also reduced with the increase of applied voltage from 15kv to 20kv, having the same working distance as reported in Table 2 and Figure 2. Average fibre diameter for sample N9 and N11 remained 185nm and 154nm having applied voltage 15kv and 20kv respectively. Similarly, sample N10 and N12 also showed similar results with the increase of applied voltage. Impact of working distance and applied high voltage already explained in previous sections and similar reasons of finer fibre production applied in all samples of 3% chitosan concentration.
D. (4% TO 7%) CHITOSAN CONTAINING NANOFIBRESResults of nanofibre production for all the samples of different concentrations of chitosan are reported in Table 2 and Figure 2. Results showed that nanofibre production remained smooth from 1% to 3% solution of chitosan. However, fibre production was not achieved at 4% and above chitosan concentrations due to gel formation of the prepared solution for electrospinning. At higher concentration, solution wastage was higher and the electrospinning process was unsuccessful due to the cohesive nature and higher viscosity of chitosan solution. Furthermore, the higher concentration of chitosan increases the amount of strong hydrogen bonding between –NH2 and –OH2 groups of chitosan molecules and hinders the flow of polymer solution which yields the unspinnable results. Therefore, higher voltage above 20kv with adjustments in working distance, solvent and co-spinning agent concentrations were required to further investigate the possibility of nanofibre production for 4% and above chitosan concentrations.
However, the experimental plan was modified to investigate the possibility of nanofibres production at 3.5% solution concentration of chitosan by keeping the process parameters same as per Table 2 and Figure 2. Detailed process parameters of 3.5% chitosan concentrated samples are shown in Table 3 and results of nanofibre production are explained in Table 4.
TABLE III ELECTROSPINNING PROCESS PARAMETERS FOR 3.5% CHITOSAN CONCENTRATION NANOFIBRES PRODUCTION| Sample ID | Chitosan Solution (%) | Spinning Solution of Chitosan (%) | Voltage | Working Distance (cm) |
|---|---|---|---|---|
| N29 | 3.5 | 2.8% | 15 | 15 |
| N30 | 3.5 | 2.8% | 15 | 10 |
| N31 | 3.5 | 2.8% | 20 | 15 |
| N32 | 3.5 | 2.8% | 20 | 10 |
Note. The % in the table refers to % of chitosan in the solution
E. (3.5%) CHITOSAN CONTAINING NANOFIBRESExperimental results of 3.5% concentrated chitosan nanofibres are shown in Table 4 with sample identification from N29 to N32. The SEM analysis was performed to analyse the surface morphology of all CSNF produced samples (Figure 8 & 9).
TABLE IV ELECTROSPINNING RESULTS OF 3.5% CHITOSAN CONCENTRATION NANOFIBRES| Sample ID | % Solution of Chitosan | Voltage (kV) | Working Distance (cm) | Fibre Formation Results | Remarks | Average Fibre Diameter (nm) | SD |
|---|---|---|---|---|---|---|---|
| N29 | 3.5 | 15 | 15 | No Fibre | Solution wastage | N/A | N/A |
| N30 | 3.5 | 15 | 10 | No Fibre | Solution wastage | N/A | N/A |
| N31 | 3.5 | 20 | 15 | Fibres | Low Production and solution waste | 119 | 49 |
| N32 | 3.5 | 20 | 10 | Fibres | Smooth Production | 186 | 57 |
In the case of sample N29 and N30, fibre production remained unsuccessful and solution wastage was higher due to higher surface tension. The applied voltage for both samples was 15kv, which hindered to cope with the surface tension of the prepared solution due to the higher concentration of chitosan molecules. Furthermore, longer working distance also prevented the fibre production for sample N29. Therefore, higher voltage and shorter path length were required to fabricate the 3.5% chitosan concentrated solution.
Figure 9 shows the surface morphology of sample N31 which was electrospun at 20kv voltage and 15cm working distance. Results indicated that the average fibre diameter value for sample N31 was 119nm, while maximum and minimum fibre diameter value achieved 59nm and 296nm respectively. Produced nanofibres were smooth and uniform. However, solution wastage was also observed due to high flow rate and longer working distance and fibre productivity also remained low. At the same flow rate, working distance plays an important ole towards produced electrify field at same applied voltage. Longer path length weakens the strength of the applied electric field, which is required to cope surface tension of polymer solution for the acceleration and deposition of a jet in the form of fibre. Therefore, due to greater working distance, the applied electric field was not sufficient to electrospun the supplied quantity of chitosan solution. As a resultant, solution wastage was also observed parallel to chitosan nanofibre production.
FIGURE 9.SEM image of 3.5% chitosan containing nanofibres at 20kv voltage with 15cm working distance
The SEM analysis of sample N32 depicted that produced nanofibres are smooth and beads free (Figure 10). Histogram for the explanation of fibre diameter distribution is also presented in Figure 11. The analysis elaborated that produced chitosan nanofibres were consist of diameter range from 43 nm to 336 nm with an average of 186 nm. Furthermore, fibre productivity was also improved due to the short working distance of 10cm and greater strength of the applied electric field at 20kv voltage. Therefore, nanofibres were successfully produced with a wide range of fibre diameter and the higher concentration of chitosan which was desirable to investigate the antibacterial property against gram negative bacterial species. Furthermore, Addition of these fine nanofibres will be helpful to develop respiratory filters having higher surface area and better filtration performance to cope with the possible causes of respiratory diseases in textile workers.
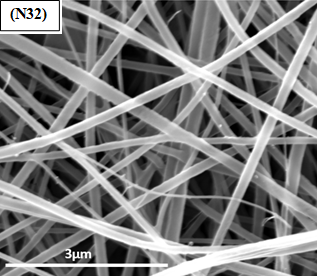
FIGURE 10. SEM Image Of 3.5% chitosan containing nanofibres at 20kv voltage with 10cm working distance
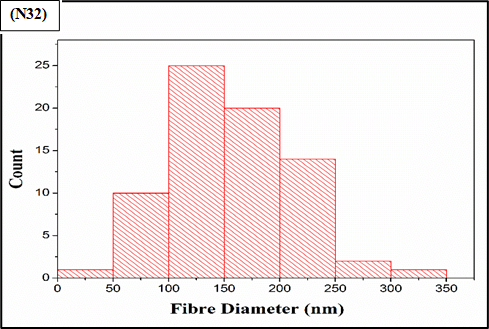
FIGURE 11.Fibre diameter (Nm) histogram of 3.5% chitosan containing nanofibres at 20kv voltage with 10cm working distance
IV. CONCLUSION
This study successfully established optimal conditions for the production of chitosan nanofibers through electrospinning, emphasizing the critical influence of voltage and working distance on achieving finer fiber diameters. The limitation of fiber production at concentrations above 3% highlights the challenges associated with high viscosity and surface tension in chitosan solutions. However, the successful generation of smooth nanofibers at a 3.5% concentration opens avenues for further applications. The resulting chitosan nanofibers, characterized by their elevated concentration, hold significant promise for the development of composite materials specifically designed for respiratory filtration. These findings contribute to the broader field of nanofiber technology, particularly in applications that require enhanced filtration performance, such as air purification and biomedical uses. Future research will focus on integrating these highly concentrated nanofibers into composite structures to assess their effectiveness as respiratory filters, aiming to harness the inherent antimicrobial properties of chitosan for improved filtration solutions.
CONFLICT OF INTEREST
The authors of the manuscript have no financial or non-financial conflict of interest in the subject matter or materials discussed in this manuscript.
DATA AVAILABILITY STATEMENT
The data associated with this study will be provided by the corresponding author upon request.
FUNDING DETAILS
No funding has been received for this research.
REFERENCES
- D. J. Lockwood, “Overview of the electrospinning,” in Electrospun Nanofibers for Energy and Environmental Applications, B. Ding and J. Yu, Eds., Springer-Verlag Berlin, 2014.
- D. J. Lockwood, “Basic principles,” in Electrospun Nanofibers for Energy and Environmental Applications, B. Ding and J. Yu, Eds., Springer-Verlag Berlin, 2014.
- X. Geng, O. H. Kwon, and J. Jang, “Electrospinning of chitosan dissolved in concentrated acetic acid solution,” Biomaterials, vol. 26, no. 27, pp. 5427–5432, Sep. 2005, doi: https://doi.org/10.1016/j.biomaterials.2005.01.066.
- H. Homayoni, S. A. H. Ravandi, and M. Valizadeh, “Electrospinning of chitosan nanofibers: Processing optimization,” Carbohydr. Polym., vol. 77, no. 3, pp. 656–661, July 2009, doi: https://doi.org/10.1016/j.carbpol.2009.02.008.
- M. Cao, F. Gu, C. Rao, J. Fu, and P. Zhao, “Improving the electrospinning process of fabricating nanofibrous membranes to filter PM2.5,” Sci. Total Environ., vol. 666, pp. 1011–1021, May 2019, doi: https://doi.org/10.1016/j.scitotenv.2019.02.207.
- S. H. Ali, M. A. Mahammed, and S. A. Yasin, “Characterization of electrospinning chitosan nanofibers used for wound dressing,” Polymers, vol. 16, no. 14, Art no. 1984, July 2024, doi: https://doi.org/10.3390/polym16141984.
- G. R. C. Cerqueira et al., “Development of PVA/chitosan nanofibers by a green route using solution blow spinning,” J. Polym. Environ., vol. 32, no. 3, pp. 1489–1499, Mar. 2024, doi: https://doi.org/10.1007/s10924-023-03033-3.
- V. Kadam, I. L. Kyratzis, Y. B. Truong, J. Schutz, and L. Wang, “Electrospun bilayer nanomembrane with hierarchical placement of bead-on-string and fibers for low resistance respiratory air filtration,” Sep. Purif. Technol., vol. 224, no. 1, pp. 247–254, Oct. 2019, doi: https://doi.org/10.1016/j.seppur.2019.05.033.
- M. Liu, X. P. Duan, Y. M. Li, D. P. Yang, and Y. Z. Long, “Electrospun nanofibers for wound healing,” Mater. Sci. Eng. C, vol. 76, pp. 1413–1423, July 2017, doi: https://doi.org/10.1016/j.msec.2017.03.034.
- K. Sun and Z. H. Li, “Preparations, properties and applications of chitosan based nanofibers fabricated by electrospinning,” Exp. Polym. Lett., vol. 5, no. 4, pp. 342–361, 2011, doi: https://doi.org/10.3144/expresspolymlett.2011.34.
- U. Habiba et al., “Effect of deacetylation on property of electrospun chitosan/PVA nanofibrous membrane and removal of methyl orange, FE(III) and Cr(VI) ions,” Carbohydr. Polym., vol. 177, pp. 32–39, Dec. 2017, doi: https://doi.org/10.1016/j.carbpol.2017.08.115
- K. Kurita, “Chitin and chitosan: Functional biopolymers from marine crustaceans,” Marine Biotechnol., vol. 8, no. 3, pp. 203–226, Mar. 2006, doi: https://doi.org/10.1007/s10126-005-0097-5.
- P. B. Malafaya, G. A. Silva, and R. L. Reis, “Natural-origin polymers as carriers and scaffolds for biomolecules and cell delivery in tissue engineering applications,” Adv. Drug. Deliv. Rev., vol. 59, no. 4–5, pp. 207–233, May 2007, doi: https://doi.org/10.1016/j.addr.2007.03.012.
- T. V Shakola et al., “The first electrochemical N-arylation of chitosan. Antibacterial effect of novel cationic chitosan derivatives,” Eur. Polym. J., vol. 198, Art. no. 112418, Oct. 2023, doi: https://doi.org/10.1016/j.eurpolymj.2023.112418.
- K. M. Vårum, M. M. Myhr, R. J. N. Hjerde, and O. Smidsrød, “In vitro degradation rates of partially N-acetylated chitosans in human serum,” Carbohydr. Res., vol. 299, no. 1–2, pp. 99–101, Mar. 1997, doi: https://doi.org/10.1016/S0008-6215(96)00332-1.
- P. J. VandeVord, H. W. T. Matthew, S. P. DeSilva, L. Mayton, B. Wu, and P. H. Wooley, “Evaluation of the biocompatibility of a chitosan scaffold in mice,” J. Biomed. Mater. Res., vol. 59, no. 3, pp. 585–590, 2002, doi: https://doi.org/10.1002/jbm.1270.
- K. Piekarska, M. Sikora, M. Wi, and M. Owczarek, “Chitin and chitosan as polymers of the future — Obtaining, modification, life cycle assessment and main directions of application,” Polymers, vol. 15, no. 4, Art. no. 793, 2023, doi: https://doi.org/10.3390/polym15040793.
- Z. Liu, K. Wang, X. Peng, and L. Zhang, “Chitosan-based drug delivery systems: Current strategic design and potential application in human hard tissue repair,” Eur. Polym. J., vol. 166, no. 14, Art. no. 110979, Mar. 2022, doi: https://doi.org/10.1016/j.eurpolymj.2021.110979.
- X. Dong et al., “Chitin/Chitosan nanofibers toward a sustainable future: From hierarchical structural regulation to functionalization applications,” Nano. Lett., vol. 24, no. 39, pp. 12014–12026, Oct. 2024, doi: https://doi.org/10.1021/acs.nanolett.4c02632.
- M. T. Khawar, H. Gong, Q. Zia, H. H. Nawaz, and J. Li, “Chitosan nanofibres and polypropylene meltblown substrate based multilayer respiratory filter for byssinosis prevention,” J. Indust. Text., vol. 52, p. 1–6, 2022, doi: https://doi.org/10.1177/15280837221111173.
- E. I. Rabea, M. E.-T. Badawy, C. V. Stevens, G. Smagghe, and W. Steurbaut, “Chitosan as antimicrobial agent: Applications and mode of action chitosan as antimicrobial agent: Applications and mode of action,” Biomacromolecules, vol. 4, no. 6, pp. 1457–1465, Sep. 2003, doi: https://doi.org/10.1021/bm034130m
- H. Sashiwa and S. I. Aiba, “Chemically modified chitin and chitosan as biomaterials,” Prog. Poly. Sci., vol. 29, no. 9, pp. 887–908, Sep. 2004, doi: https://doi.org/10.1016/j.progpolymsci.2004.04.001.
- E. A. El-hefian, M. M. Nasef, and A. H. Yahaya, “Chitosan physical forms: A short review,” Aust. J. Basic. Appl. Sci., vol. 5, no. 5, pp. 670–677, 2011.
- Q. Zia et al., “Porous poly (L–lactic acid)/chitosan nanofibres for copper ion adsorption,” Carbohydr. Polym., vol. 227, Art. no. 115343, Jan. 2020, doi: https://doi.org/10.1016/j.carbpol.2019.115343.
- A. Cooper, R. Oldinski, H. Ma, J. D. Bryers, and M. Zhang, “Chitosan-based nanofibrous membranes for antibacterial filter applications,” Carbohydr. Polym., vol. 92, no. 1, pp. 254–259, 2013, doi: https://doi.org/10.1016/j.carbpol.2012.08.114.
- S. M. Lemma, F. Bossard, and M. Rinaudo, “Preparation of pure and stable chitosan nanofibers by electrospinning in the presence of poly (ethylene oxide),” Int. J. Mol. Sci., vol. 17, no. 11, Art. no. 1790, Oct. 2016, doi: https://doi.org/10.3390/ijms17111790.
- K. Liu et al., “Concurrent filtration and inactivation of bacteria using poly (vinyl alcohol-co-ethylene) nanofibrous membrane facilely modified using chitosan and graphene oxide,” Environ. Sci. Nano., vol. 4, no. 2, pp. 385–395, 2017, doi: https://doi.org/10.1039/c6en00364h.
- J. Xue, T. Wu, Y. Dai, and Y. Xia, “Electrospinning and electrospun nanofibers: Methods, materials, and applications,” Chem. Rev., vol. 119, no. 8, pp. 5298–5415, 2019, doi: https://doi.org/10.1021/acs.chemrev.8b00593.
- J. Hu, X. Wang, B. Ding, J. Lin, J. Yu, and G. Sun, “One-step electro-spinning/netting technique for controllably preparing polyurethane nano-fiber/net,” Macromol. Rapid. Commun., vol. 32, no. 21, pp. 1729–1734, Aug. 2011, doi: https://doi.org/10.1002/marc.201100343.