School System and Student Performance: Examining Science and Mathematics Achievement in Pakistan
Sadia Muzaffar Bhutta, Sohail Ahmad, and Aisha Naz Ansari*
Institute for Educational Development, Aga Khan University, Karachi, Pakistan
Abstract
Public and private school systems are the two largest providers of formal school education in Pakistan, differing significantly in their governance, resources, and practices. While previous studies showed differences in Student Learning Outcomes (SLOs), often favouring private schools, these comparisons remained largely descriptive. This paper compares elementary grade students’ performance in mathematics and science between public and private schools in Pakistan, accounting for factors such as grade level and geographical region. A cross-sectional survey was conducted with 15,391 students from grades 5, 6, and 8, selected through a multistage sampling technique from a total of¬¬ 153 public and private schools across 06 regions of Pakistan. Valid and reliable Science Achievement Tests (SATs) and Mathematics Achievement Tests (MATs) were directly administered to students. The results revealed that students in private schools demonstrated comparatively better understanding of both scientific and mathematical concepts than their counterparts in public schools. Of particular importance, regardless of the subject, the type of school system also predicted SLOs even after controlling for grade level and region. These findings contribute to the debate on comparative school performance in the context of developing countries, specifically in Pakistan. The study calls for targeted interventions to improve science and mathematics achievement in public schools and provides recommendations for policy, practice, and future research.
1. Introduction
Public and private school systems are the two largest providers of formal school education at K12 level in Pakistan. According to the national education statistics of Pakistan, the current student enrolment in public schools is 29.27 million (54%), whereas the private schools serve 24.56 million (46%) students in the country (Government of Pakistan, 2016). Although the statistics demonstrate a higher intake of students in government schools; recent evidence suggests a consistent upward trend in the enrolment of students in private schools (Government of Pakistan, 2016). In public schools, education is completely free, where the government bears all the expenses of the students including the provision of textbooks and, in some cases, also provides monthly stipend (for example, the stipend for girls Sindh and KP). Contrarily, private schools charge fee for providing education to the students. Their governance model also distinguishes the two systems from each other. For example, public schools are managed by the government which also recruits their teaching and non-teaching staff, whereas private schools are owned by individuals or organisations and mostly serve as for-profit organisations.
Given the long-standing issues of access to and quality of school education, the Government of Pakistan (GOP) allows private participation to increase student access as well as the quality of student learning. Ironically, exponential growth has been observed in the number of private schools across the country mainly for two reasons. Firstly, public schools have been losing public trust due to the general assumption that they provide low-quality education. Secondly, enrolling children in private schools has emerged as a "social norm'. Indeed, parents prefer to enrol their children in private schools instead of public (Akhter, 2017); even in low-cost private schools if they cannot afford high fee. Nevertheless, the role of private schools as a potential source of earning contributes to their expansion in many cases. All of this shows that the private school system has emerged as an alternative model aimed at fostering quality education (Kimenyi, 2013; Ohba, 2013). That said, the "mushroom expansion' of private schools raises many questions about the provision of quality education in these schools. For example, do private schools provide better quality education than public schools? Why do the parents prefer private schools over public schools?
Private schools have gained popularity as they present a viable choice to parents seeking quality education. Studies conducted across various regions, including Pakistan, consistently reveal parents' preference for private schools, especially in urban areas (Annual Status of Education Report [ASER], 2022). Comparative research (Akhter, 2017; ASER, 2020; Awan & Zia, 2015; Beese & Liang, 2010; Thapa, 2015) consistently highlights the tendency of private schools to surpass public schools in performance. This pattern holds true in other countries as well (Ndaji et al., 2016; Smith-Wooley et al., 2018; Nath, 2012; Thapa, 2015; Singh, 2014; Zuilkowski et al., 2018).
In Pakistan, studies have been conducted to examine the differences between private and public school systems; however, the analysis, in most of the cases, is limited to bivariate comparison of the performance of students enrolled in these two types of schools. While this analysis is extremely important to provide a foundation, the approach is rather simplistic as the effects of some important and relevant variables need to be controlled to assess the unique contribution of each school system in achieving better student learning outcomes or SLOs. These variables include students' level of education (grade level) and geographical region where they are enrolled in schools. The former is important to determine the effect of years of education spent in a particular system, while the latter reflects the effect of different education policies (decentralisation of education due to 18th amendment) in various geographical regions across the country.
Based on a recent nationwide study, this paper provides deeper insights into the comparison of the performance of students in public and private schools in Pakistan. Significantly, the study focuses on two core subjects - mathematics and science - to compare student learning in public and private schools after controlling the effects of grade level (5, 6, and 8) and regions (Punjab, Sindh, Khyber Pakhtunkhwa, Balochistan, Gilgit Baltistan, Azad Jammu & Kashmir). Moreover, it also presents the comparison of various content and cognitive domains (as defined in national curriculum) of the target subjects across public and private schools. Specifically, it answers the following research questions:
- Is there a significant difference in the performance of students in science and mathematics across public and private schools in Pakistan?
- Does school system (public and private) contribute to the differences in SLOs in science and mathematics after controlling for grade level (5, 6 & 8) and regions (Punjab, Sindh, Khyber Pakhtunkhwa, Balochistan, Gilgit Baltistan, Azad Jammu & Kashmir) across Pakistan?
Literature Review
What factors predict student learning has been a subject of extensive debate and inquiry. Various theoretical frameworks (e.g., Creemers & Kyriakides, 2018; Kyriakides, Creemers, & Panayiotou, 2018; Kyriakides, Creemers, & Charalambous, 2018), empirical evidence (e.g., Farooq et al., 2011; Gess-Newsome et al., 2019; Kraft et al., 2016; Mushtaq & Khan, 2012), and meta-analyses or syntheses (e.g., Kocak et al., 2021; Suhaini et al., 2020) have identified a plethora of factors associated with student learning. These factors encompass policy-level, school-level, class-level, teacher-level, and student-level variables (Creemers & Kyriakides, 2018; Kyriakides, Creemers, Panayiotou, 2018; Kyriakides, Creemers, Charalambous, 2018). Among these, the school itself emerges as a prominent determinant of student learning, encapsulating the entire educational experience, including the teaching and learning process. While all these factors hold significance in their own right, it is argued here that the school offers a comprehensive perspective, integrating the stakeholders, environment, and teaching-learning processes that collectively influence student learning. Hence, the school is considered as a potential predictor of student learning to explore its impact.
Given this perspective, one may ponder which type of school is more effective in predicting better learning outcomes, considering that there are two primary providers of school education, namely public and private schools. To understand the distinction between public and private schools in predicting superior learning outcomes, it is crucial to delve into their historical origins and the underlying socioeconomic and educational needs that resulted in their emergence.
The expansion of public schools in developing countries was observed in 19th century with an intention to increase educational accessibility for the underprivileged population (Apple, 2010). Recently, however, there are raising evidence indicating that education is hardly benefiting underprivileged individuals, as like it benefit the privileged ones (Bowles & Gintis, 2002; Pal, 2020). These concerns are more profound in, and relevant for, developing economies where educational opportunities are limited for many poor populations (Camelo & Ponczek, 2021) including Pakistan. The consistently declining quality of public schools in Pakistan is negatively affecting economically disadvantage families who have no alternative option to get education except public schools (Andrabi et al., 2002; Aslam, 2007). the other hand, those who afford private education have opted for alternative education, which resulted into mushroom growth of private schools (Naseer et al., 2010). Currently, the private schools provide educational opportunity for those who afford its fee, whereas public school cater children from underprivileged families (Andrabi et al., 2008).
Studies undertaken in various parts of the country reported that system of school has significant effect on the learning outcomes of children (e.g., Ahmed et al., 2013; Akhter, 2017; Beese & Liang, 2010; Mohammadpour & Shekarchizadeh, 2015; Thapa, 2015). The studies generally agree that students enrolled in private schools would tend to score higher in the core subjects such as mathematics and science. This is partly because of comparatively better learning resources and teaching force available in private schools (Organisation for Economic Cooperation and Development [OECD], 2019). Furthermore, in many cases, parents prefer to enrol their children in private school due to social desirability, better quality of education and infrastructure, and safe learning environment (Ajayi & Faremi, 2006; Andrabi et al., 2008; Ahmed et al., 2013; Akhter, 2017; Oketch et al., 2010). On the flip side, public schools generally do not provide such facilities due to limited resources and lack of teachers' accountability (Awan & Zia, 2015; Andrabi et al., 2008; Baum & Riley, 2019; Beese & Liang, 2010).
On a global scale, empirical studies have consistently demonstrated better performance of students enrolled in private schools in the subjects of science and mathematics (ASER, 2020; Awan & Zia, 2015; Beese & Liang, 2010; Thapa, 2015). The results of international large-scale assessments are also aligned with this pattern of findings, revealing better scores of private schools (Sakellariou, 2017). Among many other, the key contributing factors related to better performance of students including socioeconomic condition of students enrolled in private schools, and more parental education (French & Kingdon, 2010). Similarly, evidence from underdeveloped countries emphasizes that private schools struggle to provide greater learning opportunities for children (Alcott & Rose, 2016). A similar trend was noted in the neighbouring country – India – where students in private schools notably outperformed their peers in public schools (French & Kingdon, 2010; Goyal, 2009). Likewise, studies conducted in Pakistan indicate that private schools have a positive influence on student learning, as compared to government schools (Andrabi et al., 2010; 2011; Arif & Saqib, 2003). Given this backdrop, the current study aims to comprehensively compare the performance of elementary students in core subjects, namely science and mathematics, across public and private school systems in Pakistan.
Methodology
A cross-sectional survey was employed to collect data from a total of 153 schools, encompassing 78 public schools and 75 private schools, representing six regions of Pakistan (Punjab, Sindh, Khyber Pakhtunkhwa, Balochistan, Gilgit Baltistan, and Azad Jammu & Kashmir). These schools were randomly selected from 25 districts. Altogether, 15,391 students from grades 5, 6, and 8 participated in the study. The multistage cluster sampling technique was used to recruit the respondents. In the first stage, districts were randomly selected from each targeted region, ensuring proportionate representation based on population size. For example, a larger number of districts were selected from regions with a higher population density. Additionally, districts with diverse geographical locations within each province were included. In the second stage, explicit stratification based on the type of school (public and private) was applied and three schools were randomly selected from each stratum, resulting in six schools per district with an equal representation of the public and private sectors. Furthermore, implicit stratification was employed to ensure the inclusion of girls, boys, and co-education schools. From each school, all enrolled students in the target grades (5, 6 and 8) were invited to participate in the study. The sample size of 15,391 students was considered adequate based on the established sample size guidelines for educational research. Given the multistage sampling design and the large, diverse population under study, the selected sample provided sufficient power for the generalisability of results across the six regions of Pakistan. Additionally, Krejcie and Morgan's sample size table also supports this selection, as for large populations (over 1,000,000) a sample size of 384 or more is recommended for robust statistical analysis (Krejcie & Morgan, 1970). The selected sample size far exceeds the required sample size, thus provides confidence to generalise the findings for the target population.
The study utilised valid and reliable Science Achievement Tests (SATs) and Mathematics Achievement Tests (MATs) adapted from previous research to evaluate the SLOs in each grade. Each test encompassed four content domains – science (biology, physics, chemistry, earth science) and mathematics (number & operations, geometry-measurement, information handling, and algebra) – aligned with Pakistan's National Curriculum (NC)-2006. The questions evaluated various cognitive levels, including knowledge, application, and reasoning. The allocation of weights to items varied according to the content of NC-2006. The test formats included Multiple Choice Questions (MCQs) and Constructed Response Questions (CRQs). Grade 5 assessments consisted of 20 items (15 MCQs and 5 CRQs), while grades 6 and 8 assessments comprised 30 items (20 MCQs and 10 CRQs). In order to assess the internal consistency (reliability) of the tools, the value of Cronbach's alpha was computed for SATs and MATs. As presented in Table 1, these values fall in the satisfactory range (0.60 to 0.78) for both SATs and MATs across grades.
Table 1
Cronbach's Alpha Values of SATs and MATs across Grades
|
Test |
G5 |
G6 |
G8 |
|
Science |
0.60 |
0.82 |
0.69 |
|
Mathematics |
0.70 |
0.72 |
0.66 |
The tests were administered to the students in an examination setup in order to avoid peer influence. A standardised approach to test administration was used across the country following all ethical considerations committed to the Aga Khan University's Ethical Review Committee (ERC).
For the analysis of students' test scores, an initial step involved exploring overall scores and comparing them across the two school systems. Subsequently, a detailed analysis was conducted to assess performance across content and cognitive domains, further comparing outcomes between public and private schools. After cleaning, mean percentage scores were computed for variables measured at the interval level (students' test scores). In order words, students' scores in each subject, as well as at the domain level, were converted into mean percentage scores for standardised comparison. Categorical variables were treated differently. For example, variables with two categories were coded accordingly ("system of school' public = 1; private = 2). On the other hand, variables with multiple categories, such as region (Punjab =1; Sindh =2; Khyber Pakhtunkhwa=3; Balochistan = 4; Gilgit Baltistan = 5; Azad Jammu & Kashmir = 6) were first coded to identify each category to be utilised in the bivariate analysis. Subsequently, these multi-category variables were transformed into dummy variables (e.g., 0, 1) by considering one category as reference category. For example, Punjab and Grade 6 were considered as reference categories for region and grade, respectively.
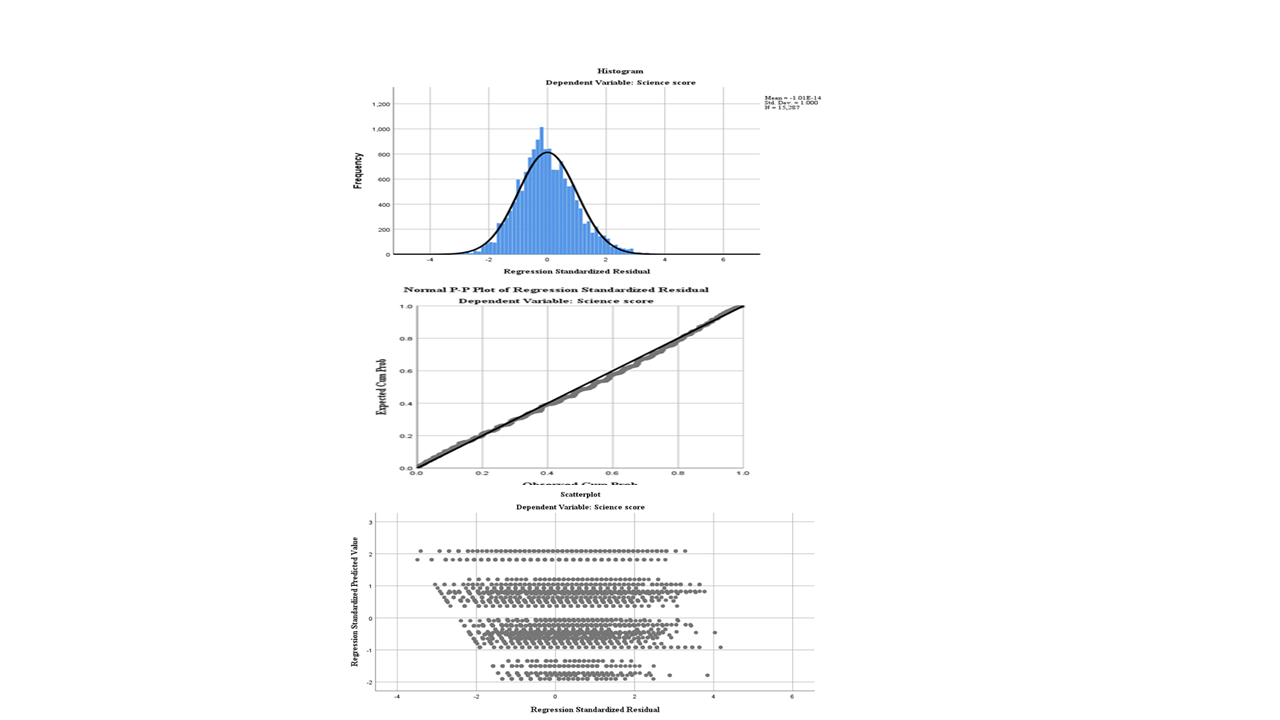
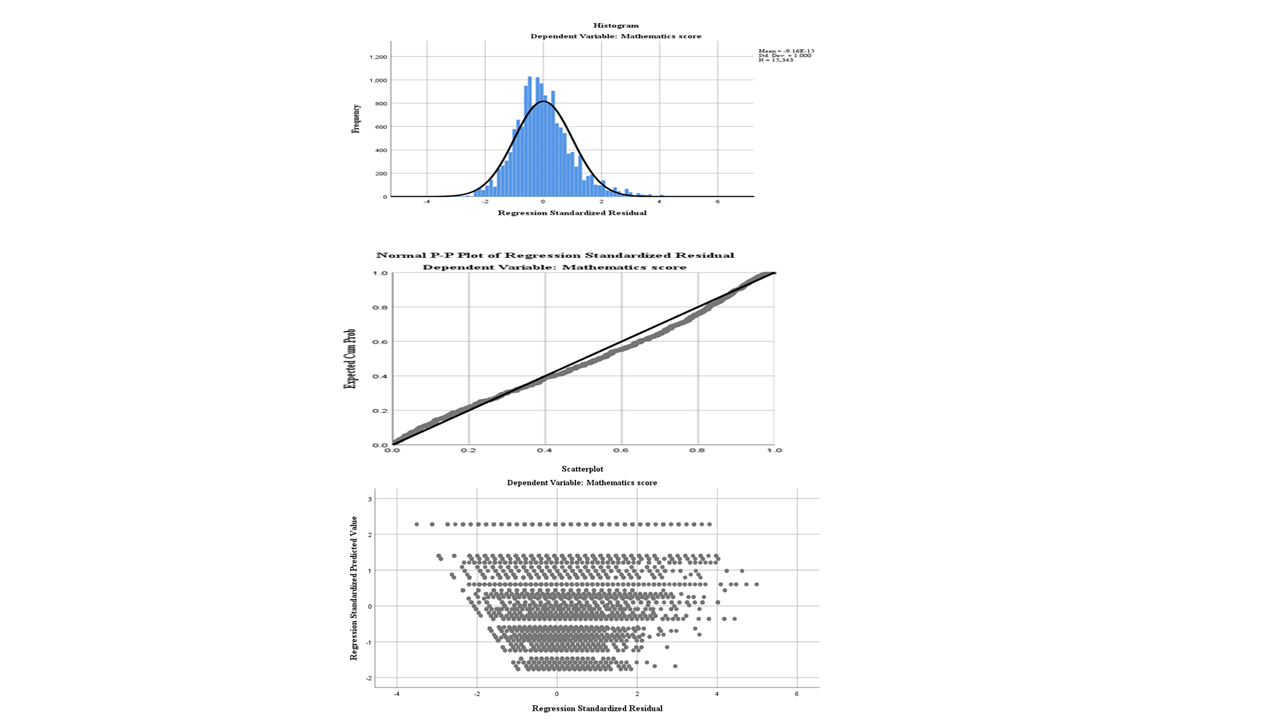
It is important to recall that different tests were used for each subject across three different grades. Test items were organised into four content domains in science and mathematics. The items were also distributed into three cognitive domains. The total marks were converted and presented in percentages to have a clear understanding of the results. On the other hand, marks in each content and cognitive domain were also distributed differently. Therefore, it was imperative to use percentages for making any sensible comparison at domain level. Students' responses in each test were coded in a way that each correct response received one mark, while an incorrect response was coded as zero. The characteristics of the distribution of learning outcomes as well as explanatory variables (measured at interval level) were then explored using the objective tests of normality (e.g., by comparing skewness and standard error of skewness) and homogeneity (e.g., Levene's test) (Field, 2017). This step helped to choose between parametric and non-parametric tests at the bivariate level according to the characteristics of the distribution. Since the data met the assumptions of normality and homogeneity of variance, therefore, independent t-test was used for bivariate comparison. For multivariate analysis, the distribution of residuals was observed (the characteristics of the distribution are discussed later in the relevant section). A stepwise method was used for running the multiple linear regression model. The residuals for all models were examined for the assumptions of normality, linearity, and homoscedasticity in order to reduce the chances of drawing a "biased conclusion from the results' (Field, 2017; Miles & Shevlin, 2000; Tabachnick & Fidell, 2013). The evidence of linearity, normality, and homoscedasticity for both models are given in Appendix A. Further, multicollinearity was assessed using the values of Variance Inflation Factor (VIF) and tolerance (Field, 2017). All the assumptions were met as all the values of tolerance were closed to 1, whereas the VIF values were below 2 in both models.
Results
This section is divided into three main sub-sections to present i) demographic characteristics of the participants; ii) comparative overview of students' performance across two systems of school; and iii) the results of multivariate analysis.
Demographic Characteristics of the Participants
As presented in Table 2, the pattern of sample distribution across regions mirrored the student population in the respective regions. For example, students from the largest region in terms of school population (Punjab) have a higher proportion (33%) in the sample. On the other hand, a reasonably smaller number of students (6% for both) participated from smaller regions (GB and AJK). Of the 15,391 students, a relatively larger number of students from public schools (n=9270; 60%) participated in this study than those from private schools. Following this pattern of distribution, students from the public sector schools were consistently greater in number than their counterparts from the private sector schools in all three grades (5, 6 and 8). Grade-wise distribution of students demonstrated almost their equal representation in the three target grades (Grade 5=33%; 6=35%, and 8=32%).
Table 2
Demographic Characteristics of Students
|
Demographics |
Frequency (%) |
|
|
Regions |
Punjab |
5040 (33%) |
|
Sindh |
3223 (21%) |
|
|
KP |
2609 (17%) |
|
|
Balochistan |
2587 (17%) |
|
|
GB |
1006 (6%) |
|
|
AJK |
926 (6%) |
|
|
System of School |
Public |
9270 (60%) |
|
Private |
6121 (40%) |
|
|
Grade |
5 |
5001 (33%) |
|
6 |
5405 (35%) |
|
|
8 |
4985 (32%) |
|
Comparison by School System in Science and Mathematics: Overall Performance
The data were analysed to explore the patterns of students' performance across the two school systems (public and private) for overall scores, as well as content and cognitive domains. Overall comparison across school systems is presented in Table 3.
Table 3
Students' Scores in Science and Mathematics across School Systems
|
|
Public M (SD) |
Private M (SD) |
Difference: Effect Size |
|
Science |
30 (14) |
40 (17) |
t(15285) = -39.65, p < 0.001, r=0.31; r2= 0.09 |
|
Mathematics |
24 (14) |
31 (17) |
t(15341) = -27.45, p < 0.001, r=0.216;r2=0.05 |
On average, students in private schools performed significantly better in science than their counterparts in public schools (p<0.001) with a medium effect size (r=0.31). The school system accounted for 9% variation in the students' scores in science. Overall, the students in private schools scored significantly higher in mathematics than their counterparts in public schools with a small magnitude of difference (p<0.001; r = 0.216). In other words, school system accounted for 5% of the variation in the total scores of mathematics.
Comparison by School System in Science: Content and Cognitive Domains
In order to get deeper insights from the comparison, students' performance in the content and cognitive domains (of science) was compared using the Mann-Whitney test. The results are presented below in Table 4.
Table 4
Students' Performance in Science Content and Cognitive Domains across School Systems
|
Domain |
Public M (SD) |
Private M (SD) |
Difference |
|
|
Content |
Biology |
35 (20) |
46 (22) |
U = 19680457.0, z = −30.5, p<0.001, r=0.25; r2 = 0.06 |
|
Physics |
29 (18) |
39 (20) |
U = 19629772.0, z = −31.11, p<0.001, r=0.25; r2 = 0.06 |
|
|
Chemistry |
23 (20) |
30 (24) |
U = 22748089.5, z = -19.181, p<0.001, r=0.15; r2 = 0.02 |
|
|
Earth science |
25 (31) |
36 (35) |
U = 23241959.0, z = -18.455, p<0.001, r=0.14; r2 = 0.02 |
|
|
Cognitive |
Knowledge |
34 (18) |
45 (20) |
U = 19115483.0, z = -32.65, p < 0.001, r=0.26; r2 = 0.07 |
|
Application |
31 (17) |
41 (20) |
U = 19344066.0, z = -31.82, p < 0.001, r=0.26; r2 = 0.07 |
|
|
Reasoning |
23 (19) |
31 (24) |
U = 22265955.0, z = -20.87, p < 0.001, r=0.17; r2 = 0.03 |
|
The difference in students' scores by school system is mirrored in the overall results of content domains, as depicted in Table 4. Students in private schools consistently outperformed their counterparts in public schools in all four content domains (p<0.001 for all), yet the magnitude of the difference was small. In other words, school system explained 6% variance for both biology and physics, while 2% for chemistry and earth-science.
Cross-comparisons across school systems (public and private) were also made for cognitive domains. As depicted in Table 4, students of private schools scored significantly higher in all three cognitive domains than their counterparts in public schools (p<0.001; for all) with a small magnitude. School system accounted for 7% for both knowledge and application, which dropped for high order domain, that is, reasoning (3%). It is important to highlight that the scores of both public and private school students consistently declined in higher-order domains.
Comparison by School System in Mathematics: Content and Cognitive Domains
Table 5 illustrates students' performance by school system in various content and cognitive domains in mathematics.
Table 5
Students' Performance in Science Content and Cognitive Domains across School Systems
|
Domain |
Public M (SD) |
Private M (SD) |
Difference |
|
|
Content |
Number & Operation |
25 (16) |
31 (18) |
U=22438695.0, z= −20.96, p<0.001, r=0.169; r2 =0.029 |
|
Geometry-measurement |
25 (18) |
31 (20) |
U = 22715757.0, z = -20.00, p < 0.001, r=0.162; r2 =0.026 |
|
|
Information Handling |
37 (41) |
47 (42) |
U = 24369250.5, z = -14.41, p<0.001, r=0.117; r2 =0.014 |
|
|
Algebra |
15 (17) |
21 (23) |
U = 10610438.5, z = -14.35, p < 0.001, r=0.141; r2 =0.020 |
|
|
Cognitive |
Knowledge |
24.5 (16.5) |
33.5 (18.5) |
U = 21023750, z = -26.25, p < 0.001, r=0.212; r2 = 0.045 |
|
Application |
22 (16.1) |
28 (19.7) |
U = 22938831.5, z = -19.10, p < 0.001, r=0.154; r2 = 0.024 |
|
|
Reasoning |
28.4 (25.2) |
34.3 (27.6) |
U = 24543486, z = -13.20, p < 0.001, r=0.107; r2 = 0.011 |
|
Private school students consistently outperformed their public school counterparts in all content domains of mathematics (p<0.001; for all); however, the magnitude of the difference was substantially low for all. In other words, school system accounted for 14% of the variance for information handling, followed by 3% for both "number and operation' and "geometry and measurement', and 2% for "algebra'.;
Private school students found questions related to all three domains relatively easier than their public school counterparts (p<0.001; for all); however, the magnitude of difference fell in the category of small effect size. School system explained 4.5%, 2%, and 1% of variation in scores for knowledge, application, and reasoning domains, respectively.
Differences in Students' Performance by School System after Controlling for Grade Level and Region
Multiple linear regression analysis was used to examine the unique contribution of each school system, after controlling for two predictors (grade level and region). Two models, one each for science and mathematics, are presented in Table 6. In these models, students' mean percentage score in each subject was regressed upon three predictors including school system (public vs. private), grade level (5, 6, & 8), and region (Punjab, Sindh, Khyber Pakhtunkhwa, Balochistan, Gilgit Baltistan, Azad Jammu & Kashmir).
Overall, these models explain 25% and 28% of the variance in students' performance in science (Adjusted R2 = 0.250) and mathematics (Adjusted R2 = 0.282), respectively. The ANOVA statistics show that both science [F (8, 15278) = 637.27, p<0.001] and mathematics [F (8, 15334) = 752.41, p<0.001] models have a significant linear relationship.
Table 6
Variation in Students' Performance by School System after Controlling for Grade and Region
|
Predictors |
Science |
Mathematics |
||
|
β |
t |
β |
t |
|
|
Constant |
|
75.01 |
|
60.478 |
|
System of school (Public vs Private) |
0.315*** |
44.722 |
0.229*** |
33.207 |
|
Grade 5^ |
-0.063*** |
-7.919 |
0.265*** |
33.964 |
|
Grade 8^ |
-0.294*** |
-36.771 |
-0.151*** |
-19.393 |
|
Sindh^^ |
-0.211*** |
-26.498 |
-0.208*** |
-26.658 |
|
KP^^ |
-0.271*** |
-34.552 |
-0.259*** |
-33.712 |
|
Balochistan^^ |
-0.236*** |
-29.94 |
-0.294*** |
-38.218 |
|
GB^^ |
-0.110*** |
-14.74 |
-0.157*** |
-21.581 |
|
AJK^^ |
-0.159*** |
-21.447 |
-0.177*** |
-24.541 |
|
|
R2=0.250 [F (8, 15278) = 637.27, p<0.001] |
R2=0.282 [F (8, 15334) = 752.41, p<0.001] |
||
|
Note. ***p<0.001; Reference categories, ^Grade 6 and ^^Punjab |
||||
School system was found to be the strongest predictor of students' performance in science (β=0.315), whereas it also made a significant contribution in mathematics performance (ß =0.229), over and beyond other factors in the models. The results favoured private schools in both models, which indicates that Pakistani students enrolled in private schools tend to perform significantly better regardless of grade level and region.
Evidently, the predictive power of school system was relatively greater in science as compared to mathematics. Furthermore, the results revealed that students' performance significantly varied by grade level, where generally performance declined in upper grades, more specifically in mathematics. However, the trend varied across the two subjects. For instance, in science, students enrolled in grades 5 and 8 demonstrated significantly low performance as compared to students enrolled in grade 6. It is important to note that the predictive value was relatively lower for grade 8 (ß =-0.294) than grade 5 (ß =-0.063) in science. On the other hand, there was a consistent decline in students' performance as they progressed to upper grades in mathematics. In other words, as compared to grade 6, students enrolled in grade 5 (ß =0.265) scored significantly greater, while students enrolled in grade 8 (ß =-0.151) scored considerably lower. Moreover, Punjab was considered as a reference category and it was compared against the five regions included in both models. In science and mathematics, students of all the regions demonstrated significantly low performance than the students of Punjab.
Discussion
This nationwide study provided deeper insights into the differences in students' performance across public and private schools in Pakistan. The study is unique for two reasons. Firstly, it is among a handful of studies that attempted to control the factors of grade level and region while examining the differences between public and private schools in terms of students' performance in core subjects such as science and mathematics. Secondly, the current study explored the differences at content and cognitive levels across public and private schools in both science and mathematics in order to develop a holistic picture of the variations. It revealed that students enrolled in private schools performed significantly better even after controlling for other factors, such as grade level and region. When school system and region were controlled, the results illustrated interesting, yet worrisome, trends. For instance, Grade 6 students performed significantly better in science, whereas the performance of Grade 8 students considerably declined. In mathematics, on the other hand, there was a consistent decline in students' performance as they progressed to upper grades, which is a serious cause of concern for all stakeholders (including the government) and demands an instant response. Interestingly, students from Punjab consistently outperformed those from other regions, both in science and mathematics. More specifically, private school students excelled compared to their peers in public schools. The findings corroborate with both international and national research showing better performance of students in private schools (Bhutta et al., 2024; Singh, 2014; Thapa, 2015). This raises many questions related to equitable access to education and underlying causes.
As discussed earlier, the better performance of private schools has been consistently reported at global scale (Adeyemi, 2014; Azimi et al., 2022; Baum & Riley, 2019; Coulson, 2009; Lubienski & Lubienski, 2013; Shakeel & DeAngelis, 2017). To explain the pattern, one need to consider the influence of multifarious factors on students' performance. For example, private schools emphasize academic success, ensure the provision of adequate learning materials and high accountability of teachers. Other advantages of private schools include better infrastructure, well-maintained classrooms, effective supervision, accountability to parents, and governance structures that support high standards of education (Lubienski & Lubienski, 2013; Teodorovicz et al., 2023). Public schools, however, face a plethora of challenges including inadequate resources, lack of accountability, no or less parental involvement, and utilisation of teachers in non-academic tasks (Teodorovicz et al., 2023).
It is interesting to note that the teachers in public schools often have higher qualifications due to pre-defined job rules; however, the performance of students is low as compared to private schools (Ansari et al., 2024; Teodorovicz et al., 2023). This points out the possible differences in teaching quality and classroom engagement in public and private schools. Bhutta and Rizvi (2022) reported that teachers in private schools use more interactive and engaged teaching practices, coupled with using interactive resources, to ensure a supportive learning environment. Possibly, private schools may provide continuous professional development opportunities for their teachers. On the other hand, public school teachers mostly rely on traditional teacher-centred teaching, mainly due to inadequate learning resources and limited capacity for modern teaching approaches (Andrabi et al., 2008; Ansari, 2024; Awan & Zia, 2015). Moreover, public schools often operate under rigid structures, where teachers - viewing their roles as secure - may lack motivation for continuous improvement and professional growth (Cortes, 2022). Furthermore, students' better socioeconomic background, family support, and regular attendance often give private school students an added edge (Ansari et al., 2024; Dahal & Nguyen, 2014).
The governance models of both public and private schools also play a critical role. Private schools typically enjoy greater autonomy and flexibility, allowing them to implement innovative practices and respond to student needs more effectively. Public schools, however, are often constrained by bureaucratic regulations, which can limit their ability to adapt and innovate (Bruce et al., 2019; Cuervo-Cazurra et al., 2014). These differences in management frameworks further highlight why private schools consistently outperform their public counterparts. In contrast, private schools benefit from heightened managerial freedom and more potent incentives. However, these schools are propelled by market dynamics to achieve excellence due to their dependence on monthly fees, while public schools primarily rely on government funding, potentially diminishing their accountability to students and parents alike (Camargo et al., 2018).
Moreover, the improved performance of private schools could be linked to heightened parental involvement, which is a significant predictor of student achievement within the private school system. Families are drawn to private schools due to the perceived quality of learning experiences they offer, especially in comparison to the challenges faced by public schools (Kimenyi, 2013; Ohba, 2013). Arguably, private schools are often seen as providing enhanced facilities, smaller class sizes, and more competent and motivated educators (Baum & Riley, 2019). Within this framework, parental engagement assumes importance as families become more proactive in their children's education to maximize the utilization of the above resources. Furthermore, parents place significant emphasis on school discipline and teacher quality, aspects they believe are superior in private schools (de Talance, 2020; Oketch et al., 2010; Tooley et al., 2008). This emphasis on quality education cultivates a collaborative approach between parents and the school, intensifying parental involvement. The competitive environment in private schools creates a strong sense of accountability (Jabbar et al., 2022; MacLeod & Urquiola, 2012). This, in turn, encourages parents to take an active role in their children's education, ensuring they make the most of what these schools offer. As a result, private schools improve access to education and raise its quality to ensure better academic outcomes. The success of these schools has made them a preferred choice for parents worldwide, including in Pakistan, where their numbers have been steadily increasing (Baum & Riley, 2019; Kingdon, 2020).
In summary, the relatively better performance of private schools in subjects like science and mathematics is shaped by various factors, including the quality of teaching, effective governance, and greater parental involvement. While public schools may benefit from having more highly qualified teachers, private schools foster an environment that drives excellence, which likely accounts for their consistent advantage. To truly understand and improve education across both sectors, it's crucial to investigate these contributing factors and explore ways to enhance the strengths of both public and private schools.
Conclusion
This nationwide study revealed that overall performance in science and mathematics is weak in both public and private schools. However, private schools consistently exhibit relatively better performance in terms of grade levels, content domains, and cognitive domains. These empirical findings emphasize the need for targeted actions to improve the overall performance, particularly focusing on public schools that cater to the majority of students.
Implications and Future Research Directions
Although this paper shows that private schools are doing better than public schools, it also gives some alternative interpretations of the findings. For instance, the mean score of private schools is not high enough to unfold an excellent understanding of students in core subjects, as evident from TIMSS 2019 results. Therefore, these findings need to be taken as a baseline for both public and private schools to devise such interventions that can bring improvement in students' performance. Researchers may conduct longitudinal studies to track the long-term impact of educational interventions and resource allocation on students' performance. Such studies can provide valuable insights into the effectiveness of different strategies and help refine policies to achieve sustained improvements in educational outcomes. Furthermore, future research work can explore the role of socioeconomic factors in enhancing student performance across different school systems. Research should examine how variables such as parental education, household income, and access to extracurricular resources may influence learning outcomes. This, in turn, may help to identify additional areas for policy intervention to support students from disadvantaged backgrounds. Moreover, the findings hold significance in the context of Pakistan's development vision, which aims to foster a knowledge-based economy. In this vision, science and mathematics play a pivotal role in nurturing strong scientific and mathematical literacy. However, the status of these subjects, as revealed by this study, does not align with these goals. Furthermore, Pakistan's commitment to Sustainable Development Goals (SDGs) requires concerted efforts to enhance the quality of education (SDG-4) by the year 2030.
Conflict of Interest
The author of the manuscript has no financial or non-financial conflict of interest in the subject matter or materials discussed in this manuscript.
Data Availability Statement
The data associated with this study will be provided by the corresponding author upon request.
Finding details
This research did not receive grant from any funding source or agency.
Bibliography
- Adeyemi, S. B. (2014). Comparative study of pupils' academic performance between private and public primary schools. World Journal of Education, 4(4), 55–60. http://dx.doi.org/10.5430/wje.v4n4p55
- Ahmed, M., Mahmood, T., Mhyuddin, M. S., & Ghuman, M. A. (2013). Evaluation of school effectiveness of secondary education system: Comparative view of public and private institutions of Pakistan. Journal of Educational and Social Research, 3(3), 121–128. https://doi.org/10.5901/jesr.2013.v4n3p121
- Ajayi, A., & Faremi, M. F. (2006). The influence of school type and location on resource availability and pupils learning outcome in primary schools in Ekiti State, Nigeria. Educational Thought,5(1), 170–176.
- Akhter, N. (2017). Factors affecting parents' inclination towards private school system in Pakistan. Journal of Elementary Education, 27(2), 49–69.
- Alcott, B., & Rose, P. (2016). Does private schooling narrow wealth inequalities in learning outcomes? Evidence from East Africa. Oxford Review of Education, 42(5), 495–510. https://doi.org/10.1080/03054985.2016.1215611
- Andrabi, T., Das, J., & Khwaja, A. (2002). The rise of private schooling in Pakistan: Catering to the urban elite or educating the rural poor. Semantic Scholars. https://economics-files.pomona.edu/Andrabi/Research/Pakschool%20March29.pdf
- Andrabi, T., Das, J., & Khwaja, A. I. (2008). A dime a day: The possibilities and limits of private schooling in Pakistan. Comparative Education Review, 52(3), 329–355. https://doi.org/10.1086/588796
- Andrabi, T., Bau, N., Das, J., & Khwaja, A. I. (2010). Are bad public schools public"bads?" Test scores and civic values in public and private schools. Bulletin of Education & Research, 24(2), 45–56.
- Andrabi, T., Das, J., Khwaja, A. I., & Zajonc, T. (2011). Do value-added estimates add value? Accounting for learning dynamics. American Economic Journal: Applied Economics, 3(3), 29–54. https://doi.org/10.1257/app.3.3.29
- Ansari, A. N. (2024). Student development of social capabilities and life skills: A mixed-methods study from Pakistan. Cambridge Journal of Education, 54(6), 741–760. https://doi.org/10.1080/0305764X.2024.2406426
- Ansari, A. N., Bhutta, S. M., & Ahmad, S. (2024). Teacher professional education and student learning: A secondary analysis of nationwide data. Journal of Contemporary Trends and Issues in Education, 3(2), 80–104. https://doi.org/10.55628/jctie.v3i2.138
- Apple, M. (2010). Global crises, social justice, and education. Routledge.
- Arif, G. M., & Saqib, N. (2003). Production of cognitive life skills in public, private, and NGO schools in Pakistan. Pakistan Development Review, 42, 1–28.
- Annual Status of Education Report. (2020, January 29). Annual status of education report ASER-Pakistan 2019. https://aserpakistan.org/document/aser/2019/reports/national/ASER_National_2019.pdf
- Annual Status of Education Report. (2022, March 10). Annual status of education report ASER-Pakistan 2021. https://aserpakistan.org/document/aser/2021/reports/national/ASER_report_National_2021.pdf
- Aslam, M. (2007). The relative effectiveness of government and private schools in Pakistan: Are girls worse off? (Working Paper No. 4). University of Cambridge. https://www.ssoar.info/ssoar/handle/document/6713
- Awan, A. G., & Zia, A. (2015). Comparative analysis of public and private educational institutions: A case study of district Vehari-Pakistan. Journal of Education and Practice, 6(16), 122–130.
- Azimi, E., Friesen, J., & Woodcock, S. D. (2022). Private schools and student achievement. Simon Fraser University. https://www.sfu.ca/repec-econ/sfu/sfudps/dp22-03.pdf
- Baum, D. R., & Riley, I. (2019). The relative effectiveness of private and public schools: evidence from Kenya. School Effectiveness and School Improvement, 30(2), 104–130. https://doi.org/10.1080/09243453.2018.1520132
- Beese, J., & Liang, X. (2010). Do resource matter? PISA science achievement comparisons between students in the United States, Canada, and Finland. Improving Schools, 13(3), 266–279. https://doi.org/10.1177/1365480210390554
- Bhutta, S. M., Rizvi, N. F. (2022). Assessing teachers' pedagogical practices and students' learning outcomes in science and mathematics across primary and secondary school level: A nationwide study (2018-21). Aga Khan University, Institute for Educational Development, Karachi, Pakistan. https://ecommons.aku.edu/pakistan_ied_pdck/317
- Bhutta, S. M., Ansari, A. N., & Ahmad, S. (2024). Gender disparity in students' performance of Science and Mathematics: Evidence from nationwide study in Pakistan. Journal of Education and Educational Development, 11(1), 25–44. https://doi.org/10.22555/joeed.v11i1.912
- Bowles, S., & Gintis, H. (2002). Schooling in capitalist America revisited. Sociology of Education, 75(1), 1–18. https://doi.org/10.2307/3090251
- Bruce, J. R., de Figueiredo, J. M., & Silverman, B. S. (2019). Public contracting for private innovation: Government capabilities, decision rights, and performance outcomes. Strategic Management Journal, 40(4), 533–555. https://doi.org/10.1002/smj.2973
- Camargo, B., Camelo, R., Firpo, S., & Ponczek, V. (2018). Information, market incentives, and student performance: Evidence from a regression discontinuity design in Brazil. Journal of Human Resources, 53(2), 414–444. https://doi.org/10.3368/jhr.53.2.0115-6868R1
- Camelo, R., & Ponczek, V. (2021). Teacher turnover and financial incentives in underprivileged schools: Evidence from a compensation policy in a developing country. Economics of Education Review, 80, Article e102067. https://doi.org/10.1016/j.econedurev.2020.102067
- Cortes, V. M. (2022). Academic instructional practices of public and private elementary schools: A framework model. Multicultural Education, 8(5), 137–145.
- Coulson, A. J. (2009). Comparing public, private, and market schools: The international evidence. Journal of School Choice, 3(1), 31–54. https://doi.org/10.1080/15582150902805016
- Creemers, B., & Kyriakides, L. (2018). Developing, testing, and using theoretical models for promoting quality in education. In K. M. Merki, M. Emmerich, & M. Holmeier (Eds.), Educational effectiveness theory: Further developments in a multilevel context (pp. 99–116). Routledge.
- Cuervo-Cazurra, A., Inkpen, A., Musacchio, A., & Ramaswamy, K. (2014). Governments as owners: State-owned multinational companies. Journal of International Business Studies, 45, 919–942. https://doi.org/10.1057/jibs.2014.43
- Dahal, M., & Nguyen, Q. (2014). Private non-state sector engagement in the provision of educational services at the primary and secondary levels in South Asia: An analytical review of its role in school enrolment and student achievement (Policy Research Working Paper No. 6899). World Bank Group. https://openknowledge.worldbank.org/bitstream/handle/10986/18786/WPS6899.pdf?sequence=1&isAllowed=y
- de Talance, M. (2020). Private and public education: Do parents care about school quality? Annals of Economics and Statistics, (137), 117–144. https://doi.org/10.15609/annaeconstat2009.137.0117
- Farooq, M. S., Chaudhry, A. H., Shafiq, M., & Berhanu, G. (2011). Factors affecting students' quality of academic performance: A case of secondary school level. Journal of Quality and Technology Management, 7(2), 1–14.
- Field, A. (2017). Discovering statistics using IBM SPSS statistics (6th ed.). Sage Publications.
- French, R., & Kingdon, G. (2010). The relative effectiveness of private and government schools in rural India: Evidence from ASER data (Dept. of Quantitative Social Science Working Paper, 10-03). University of London. https://www.isid.ac.in/~pu/conference/dec_10_conf/Papers/RobertFrench.pdf
- Gess-Newsome, J., Taylor, J. A., Carlson, J., Gardner, A. L., Wilson, C. D., & Stuhlsatz, M. A. (2019). Teacher pedagogical content knowledge, practice, and student achievement. International Journal of Science Education, 41(7), 944–963. https://doi.org/10.1080/09500693.2016.1265158
- Government of Pakistan. (2016). National assessment reports 2016. https://pie.gov.pk/SiteImage/Publication/NAT%20Report%202016.pdf
- Goyal, S. (2009). Inside the house of learning: The relative performance of public and private schools in Orissa. Education Economics, 17(3), 315–327. https://doi.org/10.1080/09645290903142577
- Jabbar, H., Fong, C. J., Germain, E., Li, D., Sanchez, J., Sun, W. L., & Devall, M. (2022). The competitive effects of school choice on student achievement: A systematic review. Educational Policy, 36(2), 247–281. https://doi.org/10.1177/0895904819874756
- Kimenyi, M. S. (2013, September 7). The bad economics of free primary education. The Brookings Institution. https://www.brookings.edu/articles/the-bad-economics-of-free-primary-education/
- Kingdon, G. G. (2020). The private schooling phenomenon in India: A review. The Journal of Development Studies, 56(10), 1795–1817. https://doi.org/10.1080/00220388.2020.1715943
- Kcak, O., Goksu, İ., & Goktas, Y. (2021). The factors affecting academic achievement: A systematic review of meta analyses. International Online Journal of Education and Teaching, 8(1), 454–484.
- Kraft, M. A., Marinell, W. H., & Shen-Wei Yee, D. (2016). School organizational contexts, teacher turnover, and student achievement: Evidence from panel data. American Educational Research Journal, 53(5), 1411–1449. https://doi.org/10.3102/0002831216667478
- Krejcie, R. V., & Morgan, D. W. (1970). Determining sample size for research activities. Educational and Psychological Measurement, 30(3), 607–610. https://doi.org/10.1177/001316447003000308
- Kyriakides, L., Creemers, B. P., & Panayiotou, A. (2018). Using educational effectiveness research to promote quality of teaching: The contribution of the dynamic model. ZDM Mathematics Education, 50, 381–393. https://doi.org/10.1007/s11858-018-0919-3
- Kyriakides, L., Creemers, B., & Charalambous, E. (2018). Equity and quality dimensions in educational effectiveness (Vol. 8). Springer.
- Lubienski, C. A., & Lubienski, S. T. (2013). The public school advantage: Why public schools outperform private schools. University of Chicago Press.
- MacLeod, W. B., & Urquiola, M. (2013). Competition and educational productivity: Incentives writ large. In P. Glewwe (Ed.), Education policy in developing countries (pp. 243–284). University of Chicago Press.
- Miles, J., & Shevlin, M. (2000). Applying regression and correlation: A guide for students and researchers. Sage Publication.
- Mohammadpour, E., & Shekarchizadeh, A. (2015). Mathematics achievement in high- and low- achieving secondary schools. Educational Psychology, 35(6), 689–713. https://doi.org/10.1080/01443410.2013.864753
- Mushtaq, I., & Khan, S. N. (2012). Factors affecting students' academic performance. Global Journal of Management and Business Research, 12(9), 17–22.
- Naseer, M. F., Patnam, M., & Raza, R. R. (2010). Transforming public schools: Impact of the CRI program on child learning in Pakistan. Economics of Education Review, 29(4), 669–683. https://doi.org/10.1016/j.econedurev.2009.12.001
- Nath, S. R. (2012). Factors influencing primary students' learning achievement in Bangladesh. Research in Education, 88(1), 50–63. https://doi.org/10.7227/RIE.88.1.5
- Ndaji, F., Little, J., & Coe, R. (2016). A comparison of academic achievement in independent and state schools. Centre for Evaluation and Monitoring, Durham University. https://www.isc.co.uk/media/3140/16_02_26-cem-durham-university-academic-value-added-research.pdf
- Organisation for Economic Cooperation and Development. (2019, April 26). PISA 2018 assessment and analytical framework. https://doi.org/10.1787/b25efab8-en
- Ohba, A. (2013). Do low-cost private school leavers in the informal settlement have a good chance of admission to a government secondary school? A study from Kibera in Kenya. Compare: A Journal of Comparative and International Education, 43(6), 763–782. https://doi.org/10.1080/03057925.2012.733536
- Oketch, M., Mutisya, M., Ngware, M., & Ezeh, A. C. (2010). Why are there proportionately more poor pupils enrolled in non-state schools in urban Kenya in spite of FPE policy? International Journal of Educational Development, 30(1), 23–32. https://doi.org/10.1016/j.ijedudev.2009.08.001
- Pal, G. C. (2020). School-readiness among the underprivileged: The neglected dimension. Contemporary Education Dialogue, 17(2), 177–201. https://doi.org/10.1177/0973184920931772
- Sakellariou, C. (2017). Private or public school advantage? Evidence from 40 countries using PISA 2012-Mathematics. Applied Economics, 49(29), 2875–2892. https://doi.org/10.1080/00036846.2016.1248361
- Shakeel, M. D., & DeAngelis, C. A. (2017). Who is more free? A comparison of the decision-making of private and public school principals. Journal of School Choice, 11(3), 442–457. https://doi.org/10.1080/15582159.2017.1345235
- Singh, A. (2014). Test score gaps between private and government sector students at school entry age in India. Oxford Review of Education, 40(1), 30–49. https://doi.org/10.1080/03054985.2013.873529
- Smith-Woolley, E., Pingault, J., Selzam, S., Rimfeld, K., Krapohl, E., Von Stumm, S., Asbury, K., Dale, P. S., Young, T., Allen, R., Kovas, Y., & Plomin, R. (2018). Differences in exam performance between pupils attending selective and non-selective schools mirror the genetic differences between them. Science of Learning, 3(3), Article e3. https://doi.org/10.1038/s41539-018-0019-8
- Suhaini, M., Ahmad, A., & Harith, S. H. (2020). Factors influencing student achievement: A systematic review. International Journal of Psychosocial Rehabilitation, 24(5), 550–560. https://doi.org/10.37200/IJPR/V24I5/PR201720
- Tabachnick, B. G., Fidell, L. S., & Ullman, J. B. (2013). Using multivariate statistics (Vol. 6). Pearson.
- Teodorovicz, T., Lazzarini, S., Cabral, S., & Nardi, L. (2023). Can public organizations perform like private firms? The role of heterogeneous resources and practices. Organization Science, 34(4), 1527–1553. https://doi.org/10.1287/orsc.2022.1634
- Thapa, A. (2015). Public and private school performance in Nepal: An analysis using the SLC examination. Education Economics, 23(1), 47–62. https://doi.org/10.1080/09645292.2012.738809
- Tooley, J., & Dixon, P. (2005). Private education is good for the poor: A study of private schools serving the poor in low-income countries. Cato Institute.
- Zuilkowski, S. S., Piper, B., Ong'ele, S., & Kiminza, O. (2018). Parents, quality, and school choice: Why parents in Nairobi choose low-cost private schools over public schools in Kenya's free primary education era. Oxford Review of Education, 44(2), 258–274. https://doi.org/10.1080/03054985.2017.1391084
Appendix A